. 2024 May;31(5):791-800.
doi: 10.1038/s41594-024-01279-6. Epub 2024 May 7.

Deregulated DNA ADP-ribosylation impairs telomere replication

Affiliations

Deregulated DNA ADP-ribosylation impairs telomere replication

Anne R Wondisford et al. Nat Struct Mol Biol. 2024 May.

Abstract

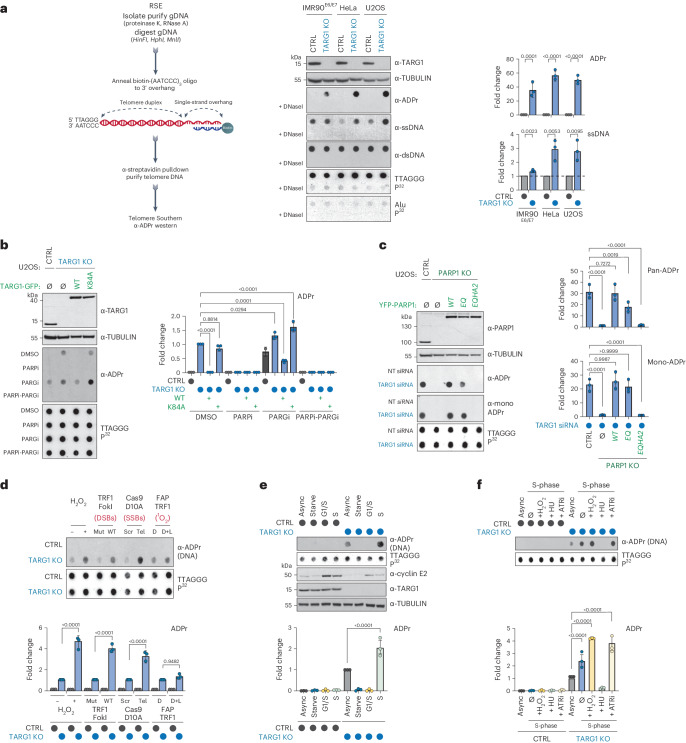
The recognition that DNA can be ADP ribosylated provides an unexpected regulatory level of how ADP-ribosylation contributes to genome stability, epigenetics and immunity. Yet, it remains unknown whether DNA ADP-ribosylation (DNA-ADPr) promotes genome stability and how it is regulated. Here, we show that telomeres are subject to DNA-ADPr catalyzed by PARP1 and removed by TARG1. Mechanistically, we show that DNA-ADPr is coupled to lagging telomere DNA strand synthesis, forming at single-stranded DNA present at unligated Okazaki fragments and on the 3' single-stranded telomere overhang. Persistent DNA-linked ADPr, due to TARG1 deficiency, eventually leads to telomere shortening. Furthermore, using the bacterial DNA ADP-ribosyl-transferase toxin to modify DNA at telomeres directly, we demonstrate that unhydrolyzed DNA-linked ADP-ribose compromises telomere replication and telomere integrity. Thus, by identifying telomeres as chromosomal targets of PARP1 and TARG1-regulated DNA-ADPr, whose deregulation compromises telomere replication and integrity, our study highlights and establishes the critical importance of controlling DNA-ADPr turnover for sustained genome stability.


Conflict of interest statement

The authors declare no competing interests.

Figures

Fig. 1
Fig. 1. TARG1 mediated ADP-ribosylation of telomere DNA.
a, RSE methodology (left), western blot, telomeric western dot blot of ADPr, ssDNA, dsDNA and Southern blot of telomeric DNA and Alu repeats of CTRL and TARG1-KO IMR90E6/E7, HeLa and U2OS cells (middle) and quantification of ADPr and ssDNA normalized to the CTRL line (right). b, Western blot and telomeric western dot blot of ADPr and Southern blot of telomeric DNA (left) of U2OS CTRL, TARG1-KO and TARG1-KO cells with expression of either GFP-tagged full-length (WT) TARG1 or TARG1-K84A treated with dimethylsulfoxide (DMSO), PARPi, PARGi or PARPi and PARGi and quantification of ADPr of the samples normalized to TARG1-KO + DMSO (right). c, Western blot and telomeric western dot blot of ADPr and mono-ADPr and Southern blot of telomeric DNA (left) of U2OS CTRL, PARP1-KO and PARP1-KO cells with inducible expression of YFP-tagged full-length (WT) PARP1, PARP1 E998Q or PARP1-EQHA2 after control or TARG1 knockdown and quantification of pan-ADPr and mono-ADPr (right). Quantifications are normalized to U2OS CTRL siCTRL (data not shown). d, Telomeric western dot blot and Southern blot of telomeric DNA (top) and ADPr quantification (bottom) of U2OS CTRL and TARG1-KO treated with H2O2, transiently transfected with TRF1-FokI (D450A or WT), Cas9 D10A (scr or tel) or FAP-TRF1 cells treated with dye or dye and light. Each quantification is normalized to control conditions. e, Telomeric western dot blot of ADPr and Southern blot of telomeric DNA and western blot (top) and ADPr quantification (bottom) of U2OS CTRL and TARG1-KO in asynchronous (Async), serum-starved (starve), G1/S or S phases. Quantification is normalized to TARG1-KO (async). f, Telomeric DNA-ADPr dot blot (top) and ADPr quantification (bottom) of U2OS CTRL and TARG1-KO in either asynchronous (async) or S-phase treated with H2O2 (2 mM, 15 min), hydroxyurea (HU) (2 mM, 1 h) or ATR inhibitor (ATRi) (5 nM, 1 h). Quantification is normalized to TARG1-KO (async). Mean and s.e.m. are shown from three independent experiments in af, and groups were compared with a one-way ANOVA followed by Tukey’s multiple-comparisons test for pairwise comparisons. Source data
Fig. 2
Fig. 2. DNA-ADPr is associated with lagging strand telomere replication.
a, CsCl density gradient centrifugation of IdU-pulsed U2OS TARG1-KO cells methodology (top) to separate leading and lagging telomeric DNA strands. Southern blot of telomeric DNA and telomeric western ADPr slot blot (bottom left) with quantification of the corresponding strands (bottom right). gDNA, genomic DNA. a.u., arbitrary units. b, Schematic of effects of POT1 knockdown (siPOT1) or FEN1 inhibition (FEN1i) (top). Telomeric western dot blot of ADPr, ssDNA, dsDNA and Southern blot of telomeric DNA of U2OS CTRL and TARG1-KO with either FEN1i or siPOT1 treated with adarotene (Ada) or emetine (Eme). c, Quantification of ADPr (top) or ssDNA (bottom). Quantification of ADPr and ssDNA dot blots (right) normalized to TARG1-KO + DMSO and CTRL + DMSO, respectively. Data represent the mean ± s.e.m., n = 3 biological replicates and groups were compared with a one-way ANOVA followed by Tukey’s multiple-comparisons test for pairwise comparisons. d, DNA from CTRL and TARG1-KO HeLa, IMR90E6/E7 and U2OS cells treated with exoI, ran on a gel and probed for telomeric DNA in native and denaturing Southern blots. Telomeric western dot blot for ADPr (bottom). Quantification of the native/denatured telomeric DNA ratio (left) normalized to corresponding HeLa, IMR90E6/E7 or U2OS CTRL line and quantification of ADPr dot blot (right) normalized to TARG1-KO without exoI treatment for each corresponding cell line. Data represent the mean ± s.e.m., n = 2 biological replicates and groups were compared with a one-way ANOVA followed by Tukey’s multiple-comparisons test for pairwise comparisons. e, SMAT-representative fibers (top) and quantification of telomere fiber length (left), EdU tract length at telomeres (middle) and normalized EdU tract length (right). Data represent the mean ± s.e.m. of three biological replicates (>400 fibers scored (two-tailed Mann–Whitney test)) (left and middle). Data on the right are shown in box and whisker format with minimum and maximum values and median line. f, Telomere length analysis by PFGE of CTRL and TARG1-KO HeLa, U2OS and IMR90E6/E7 cells with indicated population doublings (PDs) following transfection with Cas9 and single-guide RNAs. Red dots indicate mean telomere lengths. Source data
Fig. 3
Fig. 3. Direct targeting of telomeres via a DarT-TRF1 endotoxin fusion.
a, Schematic of GFP-tagged DarT-TRF1-induced telomeric DNA ADP-ribosylation and subsequent removal by DarG (red). b, Immunofluorescence of U2OS CTRL and TARG1-KO cells after expression of GFP-tagged WT-DarT-TRF1 (WT) or E160A DarT-TRF1 (mut) and FLAG-tagged WT-DarG or K80A DarG (left) and quantification of colocalization of mono-ADPr and GFP-positive telomeres (right). In all conditions, more than 140 cells were analyzed. Scale bars represent 10 μm. c, Western blot of U2OS CTRL and TARG1-KO cells after expression of GFP-tagged WT-DarT-TRF1 (WT) or E160A DarT-TRF1 (mut) and FLAG-tagged WT-DarG (WT) or K80A DarG (mut). U2OS CTRL and TARG1-KO were treated with 2 mM H2O2 and 2 mM H2O2 with PARPi for positive and negative controls, respectively. d, Telomeric western dot blot of ADPr, ssDNA, dsDNA and Southern blot of telomeric DNA. e, Quantification of ADPr (top) normalized to TARG1-KO and ssDNA (bottom) normalized to TARG KO and CTRL, respectively. after expression of vectors in c. Mean and s.e.m. are shown from three independent experiments in b and e, and groups were compared with a one-way ANOVA followed by Tukey’s multiple-comparisons test for pairwise comparisons. Source data
Fig. 4
Fig. 4. Unhydrolyzed telomere DNA-ADPr impairs telomere integrity.
a, Representative SMAT fibers (left) of U2OS CTRL and TARG1-KO cells after expression of WT-DarT-TRF1 (WT) or E160A DarT-TRF1 (mut), quantification of EdU tract length at telomeres (middle) and normalized EdU tract length (right). Mean and s.e.m. (middle) and a box and whisker plot with minimum and maximum values and median line (right). Results shown are from three independent experiments and groups were compared with Mann–Whitney tests (>200 fibers scored per condition). b, Immunofluorescence images of U2OS CTRL and TARG1-KO cells (left) after expression of GFP-tagged WT-DarT-TRF1 (WT) or E160A DarT-TRF1 (mut) and quantification of percentage of RPA2 + GFP-positive telomeres (right) with more than 150 cells analyzed per condition. Scale bars represent 10 μm. c, CO-FISH representative images of U2OS CTRL and TARG1-KO chromosomes after dox-inducible expression of either GFP-tagged WT-DarT-TRF1 (WT) or E160A DarT-TRF1 (mut). d, CO-FISH quantification of percentage leading (red) and lagging (green) fragile telomeres (left) and percentage telomere sister chromatid exchanges (telomere SCEs) (right) of images in c (>5,000 telomeres scored per condition). e, Colony formation assay representative images of U2OS CTRL and TARG1-KO cells after transient expression of either GFP-tagged WT-DarT-TRF1 (WT) or E160A DarT-TRF1 (mut) and FLAG-tagged WT-DarG (WT) or K80A DarG (mut). f, Quantification of the number of colonies from e normalized to CTRL. Mean and s.e.m. are shown from three independent experiments in b, d and f, and groups were compared with a one-way ANOVA followed by Tukey’s multiple-comparisons test for pairwise comparisons. Source data
Extended Data Fig. 1
Extended Data Fig. 1. DNA-ADPr is stimulated by PARP1 and removed by TARG1.
a) IF of poly ADP-ribose U2OS CTRL and TARG1 KO cells with PARGi treatment (96 hours). Images (left) and quantification of the number of ADPr+ telomeres (TRF1) per cell (right). Data represent the mean and s.e.m. of biological replicates (>4000 cells counted per condition). A two-tailed Student’s t-test was performed on n = 2 biologically independent experiments. b) Telomeric western dot blot of ADPr and Southern blot of telomeric DNA of U2OS CTRL and TARG1 KO telomeric DNA treated with full-length TARG1, K84A TARG1, PARG, and DarG proteins (left) and quantification (right). c) Telomeric western dot blot of ADPr and Southern blot of telomeric DNA and western blot (left) and ADPr quantification (right) of U2OS CTRL and TARG1 KO after control, PARP1, PARP2, PARG, ARH3, or HPF1 knockdown normalized to TARG1 KO NT siRNA. d) Western blot of U2OS CTRL, PARP1 KO, and PARP1 KO with expression of either YFP-tagged full-length (WT) PARP1, PARP1 EQ, or PARP1-EQHA2 after control or TARG1 knockdown. e) IF representative images of expression of TRF1-FokI (FLAG-red), Cas9 D10A (Cas9-red), or FAP-TRF1 (mCer-red) and telomere FISH (green) in U2OS CTRL and TARG1 KO cells. This was repeated three biologically independent times with similar results. f) Western blot of U2OS CTRL and TARG1 KO cells after treatment with H2O2 or expression of TRF1-FokI (D450A or WT), Cas9 D10A (scr or tel), or FAP-TRF1 (dye or dye and light). g) Flow cytometry of U2OS CTRL and TARG1 KO cells in asynchronous (async), serum-starved (starve), G1/S, or S phases. Mean and s.e.m. are shown for three independent experiments for G1 (grey), S (blue), and G2/M (yellow). h) Western blot of U2OS CTRL and TARG1 KO in either asynchronous (async) or S phase treated with H2O2 (2 mM–15 mins), HU (2mM- 1 hr), or ATRi (5 nM- 1 hr). Mean and s.e.m. are shown from three independent experiments in (B) and (C), and groups were compared with a one-way ANOVA followed by Tukey’s multiple-comparisons test for pairwise comparisons. For (A) and (E), scale bars represent 10 um. Source data
Extended Data Fig. 2
Extended Data Fig. 2. TARG1 deficiency impairs telomere replication.
a) Western blots of U2OS CTRL and TARG1 KO cells after knockdown of FEN1 (left), Lig1 (middle), or POT1 (right). b) Telomeric western dot blot of ADPr and Southern blot of telomeric DNA of U2OS CTRL and TARG1 KO after control, Lig1 or FEN1 knockdown. c) Quantification ADPr and ssDNA from (b) normalized to TARG KO NT siRNA. d) GFP-tagged full-length (WT) TARG1 or TARG1-K84A DNA ran on a gel and probed for telomeric DNA in native and denaturing Southern blots. Quantification of the ratio of native/denatured telomeric DNA detected normalized to CTRL (right). Mean and s.e.m. are shown from n = 2 biologically independent experiments and groups were compared with a one-way ANOVA followed by Tukey’s multiple-comparisons test for pairwise comparisons. e) Schematic of separation of function POT1 mutants. The R83E mutant exposes the 5’ end at the double/single-stranded DNA junction and the F62A mutant increases the exposed ssDNA. f) Western blot of HEK293E POT1 cells treated with OHT (0.5 uM) to deplete POT1 and then doxycycline (1 ug/mL) to express either myc-tagged WT POT1, F62A POT1, or R83E POT1 with control or TARG1 knockdown. g) Telomeric western dot blot of ADPr and ssDNA and Southern blot of telomeric DNA with conditions used in (e). h) Quantification of ADPr and ssDNA from (f) normalized to CTRL TARG1 siRNA and CTRL NT siRNA, respectively. i) IF-FISH of 53BP1 and telomeres in U2OS CTRL and TARG1 KO cells. Images (left) and quantification of ADPr+ telomeres (right). Data represent the mean and s.e.m. of n = 2 biological replicates ( > 100 cells analyzed per condition) compared with one-way ANOVA followed by Tukey’s multiple-comparisons test for pairwise comparisons. j) IF-FISH of RPA2 and telomeres in U2OS CTRL and TARG1 KO cells. Yellow circles highlight micronuclei (MN) containing RPA2 foci and TTAGGG signals. Images (left) and quantification of DAPI-positive, DAPI-telomere, and DAPI-RPA2-telomere-positive micronuclei. Data represent the mean and s.e.m. n = 3 biological replicates ( > 1000 cells analyzed (Two-tailed student’s t-test)). Mean and s.e.m. are shown from three independent experiments in (C) and (H), and groups were compared with a one-way ANOVA followed by Tukey’s multiple-comparisons test for pairwise comparisons. For (I) and (J), scale bars represent 10 um. Source data
Extended Data Fig. 3
Extended Data Fig. 3. DarT-TRF1 targets DNA-ADPr to the telomere.
a) IF images (left) of WT DarT-TRF1 (WT) treated with PARPi and mut DarT-TRF1 (mut) and quantification of colocalization of the telomere (TRF2) and GFP (right) with more than 100 cells analyzed per condition in n = 2 biologically independent experiments. b) IF images (left) of U2OS CTRL and TARG1 KO cells after transient expression of WT DarT-TRF1 (WT) treated with PARPi and mut DarT-TRF1 (mut) and quantification of the colocalization of GFP (telomere) and mono-ADPr (red) (right) with more than 150 cells analyzed per condition. N = 3 shown from three biologically independent experiments. c) Telomeric western dot blot of ADPr and Southern blot of telomeric DNA of U2OS CTRL and TARG1 KO with reconstitution of either GFP-tagged full-length (WT) TARG1 or TARG1-K84A after transient expression of WT DarT-TRF1 (WT) or mut DarT-TRF1 (mut) and quantification ADPr (right) normalized to TARG1 KO with mut DarT-TRF1 expression. N = 2 shown from two biologically independent experiments. d) Telomeric western dot blot (left) Southern blot of telomeric DNA of U2OS CTRL and TARG1 KO cells after expression of WT DarT-TRF1 and either FEN1 inhibition (FEN1i) or POT1 knockdown (siPOT1) treated with adarotene (ADA) or emetine (EME) and quantification of ADPr (right) normalized to TARG1KO with WT DarT-TRF1 expression treated with DMSO. N = 3 shown from three biologically independent experiments. Mean and s.e.m. are shown from at least two independent experiments in (A), (B), (C) and (D), and groups were compared with a one-way ANOVA followed by Tukey’s multiple-comparisons test for pairwise comparisons. For (A) and (B), scale bars represent 10 um. Source data
Extended Data Fig. 4
Extended Data Fig. 4. TARG1 loss impairs telomere integrity.
a) IF images (left) of EdU-pulsed U2OS CTRL and TARG1 KO cells after expression of WT DarT-TRF1 (WT) or E160A DarT-TRF1 (mut) and quantification of % EdU-positive telomeres (right). ( > 150 cells analyzed per condition). Mean and s.e.m. are shown from three independent experiments and groups were compared with a one-way ANOVA followed by Tukey’s multiple-comparisons test for pairwise comparisons. Scale bars represent 10 um. b) Western blot of U2OS CTRL and TARG1 KO cells after transient expression of WT DarT-TRF1 (WT) or mut DarT-TRF1 (mut). c) Flow cytometry of U2OS CTRL and TARG1 KO cells after inducible expression of WT DarT-TRF1 (WT) or mut DarT-TRF1 (mut). Mean and s.e.m. of three biologically independent experiments are shown for G1 (grey), S (blue), and G2/M (yellow). d) Chromosome-Orientation FISH (CO-FISH) representative images of normal and lagging (green) strand fragile telomeres of U2OS CTRL and TARG1 KO cells and quantification of % leading (red) and lagging (green) fragile telomeres in U2OS and IMR90E6/E7 CTRL AND TARG1 KO cells (>7000 U2OS and >5000 IMR90E6/E7 telomeres scored). e) CO-FISH representative images of normal telomeres and telomere sister chromatid exchanges (telomere SCEs) of U2OS CTRL and TARG1 KO cells and quantification of % telomere SCEs from cells in (D). Mean and s.e.m. are shown from three independent experiments in (D) and (E) and groups were compared with a two-tailed Student’s t-test. Source data
Extended Data Fig. 5
Extended Data Fig. 5. Model for how persistent DNA-ADPr impacts telomere replication.
During telomere replication in S-phase, single-stranded DNA at unligated Okazaki fragments on the lagging strand stimulates DNA ADP-ribosylation (DNA-ADPr) by PARP1. Normally, this DNA-ADPr is quickly removed by TARG1’s hydrolytic activity to maintain DNA replication fidelity and progression. However, in TARG1-deficient cells, the unhydrolyzed DNA-ADPr interferes with telomere replication leading to the uncoupling of DNA strand synthesis and persistent post-replicative DNA-ADPr ssDNA gaps in telomeres that are associated with the fragile telomere phenotype. In addition, the availability of ssDNA on the 3’overhang might also attract PARP1’s DNA-ADPr activity. Failure to remove DNA-ADPr from the 3’overhang might interfere with telomere replication by briefly preventing POT1 binding and/or by disrupting fill-in DNA synthesis that is mediated by the CTC1-STN1-TEN1 (CST)-Polα primase complex, leading to telomere shortening in TARG1 deficient cells.

References

    1. Suskiewicz MJ, Prokhorova E, Rack JGM, Ahel I. ADP-ribosylation from molecular mechanisms to therapeutic implications. Cell. 2023;186:4475–4495. doi: 10.1016/j.cell.2023.08.030. - DOI - PMC - PubMed
    1. Talhaoui I, et al. Poly(ADP-ribose) polymerases covalently modify strand break termini in DNA fragments in vitro. Nucleic Acids Res. 2016;44:9279–9295. - PMC - PubMed
    1. Munnur D, Ahel I. Reversible mono‐ADP‐ribosylation of DNA breaks. FEBS J. 2017;284:4002–4016. doi: 10.1111/febs.14297. - DOI - PMC - PubMed
    1. Groslambert J, Prokhorova E, Ahel I. ADP-ribosylation of DNA and RNA. DNA Repair. 2021;105:103144. doi: 10.1016/j.dnarep.2021.103144. - DOI - PMC - PubMed
    1. Munnur D, et al. Reversible ADP-ribosylation of RNA. Nucleic Acids Res. 2019;47:5658–5669. doi: 10.1093/nar/gkz305. - DOI - PMC - PubMed

Substances