. 2025 Mar;43(3):406-415.
doi: 10.1038/s41587-024-02218-y. Epub 2024 May 7.

Decrypting the molecular basis of cellular drug phenotypes by dose-resolved expression proteomics

Affiliations

Decrypting the molecular basis of cellular drug phenotypes by dose-resolved expression proteomics

Stephan Eckert et al. Nat Biotechnol. 2025 Mar.

Abstract

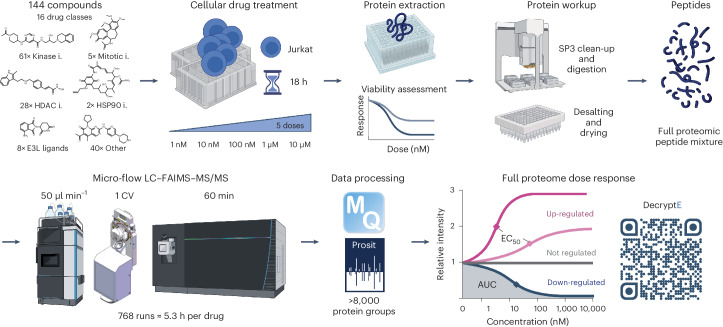
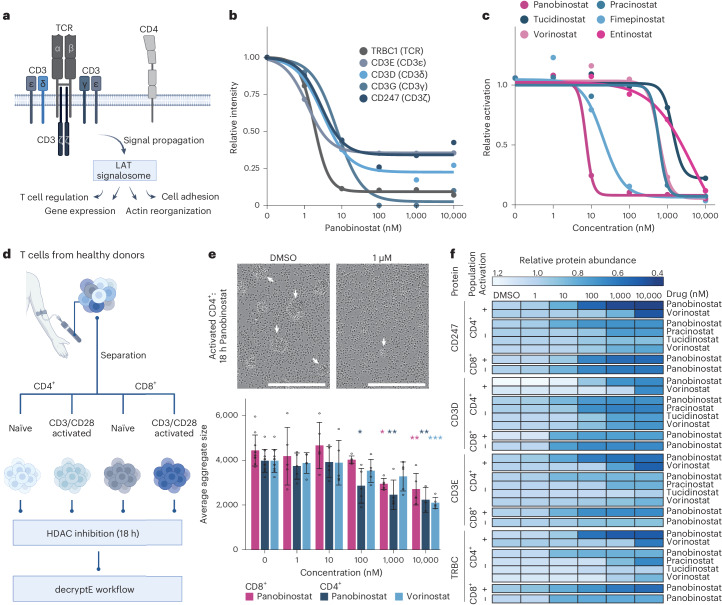
Proteomics is making important contributions to drug discovery, from target deconvolution to mechanism of action (MoA) elucidation and the identification of biomarkers of drug response. Here we introduce decryptE, a proteome-wide approach that measures the full dose-response characteristics of drug-induced protein expression changes that informs cellular drug MoA. Assaying 144 clinical drugs and research compounds against 8,000 proteins resulted in more than 1 million dose-response curves that can be interactively explored online in ProteomicsDB and a custom-built Shiny App. Analysis of the collective data provided molecular explanations for known phenotypic drug effects and uncovered new aspects of the MoA of human medicines. We found that histone deacetylase inhibitors potently and strongly down-regulated the T cell receptor complex resulting in impaired human T cell activation in vitro and ex vivo. This offers a rational explanation for the efficacy of histone deacetylase inhibitors in certain lymphomas and autoimmune diseases and explains their poor performance in treating solid tumors.


Conflict of interest statement

Competing interests: B.K. is founder and shareholder of OmicScouts and MSAID. He has no operational role in either company. All other authors declare no competing interests.

Figures

Fig. 1
Fig. 1. DecryptE workflow for the proteome-wide and dose-dependent characterization of drug-induced protein expression changes.
See text and methods for details (i, inhibitor; E3L, E3 ligase; AUC, area under the curve).
Fig. 2
Fig. 2. Summary of drug-induced expression changes.
a, Pie chart of the absolute number and relative distribution of dose–response curve categories. b, Bar plot showing the number of up- or down-regulated proteins for each of the 144 drugs (inh., inhibitor; Methyltr., methyltransferase). c, Pie chart of the proportion of drugs that did or did not lead to expression changes of at least one designated target protein. d, Radar plot showing the number of drugs that changed the expression of the protein TYMS. The length of each line indicates the pEC50 (−log10 EC50) of the observed regulation. MTX and pemetrexed are highlighted because TYMS is a designated target of both drugs. e, Same as d but showing all proteins that are regulated by the drug Tanespimycin. The highlighted proteins are targets of this drug. f, Bar plot showing the number of drugs (y axis) that regulate a particular target protein. The proportions of drugs for which a particular protein is a designated target are highlighted in pink.
Fig. 3
Fig. 3. Molecular mechanisms underlying drug-induced protein expression changes measured by decryptE profiling.
a, Example dose–response curves of drug-induced abundance changes of proteins (blue) and mRNA (pink). b, From left to right, the dose–response curves for CLK1–4 following Brigatinib treatment. Binding affinities of Brigatinib and CLK1,2,4 (pKd = −log10 Kd) determined by kinobead assays. Schematic representation of the two major transcripts for CLK proteins and how the ratio between the two domains shifts to a 1:1 ratio on CLK inhibition. The triangle represents the N-terminal (N term) domain; the dot represents the kinase domain of the protein. Bar plot showing the ratio of the N term and kinase domain transcripts (determined by RT–qPCR) for CLK1–4 as a function of the dose of Brigatinib. c, Comparison of drug-induced mRNA and protein expression changes for seven drugs. The bar plots in the middle panel show the fraction of up-, down- or not regulated proteins (left bars) and mRNAs (right bars). The Venn diagrams in the upper panel show the number and overlap of up-regulated proteins versus mRNAs (data confined to mRNAs for which also a protein was detected). The bottom panel shows the same but for down-regulation.
Fig. 4
Fig. 4. Groups of drugs with similar cellular MoA.
a, Clustered heatmap of drugs and GO terms enriched by proteins that are up- or down-regulated on drug treatment. b, Analysis of drugs in clusters C1 and C2 of a showing that the drugs in each cluster similarly affect protein expression at different stages of the cell cycle. c, Example dose–response curves for PLK1 and three drugs affecting protein expression at the G2/M checkpoint (cluster C1). d, Distribution of the potencies depicted as pEC50 (−log10 EC50) with which each respective drug affects protein expression. e, Same as c but for ANLN expression and drugs affecting the G1 checkpoint (cluster C2). f, Same as d but for drugs affecting protein expression at the G1 checkpoint.
Fig. 5
Fig. 5. HDAC inhibitors compromise the function of human T cells.
a, Schematic representation of TCR signaling and cellular outcomes. b, Dose-dependent reduction of the expression of TCR components in response to panobinostat in Jurkat cells. c, Dose-dependent reduction of activation of Jurkat cells in response to HDAC inhibitors. d, Schematic representation of treating human primary T cells with HDAC inhibitors ex vivo. e, The upper panels show microscopic pictures of human primary CD4 positive T cells activated by immobilized anti-CD3 and/or CD28 with or without panobinostat treatment (n = 1). The lower panel shows a bar plot showing the average size of aggregates (shown in the upper panel) as a function of the applied HDAC inhibitor dose. Error bars indicate the standard deviation from n = 5 pictures. *P < 0.05, **P < 0.01, ***P < 0.001 compared to DMSO treatment. Significance testing was done with one-way analysis of variance using F-statistics, followed by calculation of Tukey honest significant differences as post hoc test with confidence interval of 95% and correction for multiple comparisons. Scale bars, 400 μm. f, Dose-dependent expression changes of proteins in human primary T cells treated ex vivo with HDAC inhibitors.
Extended Data Fig. 1
Extended Data Fig. 1. Optimization and characterization of the decryptE workflow for the profiling of drug induced expression changes at scale.
a) Boxplot showing the distribution of drug effect at 10,000 nM for all three measures of cell fitness. Each dot represents a drug (n = 144). Horizontal lines, boxes and whiskers of the boxplot depict the median, the range between the second and the third quartile and the 1.5-fold interquartile range. b) Dose-response curves of DHFR following treatment with Methotrexate for different times. c) Same as panel b) but for TYMS. d) Same as panel b) but for PLK1. e) Distribution of the relative number of identified protein groups from Jurkat cells as a function of the applied FAIMS compensation voltage (CV). f) Heatmap comparing the number and overlap of identified protein groups between any combination of two CVs (same data as in panel e). g) Number of identified protein groups from Jurkat cells as a function of the total LC-MS/MS time used per sample. h) Far left panel: schematic representation of the experimental design for testing the robustness of the micro-flow LC-FAIMS-MS/MS method. Colors represent the different sample types and the size of the ring segment is relative to the number of analyses in each segment (total of 250 samples analysed). Middle left panel: bar plot summarizing the number of proteins identified for each sample type. Error bars represent mean ± standard deviation (SD, n = 25 technical replicates for each sample type). Middle right panel: number of identified protein groups plotted as a function of the consecutive order in which the samples were analysed. Far right panel: Cumulative density plot summarizing the precision with which proteins were quantified across replicate experiments. Dotted lines indicate the respective fraction of proteins (50% and 90%) that were quantified with the given coefficient of variation (CoV). i) Left panel: Bar plot showing the number of identified proteins by single shot micro-flow LC MS/MS with or without FAIMS installed or by micro-flow LC-MS/MS after fractionation using high pH reversed phase chromatography (4 or 6 fractions) and using the specified amount of analysis time. Data are average values ± SD from n = 4 technical replicates. Right panel: same as panel h (far right, but for the data shown in the left panel of i).
Extended Data Fig. 2
Extended Data Fig. 2. Reproducibility assessment of the decryptE workflow.
a) Left panel: number of quantified protein groups from DMSO control samples that were analyzed along the entire time frame of the proteomic screen plotted as a function of the consecutive order in which the samples were analyzed. Right panel: Cumulative density plot summarizing the precision with which proteins were quantified across DMSO control samples. Dotted lines indicate the respective fraction of proteins (50% and 90%) that were quantified with the given coefficient of variation (CoV). b) Volcano plot analysis for n = 4694 protein groups from 48 DMSO control samples from the proteomic screen which were randomly assigned to two groups. Analysis of significance was done using a two-sided Welch’s t-test without multiple testing correction. c) Cumulative density plot showing the reproducibility of pEC50 estimations from replicate dose-response analysis (n = 4) of palbociclib, panobinostat, and colchicine. 69.5 % of all pEC50 estimates were reproducible within ½ log10 step of drug concentration. Blue and pink dots indicate the SD for example curves of panel d) and e) respectively. d) Replicate dose-response curves of ATAD2 regulated by palbocicblib along with the SD for the pEC50. e) Same as panel d) but for AURKA regulated by colchicine. f) Upper panel: Violine plots showing the distribution of CoV of all proteins which were not regulated by drug treatment for each of the 144 drugs. Median values are given above each violine for each drug. Lower panel: same as upper panel but for all proteins that showed drug induced expression changes.
Extended Data Fig. 3
Extended Data Fig. 3. Global and specific analyses of quantitative drug-induced protein expression changes.
a) List of all drugs ranked by the median potency (expressed as pEC50 = −log10 EC50) with which they regulated protein expression in Jurkat cells. b) Examples of dose-response curves of proteins from cells treated with the HSP90 inhibitor geldanamycin. c) Pie chart showing the proportion of all drug targets which are detected in the dataset. d) Examples of dose-response curves for drugs that regulated the expression of TYMS. e) Same as panel b) but for the HSP90 inhibitor tanespimycin.
Extended Data Fig. 4
Extended Data Fig. 4. Drug-induced mRNA and protein expression changes.
a) Dose-response curves of mRNA and protein levels of IKZF1. b) Apparent binding affinity constants (pKd = −log10 Kd) of brigatinib-Protein interactions determined by Kinobead competition assays. CLK1,3,4 are marked by respective text. c) Left panel: Dose-dependent change of mRNA levels (determined by RT-qPCR) for different CLK1-4 domains following treatment with brigatinib. Middle panel: same as left panel but for abemaciclib. Right panel: same as left panel but for milciclib. d) Left panel: dose-response curves of CLK1-4 following treatment with abemaciclib. Middle panel: same as b) but for abemaciclib. Right panel: ratios of the N-terminal and kinase domain transcripts (determined by RT-qPCR) of CLK1-4 in response to abemaciclib. The dotted line marks a 1:1 quantitative ratio of the two mRNAs. e) Same as panel d) but for milciclib.
Extended Data Fig. 5
Extended Data Fig. 5. Discrepancies between different omics levels.
a) Comparison of direction of drug-induced expression changes between mRNA and protein levels for seven drugs. b) Dose-response curves of drug-induced abundance changes of CCNB2 on protein (blue) and mRNA (pink) level after carfilzomib treatment. c) Same as panel b) but for several proteins of the folding machinery. d) GO enrichment of genes that are up-regulated on mRNA and down-regulated on protein level after carfilzomib treatment. Testing of significance was done using the clusterProfiler R package (v. 4.2.2.) with the FDR approach for multiple hypothesis testing correction.
Extended Data Fig. 6
Extended Data Fig. 6. Platinum-based chemo-drugs have different mechanisms of action in cells.
a) Results of gene ontology (GO) term enrichment analysis for the top nine significantly enriched GO terms of oxaliplatin for all platinum-containing drugs. Testing of significance was done using the clusterProfiler R package (v. 4.2.2.) with the FDR approach for multiple hypothesis testing correction. b) Dose-response curves for four example proteins for the same three drugs.
Extended Data Fig. 7
Extended Data Fig. 7. HDAC inhibitors diminish TCR expression in T-cells.
a) Three measures of cell viability of Jurkat cells treated with panobinostat. b) Loss of CD3E expression in response to HDAC inhibitors. c) Loss of mRNA expression of several members of the TCR in response to vorinostat. d) Microscopic pictures of HDAC inhibitor-treated and CD3/CD28-activated CD8- and CD4- positive primary human T-cells (n = 1). e) Dose-dependent reduction of TCF7 protein expression in primary human T-cells (naïve only) in response to HDAC inhibitors. f) Dose-dependent reduction of GZMB protein expression in primary human T-cells (activated only).
Extended Data Fig. 8
Extended Data Fig. 8. Molecular glues and PRMT5 inhibitors.
a) Schematic representation of the RING-CUL4A-DDB1-CRBN complex with a bound IMiD molecular glue. b, c) Dose-dependent protein expression for GLUL and ORAI1 in response to several IMiDs. d) same as b) but for members of the RING-CUL4A-DDB1-CRBN complex. e) Same as b) but for IKZF2, PATZ1 and RAB28. f) Far left panel: schematic representation of SNRPB methylation by PRMT5 and its inhibition by pemrametostat and onametostat. Middle left panel: apparent upregulation of SNRPN and SNRPB by several PRMT5 inhibitors. Right two panels: Down-regulation of methylated Arg108 and Arg147 of SNRPB by PRMT5 inhibitors.

References

    1. Singh, S., Malik, B. K. & Sharma, D. K. Molecular drug targets and structure based drug design: a holistic approach. Bioinformation1, 314–320 (2006). - PMC - PubMed
    1. Meissner, F., Geddes-McAlister, J., Mann, M. & Bantscheff, M. The emerging role of mass spectrometry-based proteomics in drug discovery. Nat. Rev. Drug Discov.21, 637–654 (2022). - PubMed
    1. Geoffrey, M. C. Pharmacology, part 1: introduction to pharmacology and pharmacodynamics. J. Nucl. Med. Technol.46, 81 (2018). - PubMed
    1. Swinney, D. C. Biochemical mechanisms of drug action: what does it take for success? Nat. Rev. Drug Discov.3, 801–808 (2004). - PubMed
    1. Tonge, P. J. Drug-target kinetics in drug discovery. ACS Chem. Neurosci.9, 29–39 (2018). - PMC - PubMed

LinkOut - more resources