. 2025 Mar;43(3):323-328.
doi: 10.1038/s41587-024-02232-0. Epub 2024 May 7.

Identification of clinically relevant T cell receptors for personalized T cell therapy using combinatorial algorithms

Affiliations

Identification of clinically relevant T cell receptors for personalized T cell therapy using combinatorial algorithms

Rémy Pétremand et al. Nat Biotechnol. 2025 Mar.

Erratum in

Abstract

A central challenge in developing personalized cancer cell immunotherapy is the identification of tumor-reactive T cell receptors (TCRs). By exploiting the distinct transcriptomic profile of tumor-reactive T cells relative to bystander cells, we build and benchmark TRTpred, an antigen-agnostic in silico predictor of tumor-reactive TCRs. We integrate TRTpred with an avidity predictor to derive a combinatorial algorithm of clinically relevant TCRs for personalized T cell therapy and benchmark it in patient-derived xenografts.


Conflict of interest statement

Competing interests: V.Z. is a consultant for Cellestia Biotech. G.C. has received grants or research support from or is a coinvestigator in clinical trials by Bristol-Myers-Squibb, Celgene, Boehringer Ingelheim, Tigen, Roche, Iovance and Kite. G.C. has received honoraria for consultations or presentations from Roche, Genentech, BMS, AstraZeneca, Sanofi-Aventis, Nextcure and GeneosTx. G.C. has patents in the domain of antibodies and vaccines targeting the tumor vasculature as well as technologies related to T cell expansion and engineering for T cell therapy. G.C. receives royalties from the University of Pennsylvania. S.B., G.C. and A.H. are inventors in technologies related to T cell expansion and engineering for T cell therapy. R.G is inventor on a patent related to TCR sequencing. A.H., R.P., V.Z., M.A.S.P. and G.C. are inventors on patent applications filed under certain subject matters disclosed herein. The remaining authors declare no competing interests.

Figures
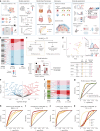
Fig. 1
Fig. 1. TRTpred, a sensitive in silico predictor of tumor-reactive clonotypes.
a, Illustration of TRTpred design, benchmarking and applications. The final algorithm, MixTRTpred, combines TRTpred with a structural avidity predictor and TCRpcDist, a TCR clustering algorithm. b, Alluvial plot showing the fractions of cells and clones annotated as tumor-reactive or non-tumor-reactive (orphan or antigen (Ag)-specific) within the input data (n = 10 patients with melanoma). c, Top, design of the 12 LR and 9 signature scoring models with their hyperparameters (Methods). Bottom, model selection framework estimating the generalization performance of the model through an LOPO NCV. d, Evaluation of the 12 LR (yellow circles) and 9 signature scoring (pink triangles) binary classifiers in the function of MCC and the AUC (Supplementary Table 2). The panel shows the distribution of the best model scores for tumor antigen-specific (red) and viral-specific (blue) clones. e, Volcano plot displaying the differential gene expression analysis comparing tumor-reactive and non-tumor-reactive cells. The 90 upregulated (red) and downregulated (blue) genes obtained by edgeR-QFL are shown (Supplementary Table 4). The P values are calculated using the two-sided quasi-likelihood F-test in the edgeR package and are corrected for multiple testing using the Benjamini–Hochberg procedure. f, Alluvial plots showing the fractions of cells and clones annotated as tumor-reactive or non-tumor-reactive (orphan or Ag-specific) within internal (top) and external (bottom, ref. ) benchmarking data. g, ROC curve of TRTpred applied on the input data (black), and the internal (orange) and external (green, ref. ) benchmarking data. hk, ROC curves of TRTpred and four CD8+ TIL tumor-reactive predictive signatures (refs. ,,,) applied to the four datasets: ref. (melanoma, n = 4) (h), ref. (lung, n = 4) (i), ref. (n = 1 melanoma, n = 2 breast and n = 12 GI) (j) and ref. (GI, n = 5) (k). All AUCs are reported in Extended Data Fig. 3e. Pt, patient; TAA, tumor-associated antigen; UMI, unique molecular identifier; PCA, principal component analysis; Mel, melanoma; Pan, pan-cancer. Source data
Fig. 2
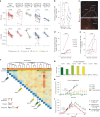
Fig. 2. TRTpred applications for discovery of immune repertoires and validation of MixTRTpred.
a, Richness (top) and clonality (bottom) of inferred tumor-reactive (+/−) clones using TRTpred in n = 5 cohorts: internal data (melanoma n = 14); ref. (melanoma, n = 4); ref. (GI, n = 5); ref. (n = 1 melanoma, n = 2 breast and n = 12 GI); ref. (lung, n = 4). Patients are color-coded according to the cancer type. Metrics are displayed in logarithmic scale and statistics were performed using a one-tailed t-test. b, Proportion of inferred TRT CD8+ T cells in melanoma (n = 19) and other solid tumors (n = 23, as described in a). Statistics were performed using a one-tailed Wilcoxon test. c, Sequential multiplexed immunohistochemistry of patient 1 with hematoxylin (red) and CD8 (yellow) staining. Upper panel, whole-tissue section; lower panel (white rectangle), magnified image. Scale bars, 500 μm and 50 μm, for the whole-tissue section and magnified images, respectively. This is a representative experiment among n = 5 independent patients with melanoma. d,e, Cumulative frequency of inferred high-avidity (d) or tumor-reactive (e) CD8+ clones identified in microdissected areas of stroma and tumor in n = 5 independent patients with melanoma (patients 1–5). Statistics were performed using a pairwise one-tailed Wilcoxon test. f, TRTpred results depicting the distance matrix of the top 20 ranked tumor-reactive among high structural avidity clones. The five clones selected are the ones with the highest tumor-reactive score in each cluster (TCRs 1–5; Supplementary Table 6), defined by hierarchical clustering. g, In vitro validation of the tumor reactivity of the five TCRs (TCRs 1–5) predicted through MixTRTpred through CD137 upregulation assay (mean of n = 2 biologically independent replicates). The color code corresponds to that of panel f. h,i, IL-2 NOG mice were subcutaneously engrafted with tumor cells from patient 14 followed by adoptive transfer of TCR-transduced primary CD8+ T cells. h, Tumor-bearing mice received 5 × 106 CD8+ T cells transduced (day 11) with TCR1, TCR3 or TCR5 (Supplementary Table 6). i, Mice were adoptively transferred with infusion products containing 1 × 106 total CD8+ T cells transduced (day 11) with TCR1 or TCR3 or TCR5 (single TCRs) or with a pool of 1 × 106 total CD8+ T cells transduced with the three TCRs (TCR cocktail, 0.33 × 106 CD8+ T cells transduced with each TCR). In h and i, 5 × 106 CD8+ untransduced T cells were transferred as control. Data show mean ± s.e.m. of n = 3–5 biologically independent replicates. In box plots, the boxes represent the median and the interquartile range (IQR), while the whiskers extend to 1.5 times the IQR. ID, identification; Irr Ctrl, irrelevant control; Mel, melanoma; Pan, pan-cancer; GI, gastrointesinal. Source data
Extended Data Fig. 1
Extended Data Fig. 1. Description of internal and external benchmarking cohorts.
a) Alluvial plot showing the fractions of cells and clones annotated as tumor-reactive or non-tumor-reactive (orphan or antigen (Ag)-specific) within the input data (n = 10 melanoma patients). b-c) Alluvial plots showing the fractions of cells and clones annotated as tumor-reactive or non-tumor-reactive (orphan or antigen (Ag)-specific) within the internal (b, n = 4) and external (c, n = 4, Oliveira et al.) data. Source data
Extended Data Fig. 2
Extended Data Fig. 2. Model design and training architecture.
a) Illustration of Logistic Regression (LR) and signature scoring models, hyperparameters and outputs (see Methods). The tables describe the 21 models. b) Illustration of the nested-cross-validation framework to train and evaluate the models. Here we adapt a leave-one-patient-out approach to better simulate the model performance on new data from a new patient (see Methods). In box plots, the boxes represent the median and the interquartile range (IQR), while the whiskers extend to 1.5 times the IQR.
Extended Data Fig. 3
Extended Data Fig. 3. TRTpred’s validation and results.
a) Y-random permutation tests (black points, n = 100) results in terms of Matthew′s Correlation Coefficient (MCC), AUC and accuracy. The red square corresponds to the best model results demonstrating its validity. b) Heatmap comparing relevant up and down regulated genes from TRTpred’s signature with 5 published CD8+ TILs tumor-reactive signatures (Oliveira et al., Hanada et al., Lowery et al., Zheng et al. and van-der-Leune et al.). c) Venn diagrams comparing the up (top) and down (bottom) regulated genes from TRTpred signature (red) with the 5 CD8+ TILs tumor-reactive signatures from panel B (grey). Underneath the Venn diagrams are the Jaccard indexes and the list of common genes. d) Heatmap of the Jaccard similarity index matrix comparing the 6 CD8+ TILs tumor-reactive signatures from panels B and C. The upper and lower triangle of this matrix correspond to the up and down regulated genes, respectively. Grey boxes correspond to missing gene-sets. e) Heatmap of AUC performances of 6 CD8+ TILs tumor-reactive predictive signatures (X-axis) applied on 6 datasets (Y-axis) comprising the input data (melanoma, n = 10), the internal benchmarking data (melanoma, n = 4) and data from 4 cohorts: Oliveira et al. (melanoma, n = 4), Hanada et al. (lung, n = 4), Lowery et al. (n = 1 melanoma, n = 2 breast and n = 12 GI) and Zheng et al. (GI, n = 5). The performance of each model on its original data is highlighted. Source data
Extended Data Fig. 4
Extended Data Fig. 4. Microdissected stromal and tumor core areas.
a) Representative example of the frequency of annotated CD8+ T-cell clones specific for TAAs, neoantigens or viral peptides in the microdissected stromal and tumor core areas of patient 2. Frequencies are displayed in logarithmic scale. b) Cumulative frequencies of annotated CD8+ T-cell clones specific for TAAs, neoantigens or viral peptides in the microdissected stromal and tumor core areas of five melanoma patients (1–5, Supplementary Table 3). Frequencies are displayed in logarithmic scale and statistics were performed using a one-tailed Chi-square test. Source data
Extended Data Fig. 5
Extended Data Fig. 5. MixTRTpred clinical validation.
a) TRTpred score distribution for predicted high and low avidity clones. Red points correspond to predicted tumor-reactive clones that are predicted as having high avidity. In box plots, the boxes represent the median and the interquartile range (IQR), while the whiskers extend to 1.5 times the IQR. b) In vitro validation of the selected three TCRs (TCR1, 3 and 5, Supplementary Table 6) for the in vivo experiment. T-cell responses of TCR-transfected cells against the autologous tumor cell line was assessed by IFNγ ELISpot assay (mean on n = 3 biologically independent replicates). c) Design of the in vivo experiment illustrating the different arms composed of products with individual or mixed TCR-transduced populations (TCR 1, 3 and 5, Supplementary Table 6). d) Dose response of Jurkat cells transfected with TCR 1, 3 or 5 and stimulated in different ratios with autologous tumor cells. Data show mean±SD on n = 2 biologically independent replicates. e) Total number and intratumoral frequency of clinically relevant clones (predicted to be tumor-reactive and of high avidity) in 37 patients from 4 datasets grouped by tumor-indications: Internal (melanoma, n = 14); Oliveira et al. (melanoma, n = 4); Hanada et al. (lung, n = 4); and Lowery et al. (n = 1 melanoma, n = 2 breast and n = 12 GI). A threshold of 5 distinct clinically relevant TCRs is shown. Colors correspond to the different tumor indications. Source data

References

    1. Rosenberg, S. A. & Restifo, N. P. Adoptive cell transfer as personalized immunotherapy for human cancer. Science348, 62–68 (2015). - PMC - PubMed
    1. Rohaan, M. W. et al. Tumor-infiltrating lymphocyte therapy or ipilimumab in advanced melanoma. N. Engl. J. Med.387, 2113–2125 (2022). - PubMed
    1. Chiffelle, J. et al. Tumor-reactive clonotype dynamics underlying clinical response to TIL therapy in melanoma. Preprint at bioRxiv10.1101/2023.07.21.544585 (2023).
    1. Kristensen, N. P. et al. Neoantigen-reactive CD8+ T cells affect clinical outcome of adoptive cell therapy with tumor-infiltrating lymphocytes in melanoma. J. Clin. Invest.132, 132 (2022). - PMC - PubMed
    1. Kverneland, A. H. et al. Adoptive cell therapy with tumor-infiltrating lymphocytes supported by checkpoint inhibition across multiple solid cancer types. J. Immunother. Cancer9, e003499 (2021). - PMC - PubMed

Substances

LinkOut - more resources