Randomized Controlled Trial
. 2024 Jul;30(7):1888-1897.
doi: 10.1038/s41591-024-02951-6. Epub 2024 May 8.

Effects of a personalized nutrition program on cardiometabolic health: a randomized controlled trial

Affiliations
Randomized Controlled Trial

Effects of a personalized nutrition program on cardiometabolic health: a randomized controlled trial

Kate M Bermingham et al. Nat Med. 2024 Jul.

Abstract

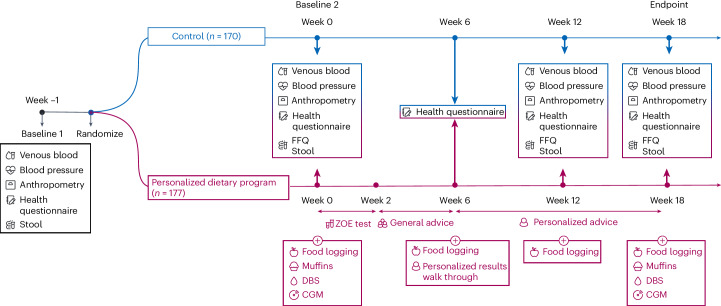
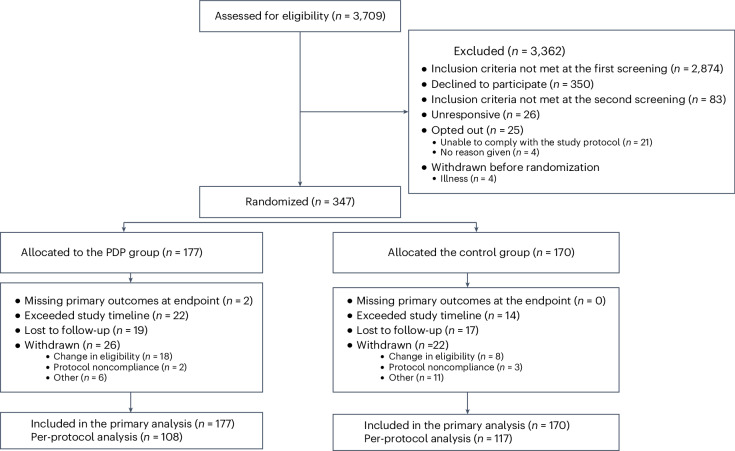
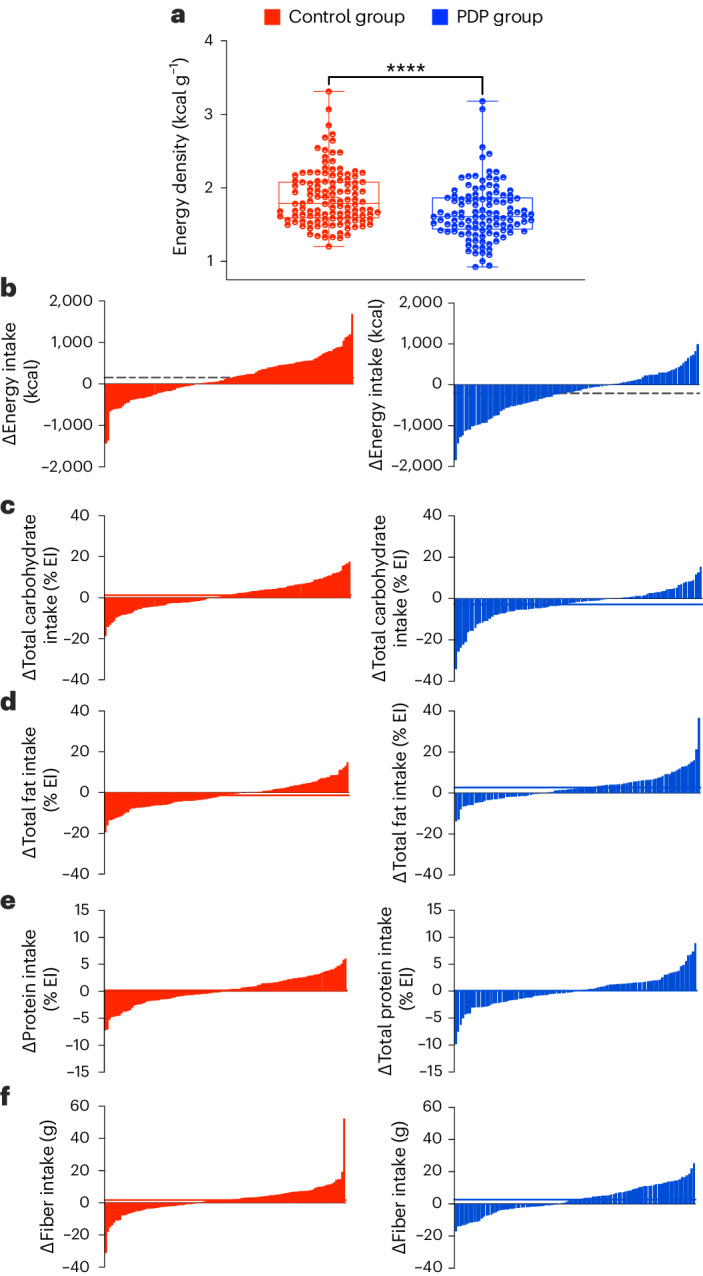
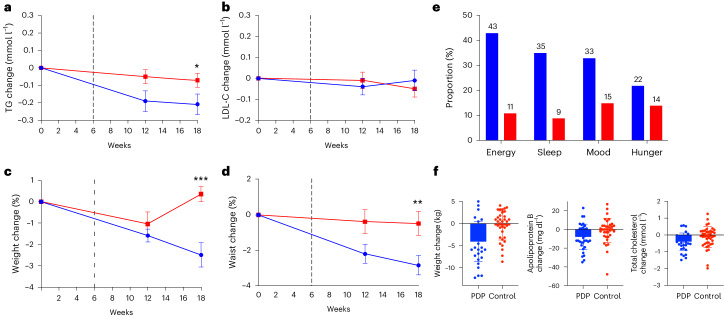
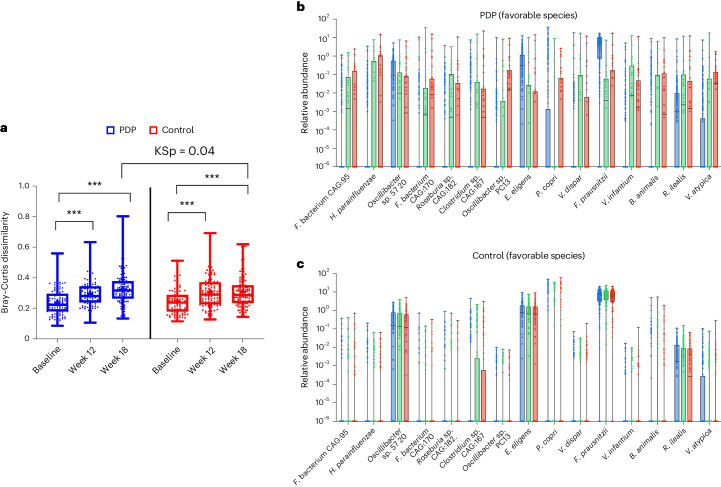
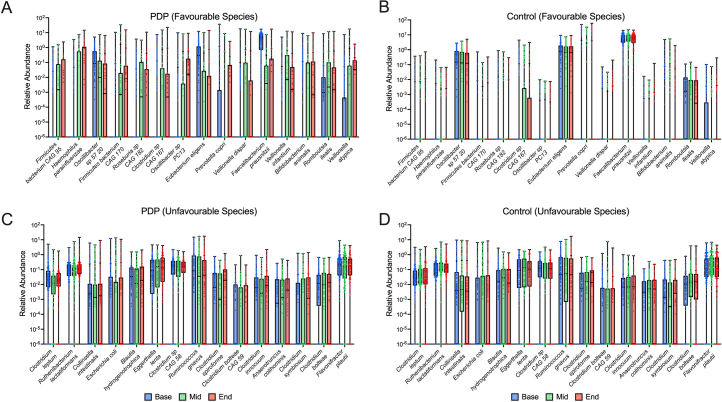
Large variability exists in people's responses to foods. However, the efficacy of personalized dietary advice for health remains understudied. We compared a personalized dietary program (PDP) versus general advice (control) on cardiometabolic health using a randomized clinical trial. The PDP used food characteristics, individual postprandial glucose and triglyceride (TG) responses to foods, microbiomes and health history, to produce personalized food scores in an 18-week app-based program. The control group received standard care dietary advice (US Department of Agriculture Guidelines for Americans, 2020-2025) using online resources, check-ins, video lessons and a leaflet. Primary outcomes were serum low-density lipoprotein cholesterol and TG concentrations at baseline and at 18 weeks. Participants (n = 347), aged 41-70 years and generally representative of the average US population, were randomized to the PDP (n = 177) or control (n = 170). Intention-to-treat analysis (n = 347) between groups showed significant reduction in TGs (mean difference = -0.13 mmol l-1; log-transformed 95% confidence interval = -0.07 to -0.01, P = 0.016). Changes in low-density lipoprotein cholesterol were not significant. There were improvements in secondary outcomes, including body weight, waist circumference, HbA1c, diet quality and microbiome (beta-diversity) (P < 0.05), particularly in highly adherent PDP participants. However, blood pressure, insulin, glucose, C-peptide, apolipoprotein A1 and B, and postprandial TGs did not differ between groups. No serious intervention-related adverse events were reported. Following a personalized diet led to some improvements in cardiometabolic health compared to standard dietary advice. ClinicalTrials.gov registration: NCT05273268 .


Conflict of interest statement

T.D.S., J.W. and G.H. are co-founders of ZOE Ltd. F.A., L.M.D., A.M.V., W.L.H., N.S., T.D.S. and S.E.B. are consultants to ZOE Ltd. K.M.B., I.L., L.P., A.A., J.W., F.B., H.B., J.C., W.J.B., R.D. and G.H. are or have been employees of ZOE Ltd. K.M.B., I.L., L.P., A.A., J.W., F.B., H.B., J.C., W.J.B., R.D., G.H., L.M.D., A.M.V., N.S., T.D.S. and S.E.B. have received options in ZOE Ltd. A.M.V., C.D.G., L.M.D., J.M.O. and N.S. are members of the Scientific Advisory Board of ZOE Ltd.

Figures

Fig. 1
Fig. 1. METHOD study design.
n = 177 participants were allocated to the PDP intervention group and n = 170 participants were allocated to the control group. DBS, dried blood spot finger-prick test. CGM, continuous glucose monitor. A Food Frequency Questionnaire (FFQ), accompanied by a dietary behavior survey, was administered. Anthropometry measures included waist circumference, hip circumference, height and body weight.
Fig. 2
Fig. 2. CONSORT diagram.
CONSORT, Consolidated Standards of Reporting Trials.
Fig. 3
Fig. 3. Dietary intake.
a, Mean energy density (kcal g−1) of the diet at the study endpoint for the control group (red) (n = 120 participants with dietary data available) and PDP group (blue) (n = 111 participants with dietary data available). An unpaired, two-sided, between-group t-test was used (P < 0.001). Data presented include the first quartile, median and third quartile. bf, Individual change in energy and nutrient intake before and after the intervention for energy intake (kcal) (b), carbohydrate (% EI) (c), fat (% EI) (d), protein (% EI) (e) and fiber (g) (f) intake across the control (red) and PDP (blue) groups.
Fig. 4
Fig. 4. Changes in primary and selected secondary outcomes during the intervention period.
ad, Mean ± s.e.m. changes from baseline values in TG (mmol l−1) (P = 0.016) (a), LDL-C (mmol l−1) (b), weight (%) (P < 0.001) (c) and waist circumference (%) (P = 0.008) (d), in participants allocated to the PDP (blue line) (n = 177) or control (red line) (n = 172) group. Repeated measures model between groups. e, Proportion (%) of participants in the PDP and control groups with subjective improvements in energy level, sleep quality, mood, and hunger levels. f, Changes in weight (kg), apolipoprotein B (mg dl−1) and total cholesterol (mmol l−1) for highly adherent PDP (n = 35) and controls (n = 39) (mean and s.e.m. shown). *P < 0.05, **P < 0.01, ***P < 0.001.
Fig. 5
Fig. 5. Impact of dietary intervention on the gut microbiome.
a, Bray–Curtis dissimilarity at baseline, week 12 and week 18, for the control (red) (n = 118) and PDP (blue) (n = 112) groups. Data presented include the first quartile, median and third quartile. KSp between treatment groups (P = 0.04). ***P < 0.001 determined using a paired, one-sided Wilcoxon rank-sum test for within-individual change in Bray–Curtis dissimilarity. b,c, Relative abundance of favorable microbial species at baseline (blue), week 12 (green) and week 18 (red) for PDP (n = 112) (b) and control (n = 118) (c) groups (minimum to maximum shown).
Extended Data Fig. 1
Extended Data Fig. 1. Relative abundance of microbial species.
Relative abundance of the 15 favourable and unfavourable microbial species at baseline (blue), week-12 (green) and week-18 (red) for A) PDP (favourable species), B) Control (favourable species), C) PDP (unfavourable species), D) Control (unfavourable species). PDP, n = 112 and Control, n = 118 (Min to Max presented).

References

    1. Micha, R. et al. Etiologic effects and optimal intakes of foods and nutrients for risk of cardiovascular diseases and diabetes: systematic reviews and meta-analyses from the Nutrition and Chronic Diseases Expert Group (NutriCoDE). PLoS ONE12, e0175149 (2017). 10.1371/journal.pone.0175149 - DOI - PMC - PubMed
    1. Murray, C. J. L. et al. Global burden of 87 risk factors in 204 countries and territories, 1990–2019: a systematic analysis for the Global Burden of Disease Study 2019. Lancet396, 1223–1249 (2020). 10.1016/S0140-6736(20)30752-2 - DOI - PMC - PubMed
    1. Berry, S. E. et al. Human postprandial responses to food and potential for precision nutrition. Nat. Med.26, 964–973 (2020). 10.1038/s41591-020-0934-0 - DOI - PMC - PubMed
    1. Gardner, C. D. et al. Effect of low-fat vs low-carbohydrate diet on 12-month weight loss in overweight adults and the association with genotype pattern or insulin secretion: the DIETFITS randomized clinical trial. JAMA319, 667–679 (2018). 10.1001/jama.2018.0245 - DOI - PMC - PubMed
    1. What We Eat in America, National Health and Nutrition Examination Survey(2017–2018) (National Center for Health Statistics, 2021); https://www.ars.usda.gov/ARSUserFiles/80400530/pdf/1718/Key%20Points%20U...

Publication types

Associated data

LinkOut - more resources