

A method for mining condition-specific co-expressed genes in Camellia sinensis based on k-means clustering
- PMID: 38714965
- PMCID: PMC11077725
- DOI: 10.1186/s12870-024-05086-5
A method for mining condition-specific co-expressed genes in Camellia sinensis based on k-means clustering
Abstract
Background: As one of the world's most important beverage crops, tea plants (Camellia sinensis) are renowned for their unique flavors and numerous beneficial secondary metabolites, attracting researchers to investigate the formation of tea quality. With the increasing availability of transcriptome data on tea plants in public databases, conducting large-scale co-expression analyses has become feasible to meet the demand for functional characterization of tea plant genes. However, as the multidimensional noise increases, larger-scale co-expression analyses are not always effective. Analyzing a subset of samples generated by effectively downsampling and reorganizing the global sample set often leads to more accurate results in co-expression analysis. Meanwhile, global-based co-expression analyses are more likely to overlook condition-specific gene interactions, which may be more important and worthy of exploration and research.
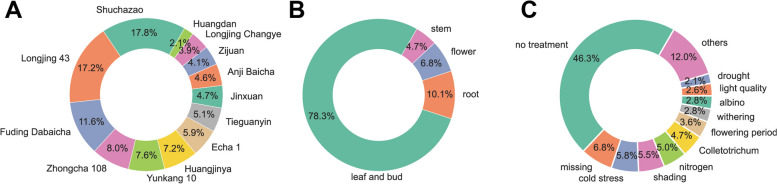
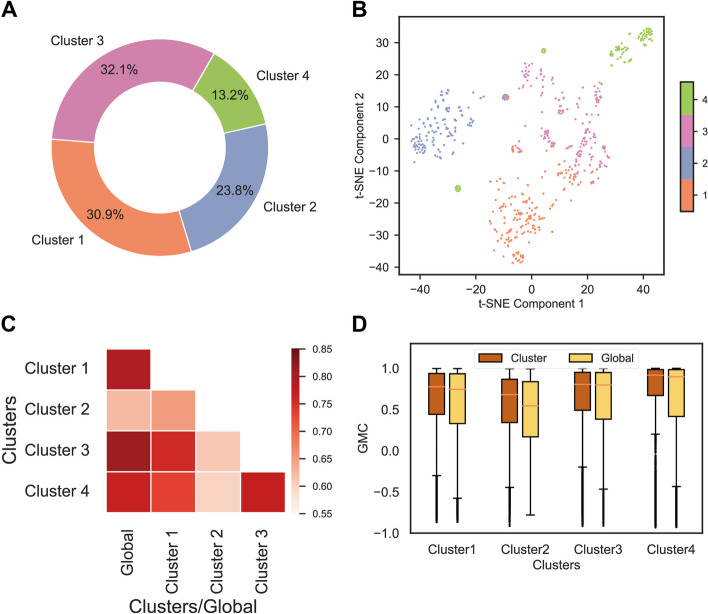
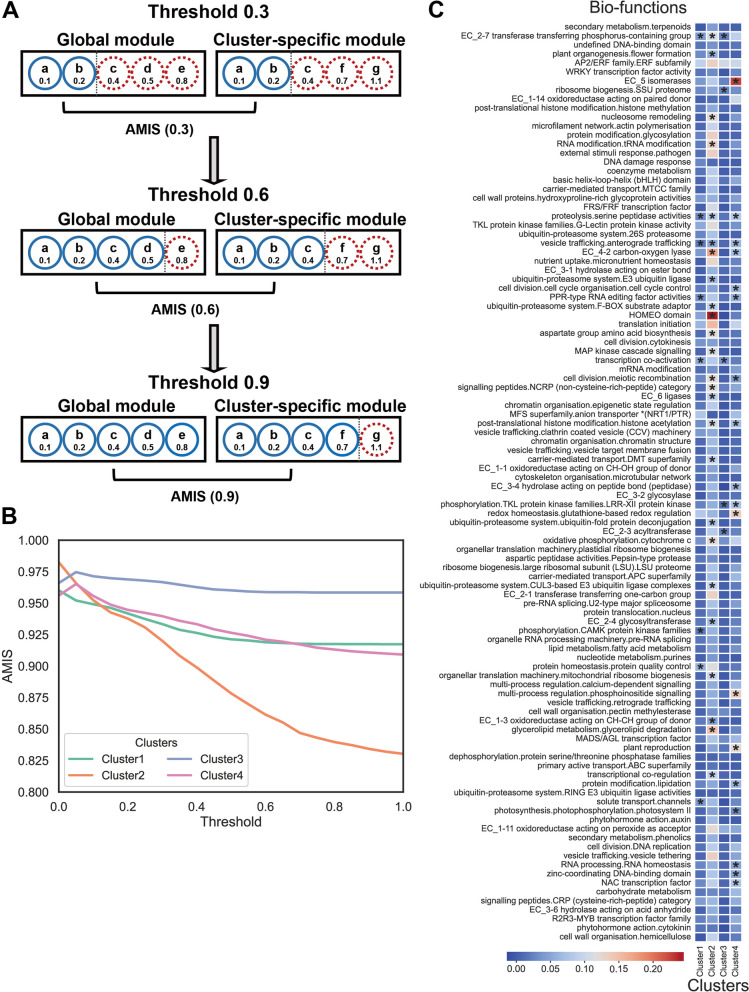
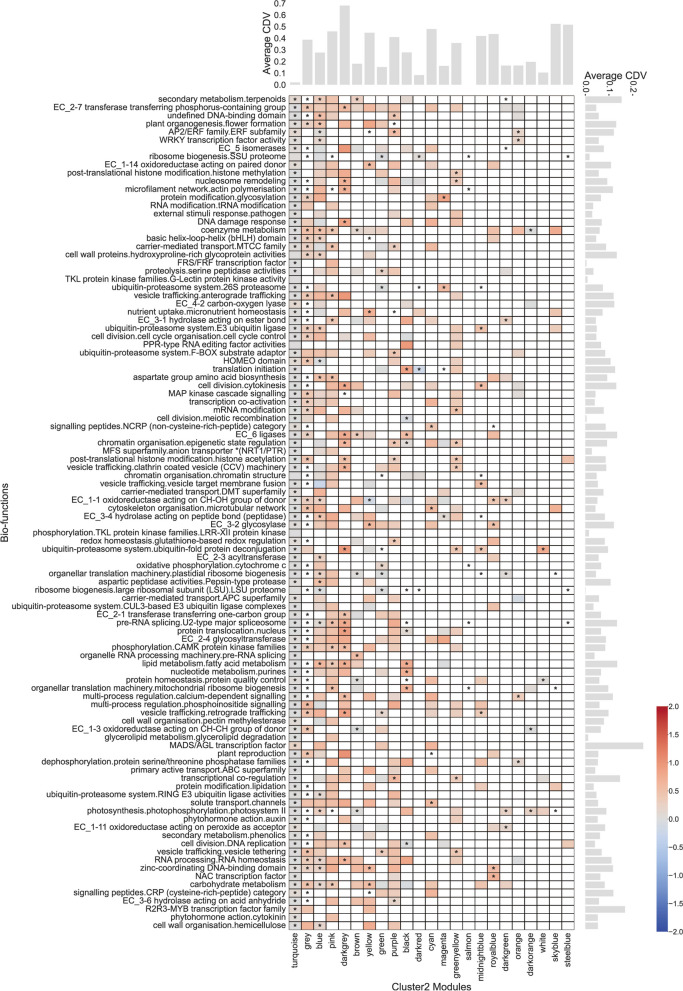
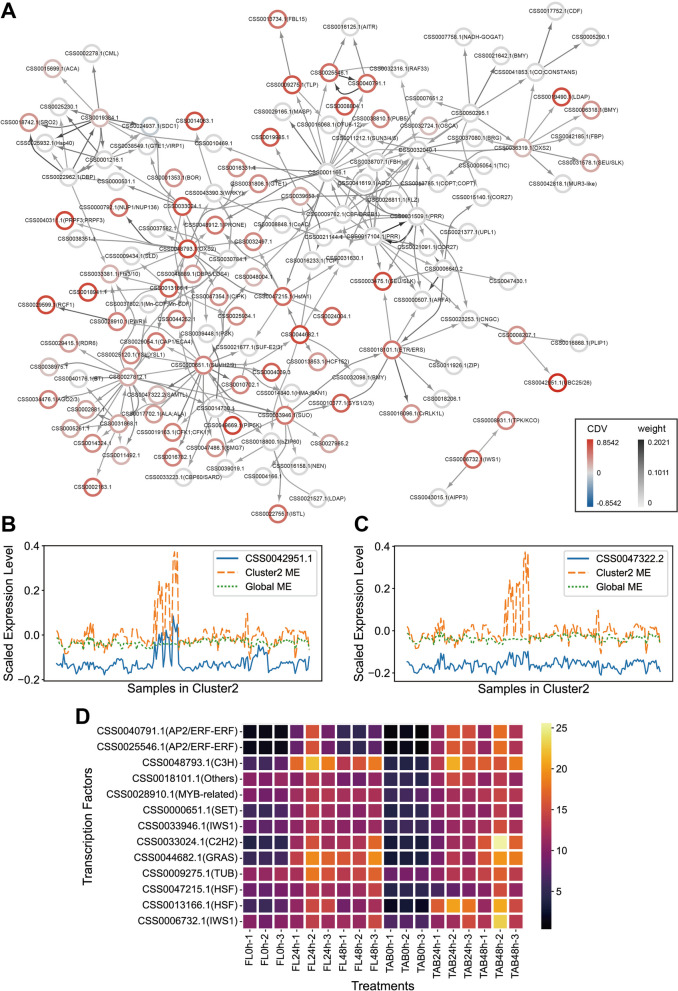
Results: Here, we employed the k-means clustering method to organize and classify the global samples of tea plants, resulting in clustered samples. Metadata annotations were then performed on these clustered samples to determine the "conditions" represented by each cluster. Subsequently, we conducted gene co-expression network analysis (WGCNA) separately on the global samples and the clustered samples, resulting in global modules and cluster-specific modules. Comparative analyses of global modules and cluster-specific modules have demonstrated that cluster-specific modules exhibit higher accuracy in co-expression analysis. To measure the degree of condition specificity of genes within condition-specific clusters, we introduced the correlation difference value (CDV). By incorporating the CDV into co-expression analyses, we can assess the condition specificity of genes. This approach proved instrumental in identifying a series of high CDV transcription factor encoding genes upregulated during sustained cold treatment in Camellia sinensis leaves and buds, and pinpointing a pair of genes that participate in the antioxidant defense system of tea plants under sustained cold stress.
Conclusions: To summarize, downsampling and reorganizing the sample set improved the accuracy of co-expression analysis. Cluster-specific modules were more accurate in capturing condition-specific gene interactions. The introduction of CDV allowed for the assessment of condition specificity in gene co-expression analyses. Using this approach, we identified a series of high CDV transcription factor encoding genes related to sustained cold stress in Camellia sinensis. This study highlights the importance of considering condition specificity in co-expression analysis and provides insights into the regulation of the cold stress in Camellia sinensis.
Keywords: Condition-specific gene interactions; Correlation difference value; Gene co-expression network analysis; K-means clustering; Sustained cold stress.
© 2024. The Author(s).
Conflict of interest statement
The authors declare no competing interests.
Figures
References
-
- Wang C, Han J, Pu Y, et al. Tea (Camellia sinensis): a review of nutritional composition, potential applications, and Omics Research. Appl Sci. 2022;12(12):5874. doi: 10.3390/app12125874. - DOI
-
- Chen L, Zhou ZX, Yang YJ. Genetic improvement and breeding of tea plant (Camellia sinensis) in China: from individual selection to hybridization and molecular breeding. Euphytica. 2007;154:239–248. doi: 10.1007/s10681-006-9292-3. - DOI
-
- Chen L, Apostolides Z, Chen ZM, et al. Tea germplasm and breeding in China. In: Chen, Z.M., (Ed.), Global Tea Breeding. Berlin: Springer; 2012. p. 13–58.
-
- Zhao S, Cheng H, Xu P, et al. Regulation of biosynthesis of the main flavor-contributing metabolites in tea plant (Camellia sinensis): a review. Crit Rev Food Sci Nutr. 2023; 63(30):10520–35. - PubMed
MeSH terms
Grants and funding
LinkOut - more resources
Full Text Sources
Research Materials
