. 2024 May 7;25(1):116.
doi: 10.1186/s13059-024-03253-3.

Mapping and functional characterization of structural variation in 1060 pig genomes

Affiliations

Mapping and functional characterization of structural variation in 1060 pig genomes

Liu Yang et al. Genome Biol. .

Abstract

Background: Structural variations (SVs) have significant impacts on complex phenotypes by rearranging large amounts of DNA sequence.

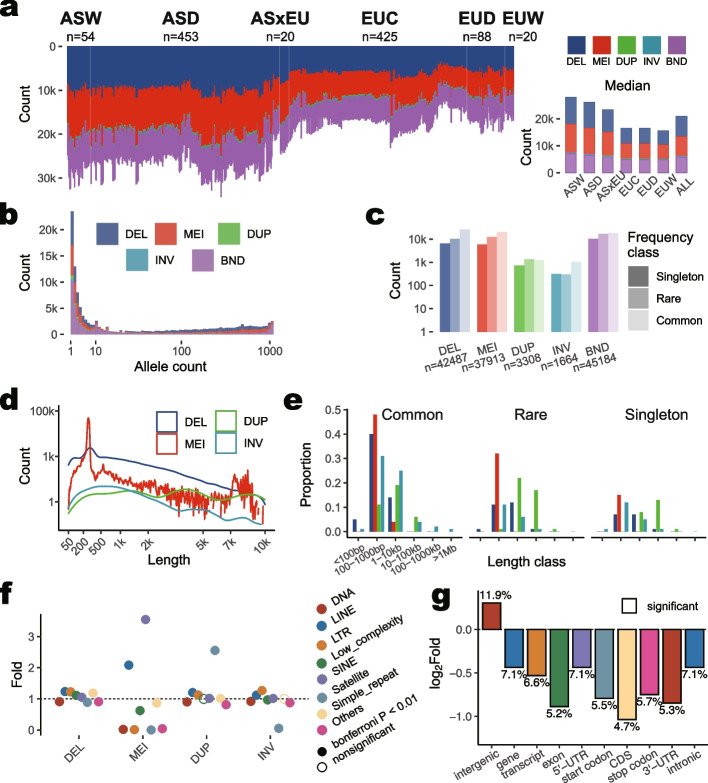
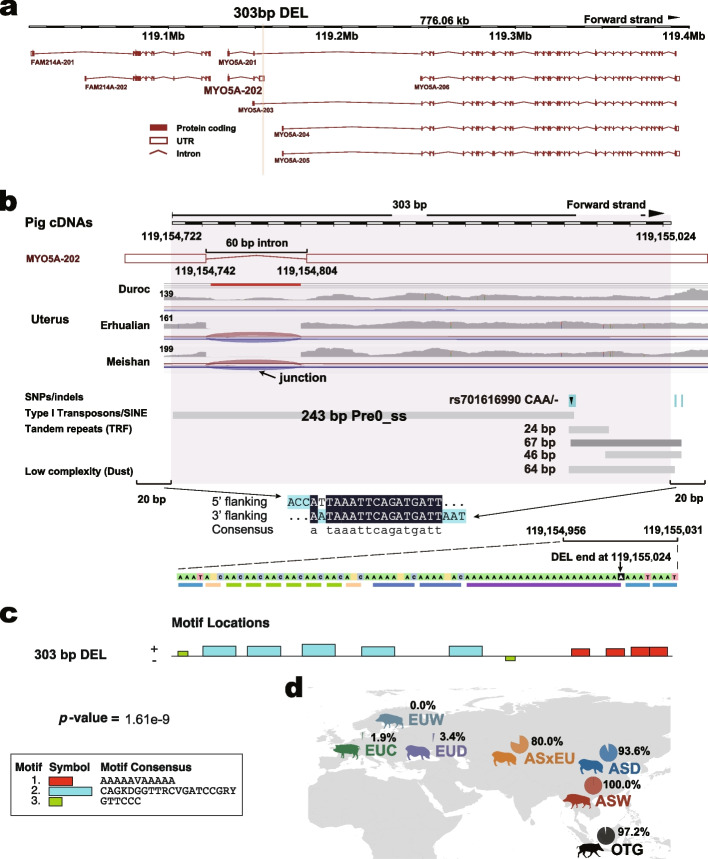
Results: We present a comprehensive SV catalog based on the whole-genome sequence of 1060 pigs (Sus scrofa) representing 101 breeds, covering 9.6% of the pig genome. This catalog includes 42,487 deletions, 37,913 mobile element insertions, 3308 duplications, 1664 inversions, and 45,184 break ends. Estimates of breed ancestry and hybridization using genotyped SVs align well with those from single nucleotide polymorphisms. Geographically stratified deletions are observed, along with known duplications of the KIT gene, responsible for white coat color in European pigs. Additionally, we identify a recent SINE element insertion in MYO5A transcripts of European pigs, potentially influencing alternative splicing patterns and coat color alterations. Furthermore, a Yorkshire-specific copy number gain within ABCG2 is found, impacting chromatin interactions and gene expression across multiple tissues over a stretch of genomic region of ~200 kb. Preliminary investigations into SV's impact on gene expression and traits using the Pig Genotype-Tissue Expression (PigGTEx) data reveal SV associations with regulatory variants and gene-trait pairs. For instance, a 51-bp deletion is linked to the lead eQTL of the lipid metabolism regulating gene FADS3, whose expression in embryo may affect loin muscle area, as revealed by our transcriptome-wide association studies.

Conclusions: This SV catalog serves as a valuable resource for studying diversity, evolutionary history, and functional shaping of the pig genome by processes like domestication, trait-based breeding, and adaptive evolution.

Keywords: Functional genome; Gene expression; Pig; Population diversity; Structure variation.


Conflict of interest statement

All authors declare that they have no competing interests.

Figures

Fig. 1
Fig. 1
SV distributions across individuals, populations, and genomes of 1060 pigs. a Number of SV across 1060 pigs. The k in the y-axis denotes one thousand. Counts for five SV types in individuals are shown on the left. The lower right panel refers to the median SV count for individuals in each population. Five SV types are deletion (DEL), mobile-element insertion (MEI), duplication (DUP), inversion (INV), and breakend (BND). b SV frequency distribution. The x-axis (allele count) is transformed by log 10. c SV counts in each frequency class for each SV type. Singleton, rare, and common respectively denote SV only found in one individual, found in more than one individual but not exceeding 1% of individuals, and found in more than 1% of individuals. The y-axis is transformed by log 10. d Size distributions of SVs. The x-axis is transformed by square root and y-axis by log 10. e Proportion distributions of length for each SV frequency class. It included ≤ 100 bp, 100–1000 bp, 1–10 kb, 10–100 kb, 100–1000 kb, and ≥ 1 Mb. The color legend is shown in d. f Enrichments of repeats in SV against the whole genome. Folds were calculated by the proportion of repeat length in SV divided by the proportion of total repeat length in the genome. Significance was determined by the Chi-squared Test and adjusted by the Bonferroni methods with threshold adjust P ≤ 0.01. Filled circle: significant; open circle: nonsignificant. g Enrichments of protein-coding genes in SV to the genome. The numbers above or underneath bars denote the value of fold changes. All bars boxed in solid black are significant
Fig. 2
Fig. 2
SV-related gene, regulator, and e/sQTL. a Categories of gene-overlapping SVs. The top shows gene structure, including transcribe start site (array), 5-UTR (light grey), start codon (red), coding sequence (blue), stop codon (yellow), 3-UTR (dark grey), intron and intergenic region (thin black line). A total of 15 categories were defined, including whole gene DEL (WlGnDel), DUP (WlGnDup), and INV (WlGnInv), predicted loss-of-function (pLoF) when DEL or MEI occurred in CDS, copy gain (CpGn) when DUP occurred in CDS, coding INV (codInv), coding BND (codBnd), 5 Regulation (5Rglt), and 3 Regulation (3Rglt). CDS-mapped SVs were defined as weak (Wk) impact if mapped CDS counts less than 20% of its own length. In contrast, it had a strong (St) impact. Similarly, UTR-mapped SVs were defined as weak (Wk) impacts if mapped UTR lengths were less than 20% of their own lengths. In the bottom part of this panel, we defined the relationships between SVs and genomics features like eQTL, sQTL, promoter, and enhancer as overlapped if they were localized in SVs or flanking if they were localized in 5-kb flanking regions of an SV on both sides. d Table of count statistics for SV-related gene, enhancer, promoter, and e/sQTL. Ov denotes overlapped, GF denotes gene flanking, which is 5 kb of each side, and SV F denotes SV flanking. c SV and gene counts of each SV category. The upper y-axis is transformed by log 10 when more than 3000. d Count per genome and singleton proportion for each SV category. Bars represent sample mean, lower and upper Gaussian 95% confidence limits in each individual, based on the t-distribution. The significant difference test for singleton proportion was carried out by the Student’s t-test for each category against intergenic. The dotted line shows the mean singleton proportion of intergenic. The Bonferroni-corrected P values ≤ 0.01 were considered significant and represented by the bar color fillings of light grey. e Count per genome and singleton proportion of each chromatin state. The proportion was calculated by the overlapped length of the chromatin state and SV divided by the length of the chromatin state for each tissue, respectively. The significant difference test for proportion and singleton proportion was by the Student’s t-test for each chromatin state against Qui. The dotted line shows the mean of Qui and significant value. The Bonferroni-corrected P values ≤ 0.01 were considered significant and shown as filled circles. A total of 15 chromatin states include strongly active promoters/transcripts (TssA), Flanking active TSS without ATAC (TssAHet), transcribed at gene (TxFlnk), weak transcribed at gene (TxFlnkWk), transcribed region without ATAC (TxFlnkHet), strong enhancer (EnhA), medium enhancer with ATAC (EnhAMe), weak active enhancer (EnhAWk), active enhancer no ATAC (EnhAHet), poised enhancer (EnhPois), ATAC island (ATAC_Is), bivalent/poised TSS (TssBiv), repressed polycomb (Repr), weak repressed polycomb (ReprWk), and quiescent (Qui). f Ratios of enhancers or promoters in SVs. The x-axis denotes the genomic locations of enhancers or promoters. Ratios (the y-axis) were calculated by the counts of SV-related enhancers or promoters divided by counts of enhancers or promoters in the genome for each genomic location, respectively. Bars represent the sample mean and lower and upper Gaussian 95% confidence limits of 34 tissues, based on the t-distribution. The significant difference test for ratios was carried out by the Student’s t-test for each genomic location to all enhancers and promoters. The dotted lines show mean proportions of enhancer or promoter, respectively
Fig. 3
Fig. 3
Population structure by SV genotypes in autosomes for 1096 individuals. a Pig sample origins around the world. The colors and shapes denote main populations and sub-populations, as shown in panel b. b Maximum likelihood tree for 111 sub-populations was inferred by TreeMix based on allele frequency for each autosomal SV genotype and plotted by R package ggtree. c Admixture analysis of pigs from 7 main populations by fastStructure. K denotes the assumed number of ancestors. b Principal component analysis (PCA) for 1060 pigs and 36 outgroup individuals. Explained variation percentages in parentheses for PC1 and PC2 were calculated by PLINK. e PCA for 1060 pigs. Explained variation percentages in parentheses for PC1 and PC2 were calculated by PLINK
Fig. 4
Fig. 4
Pairwise comparisons of SV-related gene expressions between AS and EU ancestral pigs. a Manhattan plot of FST value between AS and EU ancestral pigs based on autosomal SVs. FST values were calculated by PLINK. The dotted line at 0.754 shows the threshold for the top 1% FST values of 130,556 SVs. b Fold changes of SV-related DEGs between AS and EU ancestral pigs. The significant difference test was based on the exactTest in R package edgeR. Common (AF ≥ 0.01) DEL (including ref-MEI) and DUP-related DEGs in at least two tissues were labeled out with their gene symbols. c SV-related DEG associated with pig complex traits integrating by TWAS data. The x-axis denotes each SV-related DEG analyzed in TWAS. The y-axis denotes the false discovery rate (FDR) of each TWAS gene, and the threshold of FDR ≤ 0.05 is shown by the dotted line
Fig. 5
Fig. 5
The 303 bp DEL in a 3-UTR of gene MYO5A. a Genome locations of the 303 bp DEL. Plots were based on the Sus scrofa genome annotation of the ENSEMBL database. The yellow box denotes the 303 bp DEL occurred location. b Illustration of the genomic region for the 303 bp DEL. Screenshot of integrative genomics viewer for the 303 bp DEL. The top black and white bar shows the location of the 303 bp DEL for RNA or cDNA in the uterus of Duroc, Erhualian, and Meishan pigs. The red and blue lines show forward and reverse strand junction reads, respectively. The upper junction reads for each sample were read peaks. The DEL was located at the 3-UTR of transcript MYO5A-202, across an intron and two exons, which consist of a 243-bp SINE/Pre0_ss transposon, a 67-bp A-rich low complexity sequence. All annotations are from the ENSEMBL database. The middle sequence shows the alignment for flanking 20 bp of DEL two ends. The lower color boxed sequences and different color blocks show the low complexity sequence characteristic for the 3 tail of DEL. c The 303 bp DEL related 3 motifs. The MEME online tool (https://meme-suite.org/meme/) was used to search and enrich related gene ontology terms of motifs in the sequence of the 303-bp DEL in the MYO5A gene. d Allele frequency of this 303-bp DEL for each main population
Fig. 6
Fig. 6
SV-related DEGs among sub-populations. a Normalized reads counts for three gene examples. For the crossbar plot, bars represent the sample mean, and lower and upper Gaussian 95% confidence limits of each individual, based on the t-distribution. Small points show gene expression for each individual. Bold underline texts of breeds refer to the specific SV occurred breeds. Bold italic texts refer to the highest FST SV paired breed. b Illustration of the genomic region for copy number gain of ABCG2. 8:130924619−130980283:DUP is shown by the pink box. Gene expression for three genes is shown on two sides of the figure. Hi-C TADs are annotated by purple triangles. Fifteen chromatin states of 14 tissues for Yorkshire are shown in different colors. Screenshot of integrative genomics viewer including read peaks and alignments for embryo RNA-seq data in Duroc and Yorkshire at the bottom
Fig. 7
Fig. 7
Genomic tracks near the 2 Mb region around the 51 bp DEL event. From top to bottom are Hi-C: Hi-C TADs annotated by purple triangles; chromatin states: 14 chromatin states for 14 tissues from FAANG project; genes (Ensembl): gene annotations from ENSEMBL database; 51-bp DEL-linked SNP: a total of 3584 SNPs were linked to the 51-bp DEL with their color legends listed above; and QTL: 66 QTL regions located in this 2-Mb SV-SNP linked region. The red line indicates the location of the 51-bp DEL, and the black asterisk denotes the eQTL “2:9621709C>T” which was associated with the loin muscle area by GWAS. The eGene FADS3 is highlighted in green, and its expression was associated with the loin muscle area in the embryo by TWAS

References

    1. Lunney JK, Van Goor A, Walker KE, Hailstock T, Franklin J, Dai C. Importance of the pig as a human biomedical model. Sci Trans Med. 2021;13(621):eabd5758. doi: 10.1126/scitranslmed.abd5758. - DOI - PubMed
    1. Längin M, Mayr T, Reichart B, Michel S, Buchholz S, Guethoff S, Dashkevich A, Baehr A, Egerer S, Bauer A, et al. Consistent success in life-supporting porcine cardiac xenotransplantation. Nature. 2018;564(7736):430–433. doi: 10.1038/s41586-018-0765-z. - DOI - PubMed
    1. Frantz LA, Schraiber JG, Madsen O, Megens HJ, Bosse M, Paudel Y, Semiadi G, Meijaard E, Li N, Crooijmans RP, et al. Genome sequencing reveals fine scale diversification and reticulation history during speciation in Sus. Genome Biol. 2013;14(9):R107. doi: 10.1186/gb-2013-14-9-r107. - DOI - PMC - PubMed
    1. Groenen MA, Archibald AL, Uenishi H, Tuggle CK, Takeuchi Y, Rothschild MF, Rogel-Gaillard C, Park C, Milan D, Megens HJ, et al. Analyses of pig genomes provide insight into porcine demography and evolution. Nature. 2012;491(7424):393–398. doi: 10.1038/nature11622. - DOI - PMC - PubMed
    1. Larson G, Dobney K, Albarella U, Fang M, Matisoo-Smith E, Robins J, Lowden S, Finlayson H, Brand T, Willerslev E, et al. Worldwide phylogeography of wild boar reveals multiple centers of pig domestication. Science. 2005;307(5715):1618–1621. doi: 10.1126/science.1106927. - DOI - PubMed

Publication types