

Blockade of histamine receptor H1 augments immune checkpoint therapy by enhancing MHC-I expression in pancreatic cancer cells
- PMID: 38715057
- PMCID: PMC11077718
- DOI: 10.1186/s13046-024-03060-5
Blockade of histamine receptor H1 augments immune checkpoint therapy by enhancing MHC-I expression in pancreatic cancer cells
Abstract
Background: Although immune checkpoint blockade (ICB) therapy has proven to be extremely effective at managing certain cancers, its efficacy in treating pancreatic ductal adenocarcinoma (PDAC) has been limited. Therefore, enhancing the effect of ICB could improve the prognosis of PDAC. In this study, we focused on the histamine receptor H1 (HRH1) and investigated its impact on ICB therapy for PDAC.
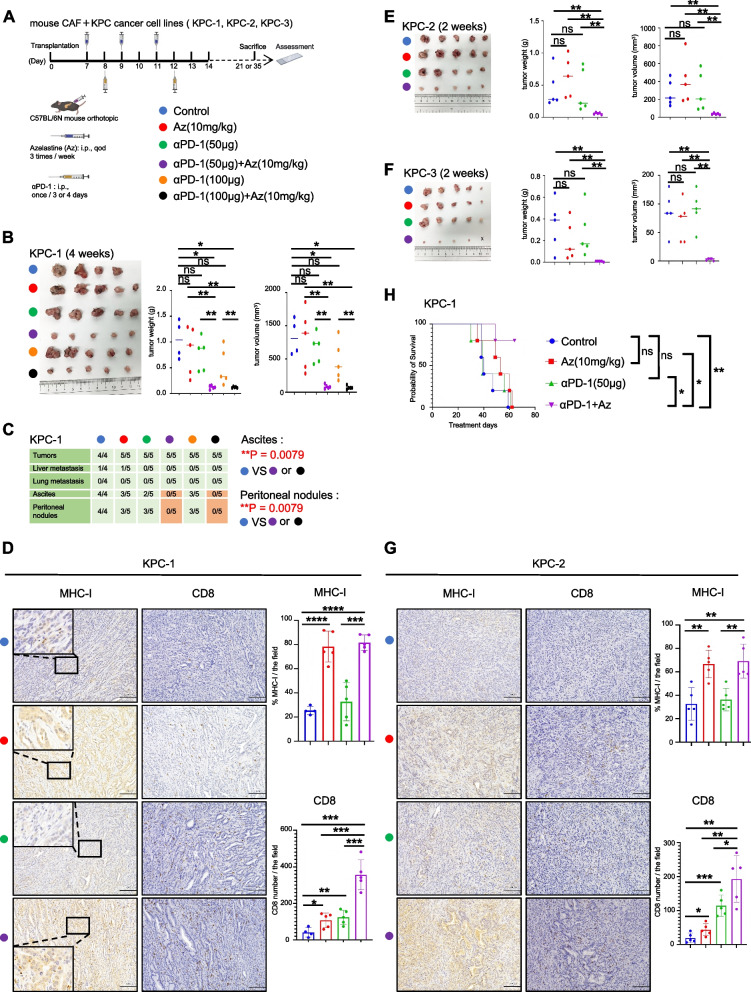
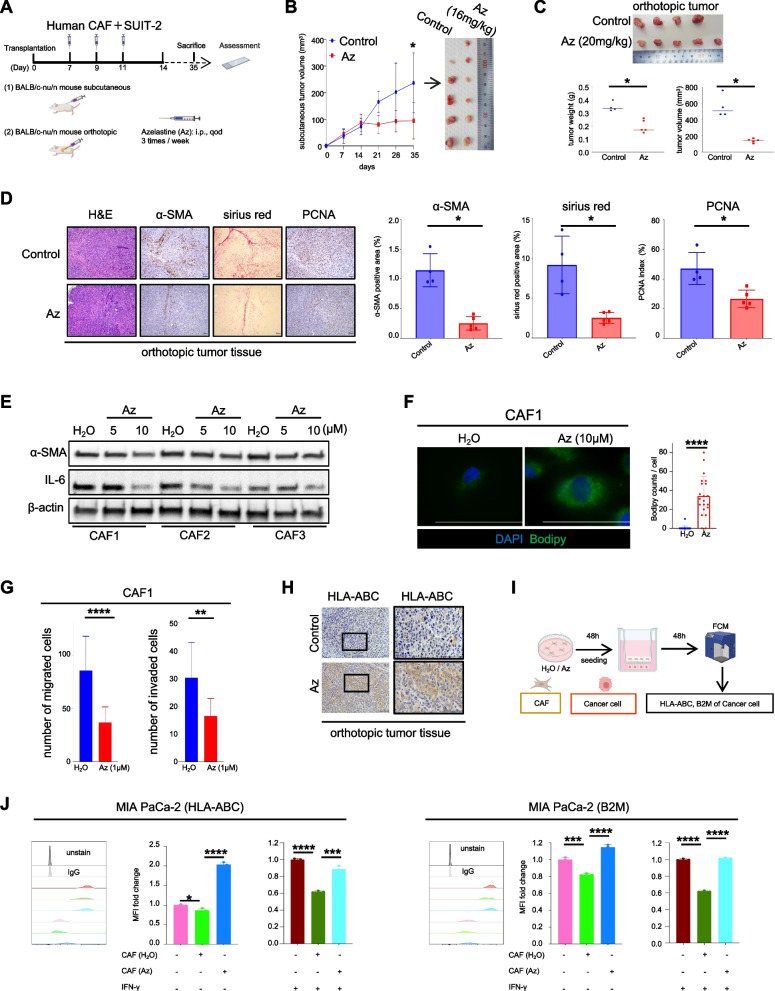
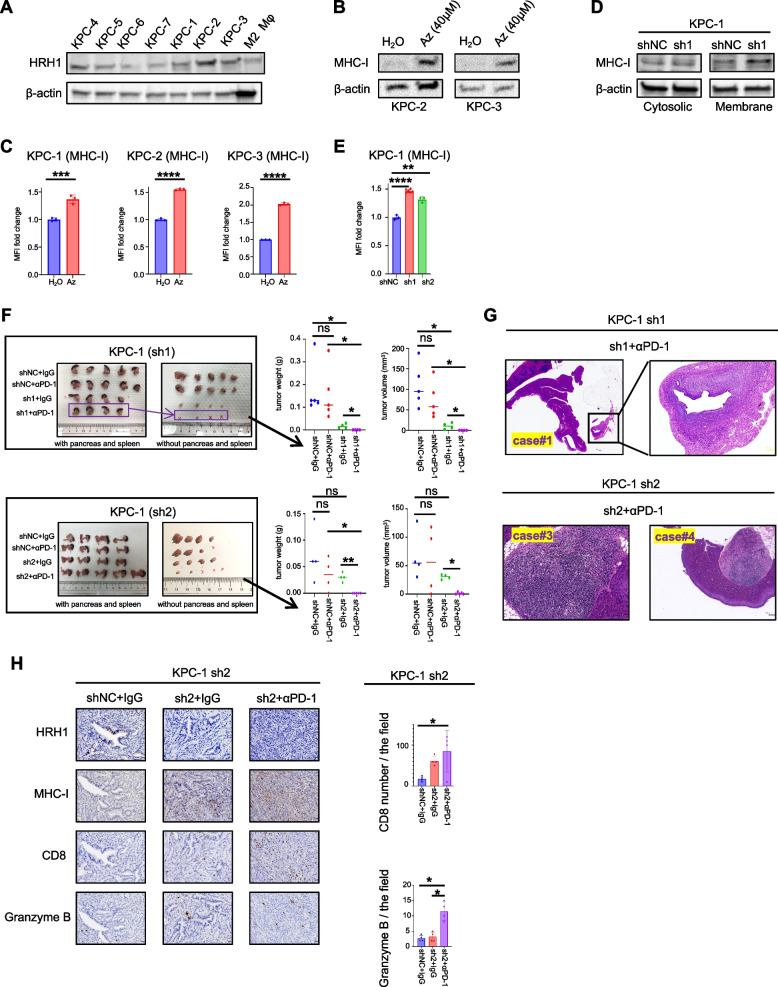
Methods: We assessed HRH1 expression in pancreatic cancer cell (PCC) specimens from PDAC patients through public data analysis and immunohistochemical (IHC) staining. The impact of HRH1 in PCCs was evaluated using HRH1 antagonists and small hairpin RNA (shRNA). Techniques including Western blot, flow cytometry, quantitative reverse transcription polymerase chain reaction (RT-PCR), and microarray analyses were performed to identify the relationships between HRH1 and major histocompatibility complex class I (MHC-I) expression in cancer cells. We combined HRH1 antagonism or knockdown with anti-programmed death receptor 1 (αPD-1) therapy in orthotopic models, employing IHC, immunofluorescence, and hematoxylin and eosin staining for assessment.
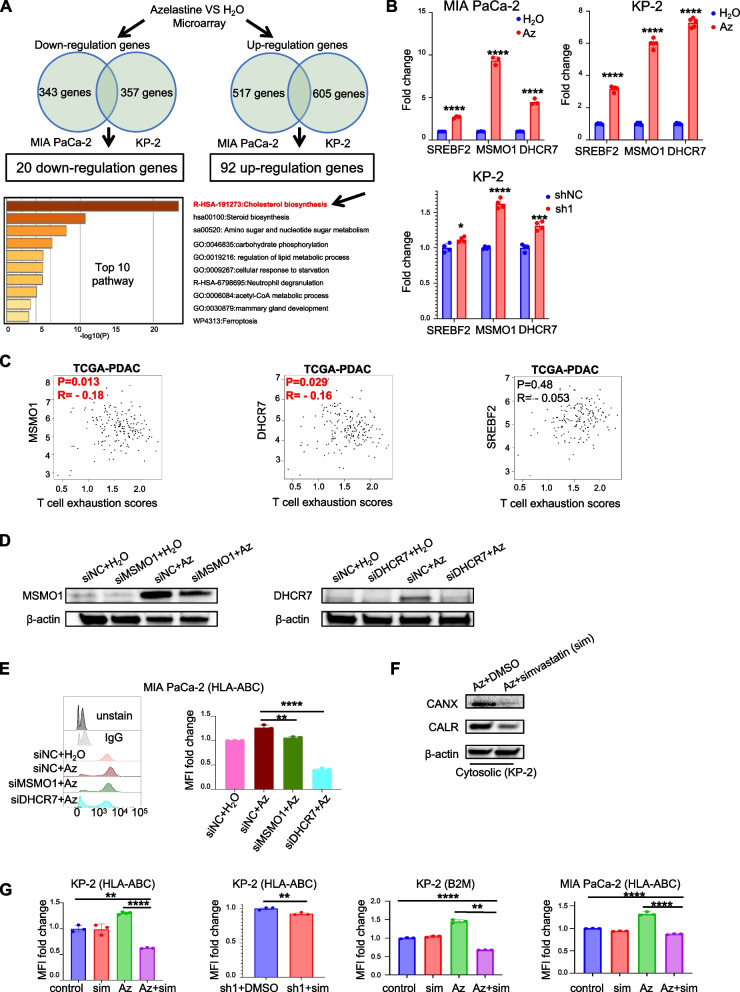
Results: HRH1 expression in cancer cells was negatively correlated with HLA-ABC expression, CD8+ T cells, and cytotoxic CD8+ T cells. Our findings indicate that HRH1 blockade upregulates MHC-I expression in PCCs via cholesterol biosynthesis signaling. In the orthotopic model, the combined inhibition of HRH1 and αPD-1 blockade enhanced cytotoxic CD8+ T cell penetration and efficacy, overcoming resistance to ICB therapy.
Conclusions: HRH1 plays an immunosuppressive role in cancer cells. Consequently, HRH1 intervention may be a promising method to amplify the responsiveness of PDAC to immunotherapy.
Keywords: Histamine receptor H1; Major histocompatibility complex class I; Pancreatic cancer cell.
© 2024. The Author(s).
Conflict of interest statement
The authors declare no competing interests.
Figures


Similar articles
-
Histamine H1 Receptor: A potential therapeutic target for pancreatic ductal adenocarcinoma.J Pharmacol Exp Ther. 2025 May;392(5):103573. doi: 10.1016/j.jpet.2025.103573. Epub 2025 Apr 4. J Pharmacol Exp Ther. 2025. PMID: 40288207
-
NDRG1 overcomes resistance to immunotherapy of pancreatic ductal adenocarcinoma through inhibiting ATG9A-dependent degradation of MHC-1.Drug Resist Updat. 2024 Mar;73:101040. doi: 10.1016/j.drup.2023.101040. Epub 2024 Jan 9. Drug Resist Updat. 2024. PMID: 38228036
-
Tumor-targeted interleukin-12 synergizes with entinostat to overcome PD-1/PD-L1 blockade-resistant tumors harboring MHC-I and APM deficiencies.J Immunother Cancer. 2022 Jun;10(6):e004561. doi: 10.1136/jitc-2022-004561. J Immunother Cancer. 2022. PMID: 35764364 Free PMC article.
-
Enhancing immuno-oncology efficacy with H1-antihistamine in cancer therapy: a review of current research and findings.Curr Med Res Opin. 2024 Dec;40(12):2139-2146. doi: 10.1080/03007995.2024.2427323. Epub 2024 Nov 10. Curr Med Res Opin. 2024. PMID: 39503414 Review.
-
Targeting the MHC-I endosomal-lysosomal trafficking pathway in cancer: From mechanism to immunotherapy.Biochim Biophys Acta Rev Cancer. 2024 Sep;1879(5):189161. doi: 10.1016/j.bbcan.2024.189161. Epub 2024 Aug 2. Biochim Biophys Acta Rev Cancer. 2024. PMID: 39096977 Review.
Cited by
-
Current and future immunotherapeutic approaches in pancreatic cancer treatment.J Hematol Oncol. 2024 Jun 4;17(1):40. doi: 10.1186/s13045-024-01561-6. J Hematol Oncol. 2024. PMID: 38835055 Free PMC article. Review.
-
Pancreatic Ductal Adenocarcinoma, β-blockers, and Antihistamines: A Clinical Trial Is Needed.Function (Oxf). 2025 Feb 12;6(1):zqae050. doi: 10.1093/function/zqae050. Function (Oxf). 2025. PMID: 39547938 Free PMC article. No abstract available.
-
Association of concomitant H1 antihistamine and immune checkpoint inhibitor therapy on survival outcome and safety in patients with advanced primary lung cancer: a cohort study.Transl Lung Cancer Res. 2024 Oct 31;13(10):2787-2801. doi: 10.21037/tlcr-24-795. Epub 2024 Oct 28. Transl Lung Cancer Res. 2024. PMID: 39507043 Free PMC article.
-
FGL1: a novel biomarker and target for non-small cell lung cancer, promoting tumor progression and metastasis through KDM4A/STAT3 transcription mechanism.J Exp Clin Cancer Res. 2024 Aug 1;43(1):213. doi: 10.1186/s13046-024-03140-6. J Exp Clin Cancer Res. 2024. PMID: 39085849 Free PMC article.
-
Cyclic increase in the histamine receptor H1-ADAM9-Snail/Slug axis as a potential therapeutic target for EMT-mediated progression of oral squamous cell carcinoma.Cell Death Dis. 2025 Mar 20;16(1):191. doi: 10.1038/s41419-025-07507-1. Cell Death Dis. 2025. PMID: 40113769 Free PMC article.
References
MeSH terms
Substances
Grants and funding
LinkOut - more resources
Full Text Sources
Medical
Molecular Biology Databases
Research Materials
