. 2024 May 7;21(1):119.
doi: 10.1186/s12974-024-03114-7.

Neurons upregulate PD-L1 via IFN/STAT1/IRF1 to alleviate damage by CD8+ T cells in cerebral malaria

Affiliations

Neurons upregulate PD-L1 via IFN/STAT1/IRF1 to alleviate damage by CD8+ T cells in cerebral malaria

Yi Wang et al. J Neuroinflammation. .

Abstract

Background: Cerebral malaria (CM) is the most lethal complication of malaria, and survivors usually endure neurological sequelae. Notably, the cytotoxic effect of infiltrating Plasmodium-activated CD8+ T cells on cerebral microvasculature endothelial cells is a prominent feature of the experimental CM (ECM) model with blood-brain barrier disruption. However, the damage effect of CD8+ T cells infiltrating the brain parenchyma on neurons remains unclear. Based on the immunosuppressive effect of the PD-1/PD-L1 pathway on T cells, our previous study demonstrated that the systemic upregulation of PD-L1 to inhibit CD8+ T cell function could effectively alleviate the symptoms of ECM mice. However, it has not been reported whether neurons can suppress the pathogenic effect of CD8+ T cells through the PD-1/PD-L1 negative immunomodulatory pathway. As the important inflammatory factor of CM, interferons can induce the expression of PD-L1 via different molecular mechanisms according to the neuro-immune microenvironment. Therefore, this study aimed to investigate the direct interaction between CD8+ T cells and neurons, as well as the mechanism of neurons to alleviate the pathogenic effect of CD8+ T cells through up-regulating PD-L1 induced by IFNs.

Methods: Using the ECM model of C57BL/6J mice infected with Plasmodium berghei ANKA (PbA), morphological observations were conducted in vivo by electron microscope and IF staining. The interaction between the ECM CD8+ T cells (immune magnetic bead sorting from spleen of ECM mice) and primary cultured cortical neurons in vitro was observed by IF staining and time-lapse photography. RNA-seq was performed to analyze the signaling pathway of PD-L1 upregulation in neurons induced by IFNβ or IFNγ, and verified through q-PCR, WB, IF staining, and flow cytometry both in vitro and in vivo using IFNAR or IFNGR gene knockout mice. The protective effect of adenovirus-mediated PD-L1 IgGFc fusion protein expression was verified in ECM mice with brain stereotaxic injection in vivo and in primary cultured neurons via viral infection in vitro.

Results: In vivo, ECM mice showed infiltration of activated CD8+ T cells and neuronal injury in the brain parenchyma. In vitro, ECM CD8+ T cells were in direct contact with neurons and induced axonal damage, as an active behavior. The PD-L1 protein level was elevated in neurons of ECM mice and in primary cultured neurons induced by IFNβ, IFNγ, or ECM CD8+ T cells in vitro. Furthermore, the IFNβ or IFNγ induced neuronal expression of PD-L1 was mediated by increasing STAT1/IRF1 pathway via IFN receptors. The increase of PD-L1 expression in neurons during PbA infection was weakened after deleting the IFNAR or IFNGR. Increased PD-L1 expression by adenovirus partially protected neurons from CD8+ T cell-mediated damage both in vitro and in vivo.

Conclusion: Our study demonstrates that both type I and type II IFNs can induce neurons to upregulate PD-L1 via the STAT1/IRF1 pathway mediated by IFN receptors to protect against activated CD8+ T cell-mediated damage, providing a targeted pathway to alleviate neuroinflammation during ECM.

Keywords: CD8+ T cell; Experimental cerebral malaria; Interferon; Neuron; PD-L1.


Conflict of interest statement

The authors declare that they have no competing interests.

Figures

Fig. 1
Fig. 1
Neurological damage and activated CD8+ T cell infiltration in the brains of ECM mice. A Electron microscope observation of neuron in the brainstem of ECM mice (yellow asterisk: change in nucleus shape; red arrow: demyelination; yellow arrow: mitochondria damage; blue arrow: autophagosome). B IF staining of TUNEL+ neurons (red arrow) in the brainstem and olfactory bulb of ECM mice. C IF staining of infiltrating CD8+ T cells (yellow arrow) which are close to neurons (NeuN+) in the brainstem and olfactory bulb of ECM mice. D IF staining of Ki67+CD8+ T cells (yellow arrow) in the brainstem of the ECM mice. E IF staining of IFNγ+CD8+ T cells (yellow arrow) in the brainstem of ECM mice
Fig. 2
Fig. 2
Direct interaction between neurons and ECM CD8+ T cells in the co-culture system. Primary cortical neurons were co-cultured with CD8+ T cells isolated from the spleen of ECM mice for 24 h. A LDH activity in supernatants of neurons co-cultured with ECM CD8+ T cells or naïve CD8+ T cells. Data are expressed as mean ± SD; unpaired t-test, n = 2 per group. B Flow cytometry of PI and SyTox green in neurons co-cultured with ECM CD8+ T cells. C IF staining of ECM CD8+ T cells (yellow arrow) adhesion to neurons (MAP2+). D IF staining of MAP2 in neurons co-cultured with different effect-target ratios of ECM CD8+ T cells (yellow arrow: axon damage). E WB analysis of APP levels in neurons co-cultured with ECM CD8+ T cells or naïve CD8+ T cells
Fig. 3
Fig. 3
IFNβ or IFNγ induces nerve cells to upregulate PD-L1 during ECM. A The violin plot of Pdcd1 expression in different types of cells from the brainstem of ECM mice (n = 3) through scRNA-seq analysis (Padj < 0.05). B The violin plot of Cd274 expression in neurons from the brainstem of control mice (n = 2) and ECM mice (n = 3) through scRNA-seq analysis (Padj < 0.05). C IHC staining of PD-L1 levels in the brainstem of control and ECM mice (red arrow: nerve cell). Data are expressed as mean ± SD; unpaired t-test; n = 8 fields per group. D WB analysis of PD-L1 levels in the olfactory bulb, cerebrum, cerebellum, and brainstem of control and ECM mice. Data are expressed as mean ± SD; unpaired t-test; n = 4. E IF staining of the IFNβ secretion in neurons (yellow arrow) and MAP2 cells (red arrow) in the brainstem of ECM mice. F) Flow cytometry of PD-L1 levels on neurons stimulated with IFNβ (100 U/mL) or IFNγ (20 ng/mL)
Fig. 4
Fig. 4
IFNβ or IFNγ induces PD-L1 expression in neurons through the STAT1/IRF1 pathway. A Violin plots of Cd274, Stat1, and Irf1 expression in neurons stimulated with IFNβ through RNA-seq analysis (n = 3 per group) (Padj < 0.05). B q-PCR detection of Stat1 and Irf1 expression in neurons with IFNβ (100 U/mL, the same below) or IFNγ (20 ng/mL, the same below) stimulation. Data are expressed as mean ± SD; unpaired t-test, n = 3 per group, ****P < 0.0001. C WB analysis of p-STAT1, IRF1, and PD-L1 levels in neurons with IFNβ or IFNγ stimulation. D Flow cytometry of PD-L1 levels on neurons treated with fludarabine (20 µM), IFNβ, or IFNγ. E Violin plots of Stat1 and Irf1 expression in neurons in the brainstem of control mice (n = 2) and ECM mice (n = 3) through scRNA-seq analysis (Padj < 0.05). F WB analysis of p-STAT1, IRF1, and PD-L1 levels in the brainstem of mice with PbA infection on days 3, 5, 7, and 9. G IHC staining of p-STAT1 in the brainstem of control and ECM mice (red arrow: neuron). H IHC staining of IRF1 in the brainstem of control and ECM mice (red arrow: neuron). G, H Data are expressed as mean ± SD; unpaired t-test; n = 8 fields per group
Fig. 5
Fig. 5
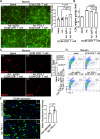
The STAT1/IRF1 pathway in Ifnar1−/− or Ifngr1−/− mice after PbA infection. A Flow cytometry of PD-L1 levels on Ifnar1−/− neurons stimulated with IFNβ or IFNγ. B Flow cytometry of PD-L1 levels on Ifngr1−/− neurons stimulated with IFNβ or IFNγ. C WB analysis of p-STAT1, IRF1, and PD-L1 levels in Ifnar1+/+ or Ifnar1−/− neurons, and Ifngr1+/+ or Ifngr1−/− neurons stimulated with IFNβ or IFNγ. D WB analysis of p-STAT1, IRF1, and PD-L1 in the brainstem of Ifnar1+/+ or Ifnar1−/− mice, and Ifngr1+/− or Ifngr1−/− mice with PbA infection, uninfected littermates as control. E IF staining of p-STAT1, IRF1, and PD-L1 in neurons (NeuN+) in the brainstem of Ifnar1+/− and Ifnar1−/− mice with PbA infection. The mean fluorescence intensity is expressed as mean ± SD; unpaired t-test; n ≥ 10 per group. F IF staining of the infiltrating IFNγ+CD8+ T cells (yellow arrow) in the olfactory bulb, cerebrum, cerebellum, and brainstem of Ifnar1−/− mice with PbA infection
Fig. 5
Fig. 5
The STAT1/IRF1 pathway in Ifnar1−/− or Ifngr1−/− mice after PbA infection. A Flow cytometry of PD-L1 levels on Ifnar1−/− neurons stimulated with IFNβ or IFNγ. B Flow cytometry of PD-L1 levels on Ifngr1−/− neurons stimulated with IFNβ or IFNγ. C WB analysis of p-STAT1, IRF1, and PD-L1 levels in Ifnar1+/+ or Ifnar1−/− neurons, and Ifngr1+/+ or Ifngr1−/− neurons stimulated with IFNβ or IFNγ. D WB analysis of p-STAT1, IRF1, and PD-L1 in the brainstem of Ifnar1+/+ or Ifnar1−/− mice, and Ifngr1+/− or Ifngr1−/− mice with PbA infection, uninfected littermates as control. E IF staining of p-STAT1, IRF1, and PD-L1 in neurons (NeuN+) in the brainstem of Ifnar1+/− and Ifnar1−/− mice with PbA infection. The mean fluorescence intensity is expressed as mean ± SD; unpaired t-test; n ≥ 10 per group. F IF staining of the infiltrating IFNγ+CD8+ T cells (yellow arrow) in the olfactory bulb, cerebrum, cerebellum, and brainstem of Ifnar1−/− mice with PbA infection
Fig. 6
Fig. 6
The protective effects of PD-L1 expression vector in neurons and ECM brains. A IF staining of PD-L1 in neurons co-cultured with ECM CD8+ T cells, after treatment with recombinant adenovirus expressing PD-L1 IgGFc fusion protein (Ad: PD-L1) or recombinant adenovirus expressing IgGFc (Ad: IgGFc). B LDH activity in supernatants of Ad: PD-L1 or Ad: IgGFc treated neurons co-cultured with ECM CD8+ T cells. Data are expressed as mean ± SD; unpaired t-test, n = 2 per group. C IF staining of MAP2 in Ad: PD-L1 or Ad: IgGFc treated neurons co-cultured with ECM CD8+ T cells. D Flow cytometry for JC-1 (FL-1: monomer, FL-2: aggregates) in Ad: PD-L1 or Ad: IgGFc treated neurons co-cultured with ECM CD8+ T cells. E IF staining of NeuN in neurons on Ad: PD-L1 injected side or non-injected side of ECM brainstem. AE Fluorescence statistical data are expressed as mean ± SD; unpaired t-test; n ≥ 3 per group. F) Nissl staining of neurons (red arrow) on Ad: PD-L1 injected side or non-injected side of ECM brainstem. Data are expressed as mean ± SD; unpaired t-test; n = 15 fields per group. G IF staining of Ki67 and CD8 on Ad: PD-L1 injected side or non-injected side of ECM brainstem (yellow arrow: Ki67+CD8+ T cell; green arrow: CD8+ T cell)
Fig. 6
Fig. 6
The protective effects of PD-L1 expression vector in neurons and ECM brains. A IF staining of PD-L1 in neurons co-cultured with ECM CD8+ T cells, after treatment with recombinant adenovirus expressing PD-L1 IgGFc fusion protein (Ad: PD-L1) or recombinant adenovirus expressing IgGFc (Ad: IgGFc). B LDH activity in supernatants of Ad: PD-L1 or Ad: IgGFc treated neurons co-cultured with ECM CD8+ T cells. Data are expressed as mean ± SD; unpaired t-test, n = 2 per group. C IF staining of MAP2 in Ad: PD-L1 or Ad: IgGFc treated neurons co-cultured with ECM CD8+ T cells. D Flow cytometry for JC-1 (FL-1: monomer, FL-2: aggregates) in Ad: PD-L1 or Ad: IgGFc treated neurons co-cultured with ECM CD8+ T cells. E IF staining of NeuN in neurons on Ad: PD-L1 injected side or non-injected side of ECM brainstem. AE Fluorescence statistical data are expressed as mean ± SD; unpaired t-test; n ≥ 3 per group. F) Nissl staining of neurons (red arrow) on Ad: PD-L1 injected side or non-injected side of ECM brainstem. Data are expressed as mean ± SD; unpaired t-test; n = 15 fields per group. G IF staining of Ki67 and CD8 on Ad: PD-L1 injected side or non-injected side of ECM brainstem (yellow arrow: Ki67+CD8+ T cell; green arrow: CD8+ T cell)

Similar articles

Cited by

References

    1. Venkatesan P. The 2023 WHO world malaria report. Lancet Microbe. 2024. - PubMed
    1. Rosa-Goncalves P, Ribeiro-Gomes FL, Daniel-Ribeiro CT. Malaria related neurocognitive deficits and behavioral alterations. Front Cell Infect Microbiol. 2022;12:829413. doi: 10.3389/fcimb.2022.829413. - DOI - PMC - PubMed
    1. Lyu HN, Ma N, Meng Y, Zhang X, Wong YK, Xu C, Liao F, Jiang T, Tu Y, Wang J. Study towards improving artemisinin-based combination therapies. Nat Prod Rep. 2021;38:1243–1250. doi: 10.1039/D0NP00079E. - DOI - PubMed
    1. Ofir-Birin Y, Ben Ami Pilo H, Cruz Camacho A, Rudik A, Rivkin A, Revach OY, Nir N, Block Tamin T, Abou Karam P, Kiper E, et al. Malaria parasites both repress host CXCL10 and use it as a cue for growth acceleration. Nat Commun. 2021;12:4851. doi: 10.1038/s41467-021-24997-7. - DOI - PMC - PubMed
    1. Molyneux ME, Taylor TE, Wirima JJ, Borgstein A. Clinical features and prognostic indicators in paediatric cerebral malaria: a study of 131 comatose Malawian children. Q J Med. 1989;71:441–459. - PubMed

MeSH terms