. 2024 May 7;12(1):73.
doi: 10.1186/s40478-024-01786-z.

Neuroinflammation is associated with Alzheimer's disease co-pathology in dementia with Lewy bodies

Affiliations

Neuroinflammation is associated with Alzheimer's disease co-pathology in dementia with Lewy bodies

Janna van Wetering et al. Acta Neuropathol Commun. .

Abstract

Background: Neuroinflammation and Alzheimer's disease (AD) co-pathology may contribute to disease progression and severity in dementia with Lewy bodies (DLB). This study aims to clarify whether a different pattern of neuroinflammation, such as alteration in microglial and astroglial morphology and distribution, is present in DLB cases with and without AD co-pathology.

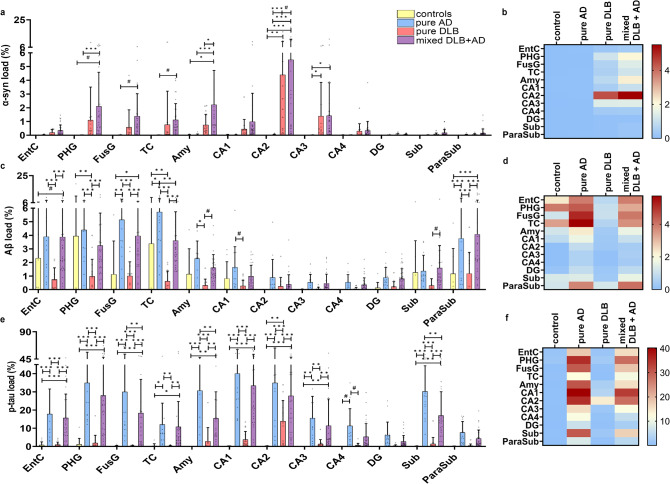
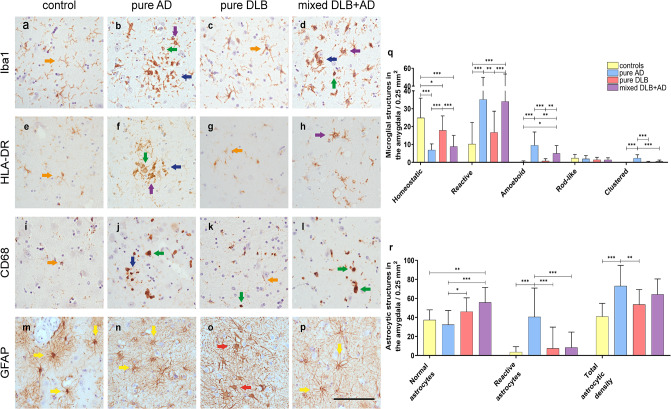
Methods: The morphology and load (% area of immunopositivity) of total (Iba1) and reactive microglia (CD68 and HLA-DR), reactive astrocytes (GFAP) and proteinopathies of alpha-synuclein (KM51/pser129), amyloid-beta (6 F/3D) and p-tau (AT8) were assessed in a cohort of mixed DLB + AD (n = 35), pure DLB (n = 15), pure AD (n = 16) and control (n = 11) donors in limbic and neocortical brain regions using immunostaining, quantitative image analysis and confocal microscopy. Regional and group differences were estimated using a linear mixed model analysis.

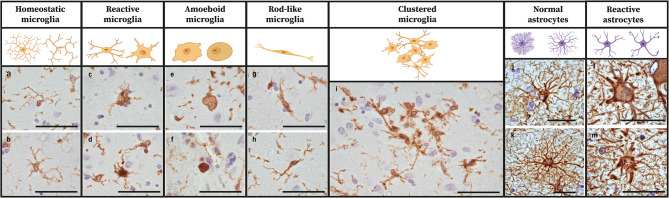
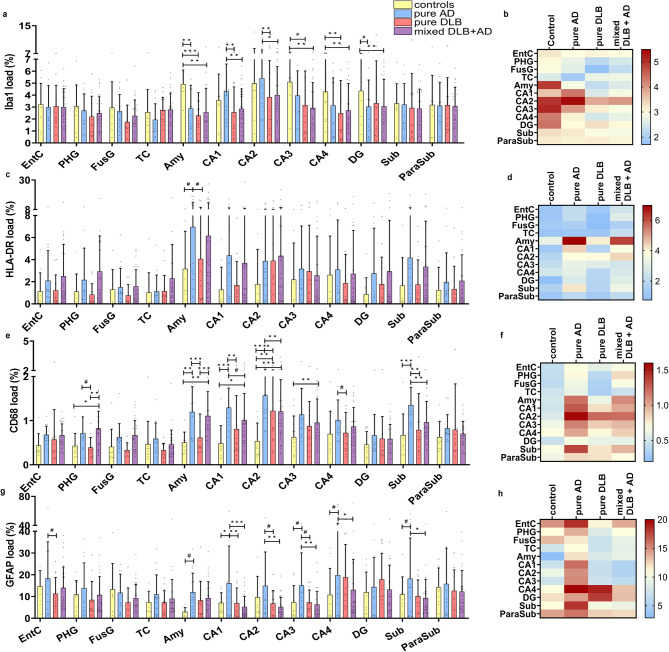
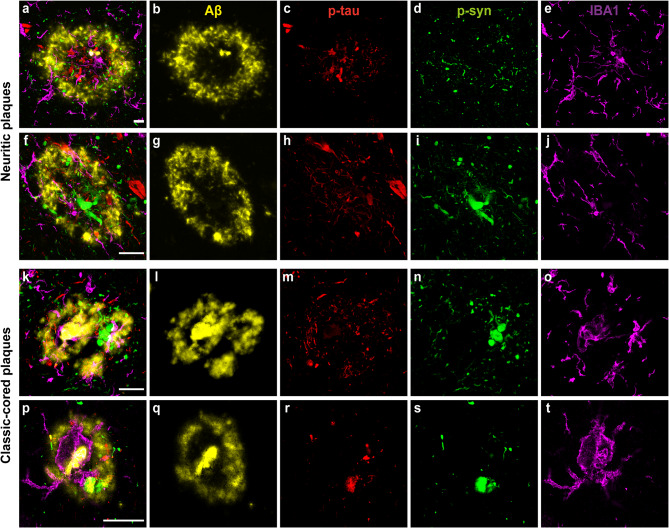
Results: Morphologically, reactive and amoeboid microglia were common in mixed DLB + AD, while homeostatic microglia with a small soma and thin processes were observed in pure DLB cases. A higher density of swollen astrocytes was observed in pure AD cases, but not in mixed DLB + AD or pure DLB cases. Mixed DLB + AD had higher CD68-loads in the amygdala and parahippocampal gyrus than pure DLB cases, but did not differ in astrocytic loads. Pure AD showed higher Iba1-loads in the CA1 and CA2, higher CD68-loads in the CA2 and subiculum, and a higher astrocytic load in the CA1-4 and subiculum than mixed DLB + AD cases. In mixed DLB + AD cases, microglial load associated strongly with amyloid-beta (Iba1, CD68 and HLA-DR), and p-tau (CD68 and HLA-DR), and minimally with alpha-synuclein load (CD68). In addition, the highest microglial activity was found in the amygdala and CA2, and astroglial load in the CA4. Confocal microscopy demonstrated co-localization of large amoeboid microglia with neuritic and classic-cored plaques of amyloid-beta and p-tau in mixed DLB + AD cases.

Conclusions: In conclusion, microglial activation in DLB was largely associated with AD co-pathology, while astrocytic response in DLB was not. In addition, microglial activity was high in limbic regions, with prevalent AD pathology. Our study provides novel insights into the molecular neuropathology of DLB, highlighting the importance of microglial activation in mixed DLB + AD.

Keywords: Alpha-synuclein; Alzheimer’s disease; Amyloid-beta; Astroglia; Co-pathology; Dementia with Lewy bodies; Immunohistochemistry; Lewy body disease; Microglia; Neuroinflammation; Phosphorylated-tau; Post-mortem.


Conflict of interest statement

The authors declare that they have no competing interests for this study. WvdB was financially supported by grants from Dutch Research council (ZonMW 70-73305-98-106; 70-73305-98-102; 40-46000-98-101), Alzheimer association (AARF-18-566459), MJ Fox foundation (17253), Parkinson Association (2020-G01), Health Holland and Stichting Woelse Waard. WvdB performed contract research for Roche Tissue Diagnostics, Discoveric Bio and Genentech, and received research consumables from Hoffmann-La Roche and Prothena.

Figures

Fig. 1
Fig. 1
The morphology of microglial and astrocytic structures in the amygdala. Schematic drawings of the common morphological microglial and astrocytic structures including representative immunostained images of these morphological subtypes in the amygdala. Morphological nomenclature is stated as derived from the previous papers [–67]. Immunostaining was performed with microglial marker Iba1 for images a-i and with astrocytic marker GFAP for images j-m. Homeostatic microglia have a small soma and long complex processes as shown in a control donor (a) and a pure DLB case (b). Reactive microglia show a larger soma with retracted and fewer processes as demonstrated in a mixed DLB + AD (c) and pure AD (d) case. Amoeboid microglia typically lack processes and have a large soma, here demonstrated in a pure AD (e) and control donor (f). Rod-like microglia are characterized by a long thin soma with long extended processes, shown here in a pure DLB case (g) and a control donor (h). Clustered microglia are characterized by the proximity of multiple microglial somas, and mostly consist of amoeboid and reactive microglial cells. An example of a large microglial cluster is shown in a pure AD case (i). Normal physiologic astrocytes have a small cell soma with long, thin and complex processes as shown in a pure DLB case (j) and a control donor (k). Reactive astrocytes have a larger cell soma with short, retracted and large processes as shown in a pure AD case (l, m). Scale bar represents 50 μm in each image
Fig. 2
Fig. 2
Distribution patterns of pathology in limbic and neocortical brain regions across diagnostic groups. Distribution of α-syn, Aβ and p-tau pathology is visualized in a scatter plot with box and heatmaps of mean pathological load [SD] in which the color-coded legend on the right indicates the %area of pathology. a-c α-Syn load was higher in the amygdala of mixed DLB + AD cases than in pure DLB cases. d-f Aβ pathology was higher in the TC of pure AD than mixed DLB + AD cases. g-i p-Tau was higher in the FusG, amygdala and subiculum of pure AD than mixed DLB + AD cases. A linear mixed model analysis with correction for age at death and sex was performed to estimate group differences. * p < 0.05, ** p < 0.01, *** p < 0.001, # p < 0.05 without significance after correction for multiple comparisons. EntC = entorhinal cortex; PHG = parahippocampal gyrus; FusG = fusiform gyrus; TC = temporal cortex; Amy = amygdala; CA = cornu ammonis; DG = dentate gyrus; Sub = subiculum; ParaSub = parasubiculum
Fig. 3
Fig. 3
Amoeboid and reactive microglial morphology and physiologic astrocytic morphology in mixed DLB cases. Representative images of microglial (a-l) and astrocytic (m-p) morphology in the amygdala with a scatter plot of the mean density of microglial Iba1-positive (q) and astrocytic (r) structures in the amygdala [SD]. a, e, i In control cases, homeostatic microglia with long processes (orange arrowhead) were observed. b, f, j In pure AD cases, amoeboid microglia with a large and round soma (green arrowhead), reactive microglia with short retracted processes (purple arrowhead) and clustered microglia (blue arrowhead) were observed. c, g, k In pure DLB cases, homeostatic (orange arrowhead) microglia and small amoeboid microglia (green arrowhead) were observed. d, h, l Mixed DLB + AD cases demonstrated amoeboid (green arrowhead), reactive (purple arrowhead) and clustered microglia (blue arrowhead). m, n, p In control, pure DLB and mixed DLB + AD cases normal physiologic astrocytes with a small soma and long, thin, complex processes (yellow arrowhead) were observed. o A higher total astrocytic density and reactive astrocytes with a swollen soma and short retracted processes (red arrowhead) were observed in pure AD cases. q The density of homeostatic microglia in the amygdala was significantly higher in control and pure DLB cases than in mixed DLB + AD and pure AD cases. The density of reactive and amoeboid microglia in the amygdala was higher in mixed DLB + AD and pure AD cases than in pure DLB and control cases. The density of clustered microglia in the amygdala was higher in pure AD cases than in all other groups. r The density of normal astrocytes was higher in mixed DLB + AD and pure DLB cases than in pure AD and controls, while the density of reactive astrocytes was higher in pure AD cases than in all other groups in the amygdala. Total astrocytic density in the amygdala was higher in pure AD than in pure DLB cases or controls. Scale bar in p is identical for all images and represents 100 μm
Fig. 4
Fig. 4
Microglial response was more severe in mixed DLB cases, while astrocytic response was similar to pure DLB. Distribution patterns in regions of interest are visualized in a scatter plot with box and heatmaps of mean microglial load [SD], in which the color-coded legend on the right indicates the %area of immunopositivity. a-c Iba1-positive microglial load was higher in controls than in pure AD in the amygdala, than in pure DLB in the amygdala and CA4, and higher than in mixed DLB + AD in the amygdala, CA3, CA4 and DG. d-f The highest reactive microglial load, measured by HLA-DR, was observed in the amygdala of mixed DLB + AD and pure AD cases, but was not significantly higher after correction for multiple comparisons. g-i Mixed DLB + AD showed a higher reactive microglial load, as measured by CD68, than pure DLB in the PHG and amygdala. Pure AD had a higher CD68 positive microglial load than mixed DLB + AD in the CA2 and subiculum. j-l Pure AD cases had a higher astrocytic load in the CA1, CA2, CA3, CA4 and subiculum than mixed DLB + AD cases. A linear mixed model analysis with correction for age at death and sex was performed to estimate group differences. * p < 0.05, ** p < 0.01, *** p < 0.001, # p < 0.05 without significance after correction for multiple comparisons. EntC = entorhinal cortex; PHG = parahippocampal gyrus; FusG = fusiform gyrus; TC = temporal cortex; Amy = amygdala; CA = cornu ammonis; DG = dentate gyrus; Sub = subiculum; ParaSub = parasubiculum
Fig. 5
Fig. 5
Representative confocal microscopy images of microglia in close proximity to AD-plaques in mixed DLB cases. Localization of pSer129-syn (green), Aβ (yellow), p-tau (red) and Iba1+ (purple) microglia in neuritic and classic cored plaques in the CA1, EntC and TC regions demonstrated with confocal microscopy. a-e Many large clustered and amoeboid Iba1-positive microglia with short, thick processes in the neuritic plaque in the CA1 within and in closer proximity to neuritic p-tau and p-syn accumulation. f-j Another example of rod-like and amoeboid Iba1-positive microglia in a neuritic plaque in the CA1. k-o Amoeboid and clustered microglia within and surrounding a classic-cored plaque in the EntC with neuritic p-tau and p-syn pathology. p-t Reactive microglial cell with large cell soma and thick processes within a classic-cored plaque with mainly Aβ pathology present in the TC. The scale bars in a, f, k, p are identical for all images in one row and represent 20 μm in all
Fig. 6
Fig. 6
Variants of APOEε4 and GBA1 genotype influenced the level of Aβ and p-tau pathology. Immunopositivity of α-syn, Aβ, p-tau, Iba1, HLA-DR, CD68 and GFAP is visualized in a scatter plot with box of mean pathology load over all measured brain regions [SD]. a Aβ load increased with the number of APOEε4 alleles and was significantly higher in heterozygous and homozygous than non-carriers. Microglial load was higher in homozygous than in heterozygous APOEε4 or than in non-carriers. b No differences in pathology or micro- or astroglial load were observed between different frequencies of HLA-DRB1*04 alleles. c Pathogenic GBA1 carriers had a higher Aβ and p-tau load than non-carriers. A linear mixed model analysis with correction for age of death and gender was performed to compare genotypes. * p < 0.05, ** p < 0.01, *** p < 0.001

References

    1. Cunningham EL, McGuinness B, Herron B, Passmore AP. Dementia. Ulster Med J. 2015;84(2):79–87. - PMC - PubMed
    1. Lane CA, Hardy J, Schott JM. Alzheimer’s disease. Eur J Neurol. 2018;25(1):59–70. doi: 10.1111/ene.13439. - DOI - PubMed
    1. McKeith IG, Boeve BF, Dickson DW, Halliday G, Taylor JP, Weintraub D, Kosaka K. Diagnosis and management of dementia with Lewy bodies: fourth consensus report of the DLB Consortium. Neurology. 2017;89(1):88–100. doi: 10.1212/wnl.0000000000004058. - DOI - PMC - PubMed
    1. Walker L, McAleese KE, Thomas AJ, Johnson M, Martin-Ruiz C, Parker C, Attems J. Neuropathologically mixed Alzheimer’s and Lewy body disease: burden of pathological protein aggregates differs between clinical phenotypes. Acta Neuropathol. 2015;129(5):729–748. doi: 10.1007/s00401-015-1406-3. - DOI - PubMed
    1. Geut H, Vergouw LJM, Galis Y, Ingrassia A, de Jong FJ, Quadri M, van de Berg WDJ. Neuropathological and genetic characteristics of a post-mortem series of cases with dementia with Lewy bodies clinically suspected of Creutzfeldt-Jakob’s disease. Parkinsonism Relat Disord. 2019;63:162–168. doi: 10.1016/j.parkreldis.2019.02.011. - DOI - PubMed

Publication types

MeSH terms