. 2025 Mar 18;124(6):923-932.
doi: 10.1016/j.bpj.2024.05.003. Epub 2024 May 7.

Quantifying cell cycle regulation by tissue crowding

Affiliations

Quantifying cell cycle regulation by tissue crowding

Carles Falcó et al. Biophys J. .

Abstract

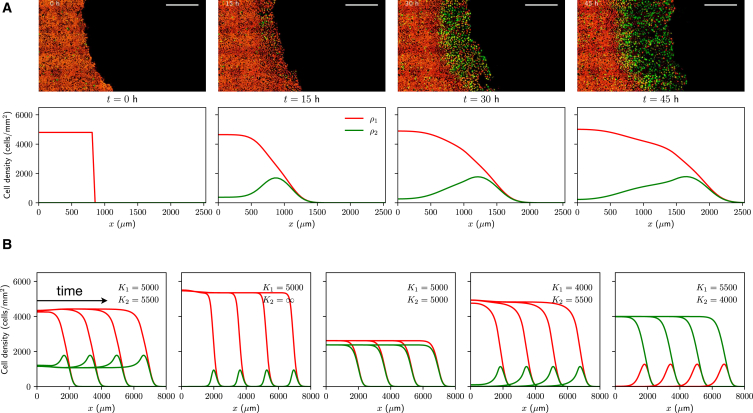
The spatiotemporal coordination and regulation of cell proliferation is fundamental in many aspects of development and tissue maintenance. Cells have the ability to adapt their division rates in response to mechanical constraints, yet we do not fully understand how cell proliferation regulation impacts cell migration phenomena. Here, we present a minimal continuum model of cell migration with cell cycle dynamics, which includes density-dependent effects and hence can account for cell proliferation regulation. By combining minimal mathematical modeling, Bayesian inference, and recent experimental data, we quantify the impact of tissue crowding across different cell cycle stages in epithelial tissue expansion experiments. Our model suggests that cells sense local density and adapt cell cycle progression in response, during G1 and the combined S/G2/M phases, providing an explicit relationship between each cell-cycle-stage duration and local tissue density, which is consistent with several experimental observations. Finally, we compare our mathematical model's predictions to different experiments studying cell cycle regulation and present a quantitative analysis on the impact of density-dependent regulation on cell migration patterns. Our work presents a systematic approach for investigating and analyzing cell cycle data, providing mechanistic insights into how individual cells regulate proliferation, based on population-based experimental measurements.


Conflict of interest statement

Declaration of interests The authors declare no competing interests.

Figures

Figure 1
Figure 1
Spatiotemporal dynamics of cell cycle. (A) Schematics of the FUCCI cell cycle marker system and model conceptualization. Transitions in the model given by Eq. (1) are regulated by the crowding functions f(ρ) and g(ρ), dependent on the total cell density ρ=ρ1+ρ2. (B) FUCCI fluorescence images from the experiments of Heinrich et al. (19) at different time points (adapted). Initial tissue diameter 3.4 mm. Scale bars correspond to 1 mm. (C) Segmented data showing G1 (red), S/G2/M (green), and postmitotic (gray) cells. Note that in the model we combine postmitotic cells and cells in G1. (D) Zoomed-in segmented data at the tissue edge and center, corresponding to the black squares in (C). (E) Fraction of cell-cycle-state cells in the tissue center and in the tissue edge, defined as regions extending 200 μm from the tissue center and tissue edge, respectively. (F) Density profiles in polar coordinates at t=40 h, showing cells in G1, S/G2/M, and postmitotic cells. (E) and (F) show the average of 11 independent tissue expansions with the same experimental initial condition, with shaded regions indicating one standard deviation with respect to the mean.
Figure 2
Figure 2
Density-dependent effects regulate cell cycle dynamics in epithelial tissue expansion experiments (19). Parameter estimation and model-data comparison for the model given by Eqs. (1) and (2). (A) Univariate marginal posterior distributions for the model parameters. Posterior modes are given by (D,k1,k2,K1,K2)=(1300±66 μm2/h, 0.612±0.015 h−1, 0.457±0.011 h−1, 4965±38 cells/mm2, 5435±45 cells/mm2), where errors correspond to one standard deviation. (B) Estimated duration of the G0/G1/post M (red) and S/G2/M (green) phases, as well as the whole cell cycle (black), as a function of cell densities. Solid lines correspond to posterior modes, and shaded regions are obtained sampling from the posterior distribution. (C) Comparing data and model predictions. Squares represent the estimated cell density obtained by averaging 11 experimental realizations, which we use to calibrate the model. Shaded regions denote one standard deviation with respect to the mean; see Fig. S2 for confidence intervals in the model predictions. Numerical simulations in polar coordinates were obtained by using the posterior modes as parameter values and no-flux boundary conditions; for details on the numerical scheme, we refer to the supporting material. In order to minimize the effects of the stencil removal on cell behavior, the initial condition corresponds to the experimental density profile 10 h after stencil removal.
Figure 3
Figure 3
Cell cycle regulation by tissue crowding impacts cell migration. (A) Comparison with the tissue colonization experiments of Streichan et al. (2) (top row, adapted with permission). Scale bars correspond to 500 μm. Bottom row shows numerical solutions of Eq. (1) on a one-dimensional domain of length 3000 μm with no-flux boundary conditions, and initial conditions are as follows: ρ1(x,0)=4800 cells/mm2 for x<850 μm and ρ1(x,0)=0 cells/mm2 otherwise; ρ2(x,0)=0. Parameter values correspond to the posterior modes in Fig. 2. (B) Traveling wave solutions of Eq. (1) for different values of K1 and K2 and at time points t=50,100,150,200 h. Units of K1 and K2 are cells/mm2. Initial conditions: ρ1(x,0)=ρ2(x,0)=500 cells/mm2 for x<850 μm, and ρ1(x,0)=ρ2(x,0)=0 cells/mm2 otherwise. In all cases, all parameters except for K1 and K2 are fixed (taken from posterior modes).
Figure 4
Figure 4
Cell cycle transition rates (k1,k2) and crowding constraints (K1,K2) determine cell proliferation patterns in growing tissues. (A) Schematic of traveling wave solutions near the tissue edge. (B and C) Approximated S/G2/M cell densities at the tissue edge and tissue bulk as a function of the ratios κ=k1/k2 and K1/K2. The black dashed line corresponds to the curve K1/K2=ακ=2/κ2+6κ+1κ+1.
Figure 5
Figure 5
Absence of density-dependent effects in a low-density scratch assay experiment (1205Lu melanoma cells). In this case, an exponential growth model can reproduce the experimental data. Density is normalized by using the theoretical maximum density corresponding to hexagonal close packing of cells (7). Top row is adapted from (8), with scale bars corresponding to 200 μm. Numerical solutions of Eq. (1) with f(ρ)=g(ρ)=1 on a one-dimensional domain. Parameters are estimated using the experimental data from (8); see Fig. S6 for posterior distributions.

References

    1. Jorgensen P., Tyers M. How cells coordinate growth and division. Curr. Biol. 2004;14:R1014–R1027. - PubMed
    1. Streichan S.J., Hoerner C.R., et al. Hufnagel L. Spatial constraints control cell proliferation in tissues. Proc. Natl. Acad. Sci. USA. 2014;111:5586–5591. - PMC - PubMed
    1. Massagué J. G1 cell-cycle control and cancer. Nature. 2004;432:298–306. - PubMed
    1. McClatchey A.I., Yap A.S. Contact inhibition (of proliferation) redux. Curr. Opin. Cell Biol. 2012;24:685–694. - PubMed
    1. Otto T., Sicinski P. Cell cycle proteins as promising targets in cancer therapy. Nat. Rev. Cancer. 2017;17:93–115. - PMC - PubMed

LinkOut - more resources