. 2024 Mar 15;27(4):109512.
doi: 10.1016/j.isci.2024.109512. eCollection 2024 Apr 19.

The brain-specific kinase LMTK3 regulates neuronal excitability by decreasing KCC2-dependent neuronal Cl- extrusion

Affiliations

The brain-specific kinase LMTK3 regulates neuronal excitability by decreasing KCC2-dependent neuronal Cl- extrusion

Noell Cho et al. iScience. .

Abstract

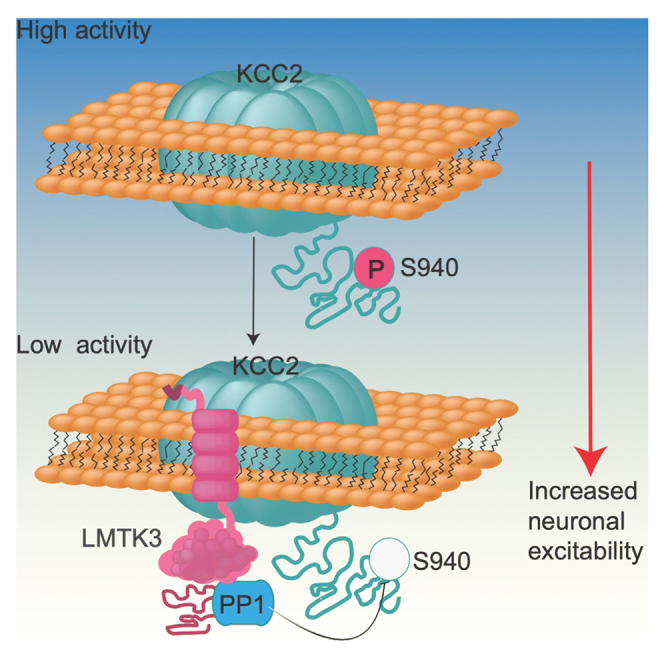
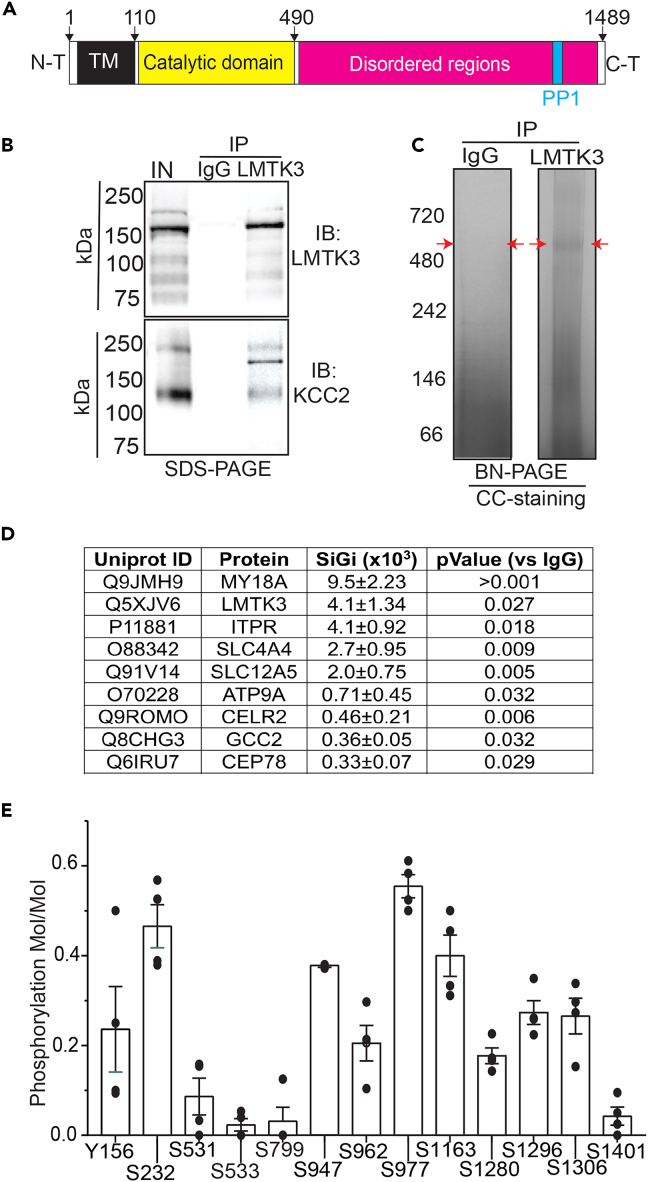
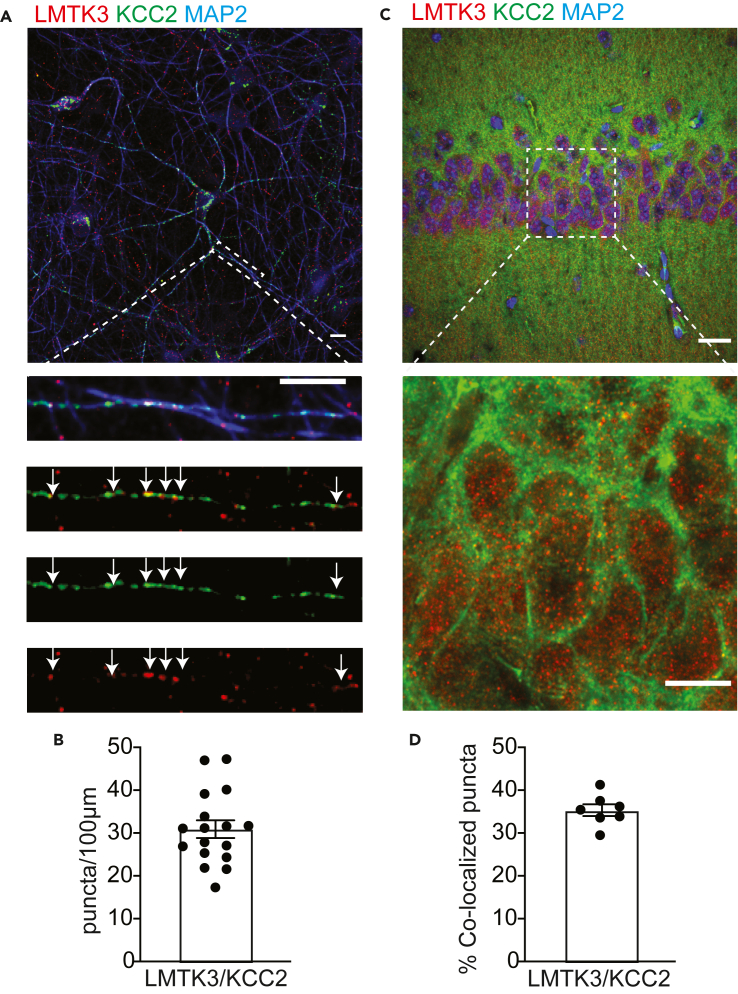
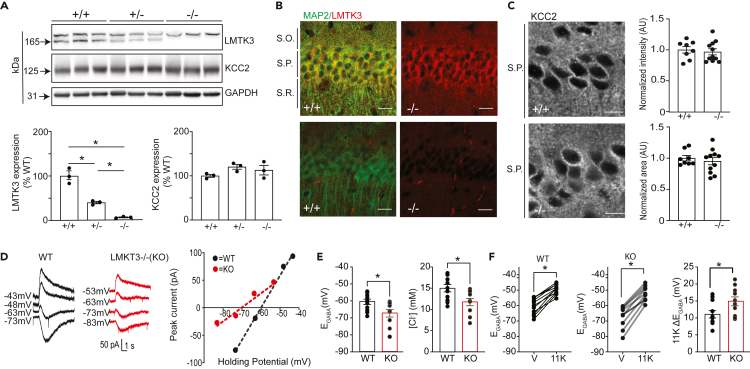
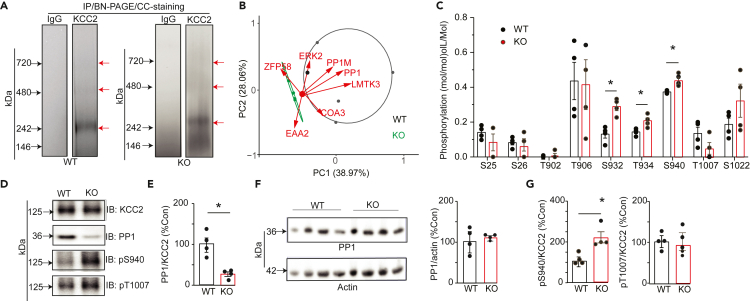
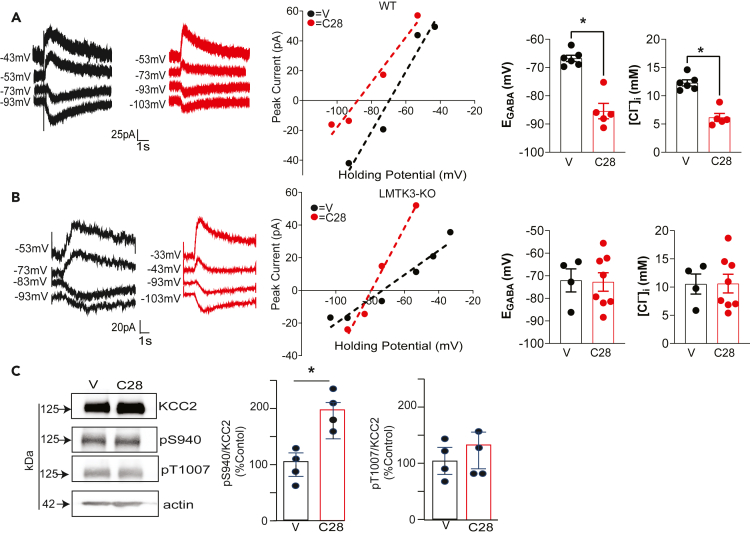
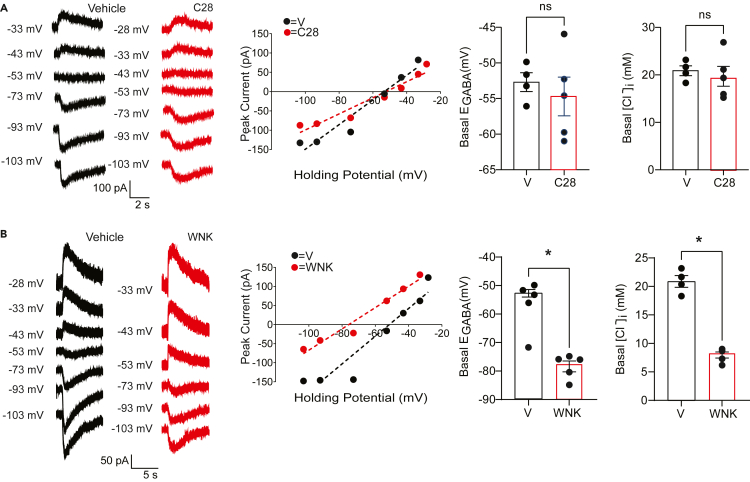
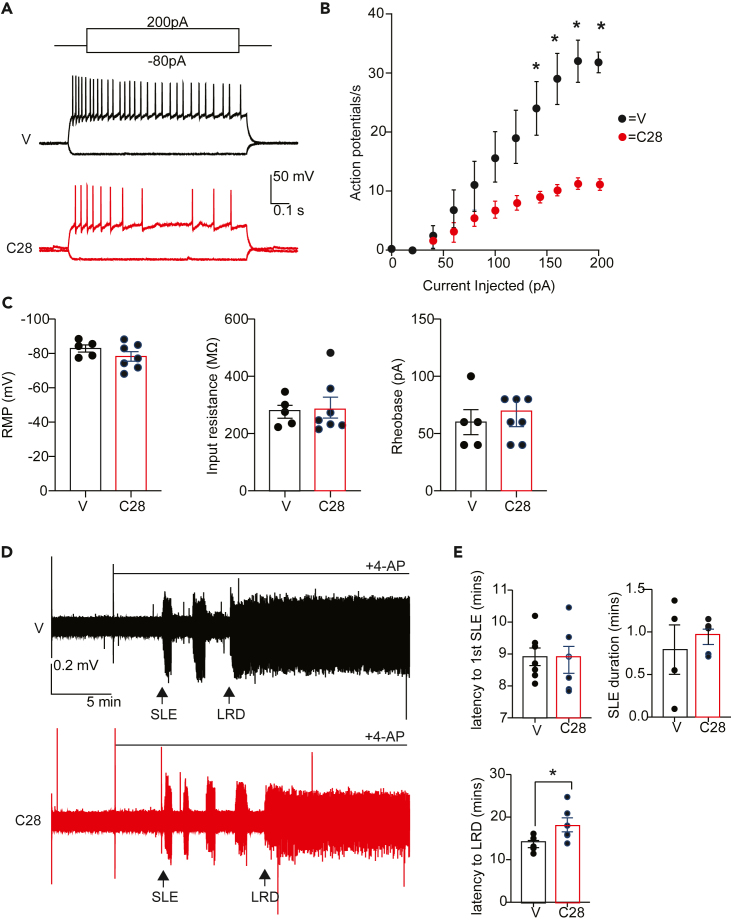
LMTK3 is a brain-specific transmembrane serine/threonine protein kinase that acts as a scaffold for protein phosphatase-1 (PP1). Although LMKT3 has been identified as a risk factor for autism and epilepsy, its physiological significance is unknown. Here, we demonstrate that LMTK3 copurifies and binds to KCC2, a neuron-specific K+/Cl- transporter. KCC2 activity is essential for Cl--mediated hyperpolarizing GABAAR receptor currents, the unitary events that underpin fast synaptic inhibition. LMTK3 acts to promote the association of KCC2 with PP1 to promote the dephosphorylation of S940 within its C-terminal cytoplasmic domain, a process the diminishes KCC2 activity. Accordingly, acute inhibition of LMTK3 increases KCC2 activity dependent upon S940 and increases neuronal Cl- extrusion. Consistent with this, LMTK3 inhibition reduced intrinsic neuronal excitability and the severity of seizure-like events in vitro. Thus, LMTK3 may have profound effects on neuronal excitability as an endogenous modulator of KCC2 activity.

Keywords: Biochemistry; Molecular biology; Neuroscience; Omics; Proteomics.


Conflict of interest statement

The authors declare no competing interests.

Figures

None
Graphical abstract
Figure 1
Figure 1
Examining the proteins that copurify with KCC2 from brain plasma membranes (A) Schematic representation of structure of LMTK3. TM, transmembrane domain, AA, amino acid. The PP1 binding site is shown in blue. (B) Solubilized brain membranes from 8- to 12-week-old mice were exposed to immobilized LMTK3 antibody or control IgG. After extensive washing, bound was eluted with SDS, subject to SDS-PAGE, and immunoblotted with KCC2 or LMTK3 antibodies. In, input. (C) Material purified on IgG and LMTK3 was eluted in 2% Tween, subject to BN-PAGE, and stained with colloidal Coomassie Brilliant Blue (CCB). The regions of the gels indicated by red arrows were excised, digested with trypsin, and subject to LC-MS/MS. (D) Significantly enriched proteins seen with LMTK3 antibody compared with IgG were then ranked via SiGi values. n = 4 purifications. (E) Phosphorylation of individual amino acids within LMTK3 was examined by comparing the ratios of phosphorylated/dephosphorylated amino acids with A scores>18; n = 4 purifications. In all panels, data represent mean ± SEM.
Figure 2
Figure 2
Comparing the subcellular distribution of LTK3 and KCC2 (A) 18–20 Div cultures were stained with LMTK3, KCC2, and MAP2 antibodies followed by confocal microscopy. A representative neuron is shown in the upper panel, and an enlargement of boxed area is shown below; the scale bar: 10 μm. (B) The number of LMTK3-KCC2 colocalized clusters per 100 micron of dendrite was then determined; n = 17 neurons from 3 cultures. (C) Brain sections were subject to immunostaining and confocal microscopy as outlined earlier. (D) The percentage of LMTK3 puncta that contain KCC2 was then determined; n = 7 hippocampi from 3 animals; the scale bar: 30 μm. In all panels data represent mean ± SEM.
Figure 3
Figure 3
Examining the effects of ablating LMTK3 on KCC2 expression levels and activity (A) Brain extracts from WT (+/+), heterozygotes (−/+), and homozygous (−/−) mice were immunoblotted with LMTK3, KCC2, and GAPDH antibodies. The levels of LMTK3 and KCC2 expression were then compared with those in WT (100%) mice; n = 3; ∗p < 0.05. (B) Brain sections from WT (+/+) and KO (LMTK3-KO) mice were stained with LMTK3 and MAP2 antibodies followed by confocal microscopy, and a representative image of CA1; scale bar: 20 μm. (C) High-magnification confocal images of the stratum pyramidale (s.p.) of WT (+/+) and LMTK3-KO (−/−) stained with KCC2 antibody; scale bar: 10 μm. KCC2 fluorescence intensity and total stained area were then compared with those seen in WT (100%), 8–10 slices from 3 mice. (D) Representative traces and I–V plots are shown for the polarity of currents induced by rapid application of muscimol in DGGCs in slices from WT and LMTK3-KO mice loaded with 32-mM Cl at differing voltages. (E) EGABA values and [Cl]i were determined from the voltage ramps and then compared in DGGCs between genotypes; ∗p < 0.01; t test; n = 7–9 mice. (F) Individual shifts in EGABA are shown for DGGCs from WT and KO mice following a 15-min exposure to the KCC2 inhibitor 11K. The magnitude in the EGABA shift (ΔEGABA) was then compared between genotypes. ∗p < 0.05; n = 7–9 mice. In all panels data represent mean ± SEM. Voltages are adjusted with a liquid junction potential value of −13 mV.
Figure 4
Figure 4
Examining the effects of ablating LMTK3 on PP1 recruitment to KCC2 and its phosphorylation (A) Solubilized brain membranes from 6- to 8-week-old WT and LMTK3-KO (KO) mice were exposed to immunopurified onKCC2 antibody or control IgG. Bound material was eluted in 2% Tween, subject to BN-PAGE, and stained with CCB. The regions of the gels indicated by the red arrows were excised, digested with trypsin, and subject to LC-MS/MS. (B) Proteins that copurified with KCC2 from WT and KO mice were using neutral labeling, and their composition was compared using PCA for each replicate (n = 4/genotype). The proteins indicated are the principle proteins that contribute to the separation between genotypes. (C) The phosphorylation of KCC2 was compared between genotypes using neutral labeling to determine the ratio of phosphorylated/dephosphorylated peptides for specific amino acids in the mature transporter. ∗p < 0.05; t test; n = 4 purifications. (D) KCC2 was immunopurified from WT and KO mice. Purified material was then subject to SDS-PAGE and immunoblotted with KCC2, PP1, pS940, and pT1007 antibodies. (E) The ratio of PP1/KCC2 immunoreactivity was determined and normalized to levels in WT; ∗p < 0.05; t test; n = 3 mice. (F) Total brain lysates were immunoblotted with antibodies against PP1 and actin. The ratios of PP1/actin immunoreactivity were then determined and compared with WT; n = 4 mice. (G) pS940/KCC2 and pT1007/KCC2 immunoreactivity were determined and normalized to levels in WT. ∗p < 0.05; t test; n = 3 mice. In all panels data represent mean ± SEM.
Figure 5
Figure 5
Inhibition of LMTK3 enhances KCC2 activity and S940 phosphorylation (A) Representative traces are shown for the polarity of currents induced by rapid application of muscimol in DGGCs in slices from WT mice loaded with 32-mM Cl− at differing voltages, which had been pretreated with V or 10-μM C28 for 1 h prior to recording. The recordings were used to determine EGABA and [Cl], which were then compared between treatments. ∗p < 0.01; t test; n = 5–6 mice. (B) Representative traces are shown for the polarity of currents induced by rapid application of muscimol in DGGCs in slices from LMTK3-KO mice loaded with 32-mM Cl− at differing voltages, which had been pretreated with V or 10-μM C28 for 1 h prior to recording. The recordings were used to determine EGABA and [Cl], which were then compared between treatments. n = 5–6 mice. (C) Acute hippocampal slices from WT mice were exposed to V or C28. SDS-soluble lysates were then immunoblotted with KCC2, pS940, pT1007, or actin antibodies. The ratio of pS940/KCC2 and pT1007/KCC2 immunoreactivity were then determined and normalized to values seen in V. ∗p < 0.05; t test; n = 4 mice. In all panels data represent mean ± SEM.
Figure 6
Figure 6
Examining the role that S940 plays in mediating the effects of C28 on KCC2 activity (A) Representative traces are shown for the polarity of currents induced by rapid application of muscimol in DGGCs in slices from S940A mice loaded with 32-mM Cl− at differing voltages, which had been pretreated with V or 10-μM C28 for 1 h prior to recording. The recordings were used to determine EGABA and [Cl], which were then compared between treatments. n = 4–5 mice. (B) Representative traces are shown for the polarity of currents induced by rapid application of muscimol in DGGCs in slices from S940A mice loaded with 32-mM Cl− at differing voltages, which had been pretreated with 10-mM WNK-463 (WNK) for 1 h prior to recording. The recordings were used to determine EGABA and [Cl], which were then compared between treatments. ∗p < 0.01; t test; n = 4–5 mice. In all panels data represent mean ± SEM. Voltages are adjusted with a liquid junction potential value of −13 mV.
Figure 7
Figure 7
Selective inhibition of LMTK3 results in reduced neuronal and network excitability (A) Representative traces following current injection of DGGCs in WT slices exposed to V or 10-μM C28 for 1 h prior to experimentation. (B) Input-output curves are shown that were generated for each treatment group, ∗p < 0.01; t test; n = 3–4 mice. (C) Resting membrane potential, input resistance, and rheobase were compared between treatments. n = 3–4 mice. (D) Representative traces are shown of field recordings from acute brain slices exposed to ASCF containing 4-AP pretreated with V or 10-μM C28 for 1 h prior to recording. (E) The latency to first SLE and their duration, in addition to the latency to LRD, was then compared between treatments. ∗p < 0.05; t test; n = 4–5 mice. In all panels data represent mean ± SEM.

References

    1. Rivera C., Voipio J., Payne J.A., Ruusuvuori E., Lahtinen H., Lamsa K., Pirvola U., Saarma M., Kaila K. The K+/Cl- co-transporter KCC2 renders GABA hyperpolarizing during neuronal maturation. Nature. 1999;397:251–255. doi: 10.1038/16697. - DOI - PubMed
    1. Williams J.R., Sharp J.W., Kumari V.G., Wilson M., Payne J.A. The neuron-specific K-Cl cotransporter, KCC2. Antibody development and initial characterization of the protein. J. Biol. Chem. 1999;274:12656–12664. doi: 10.1074/jbc.274.18.12656. - DOI - PubMed
    1. Kaila K., Price T.J., Payne J.A., Puskarjov M., Voipio J. Cation-chloride cotransporters in neuronal development, plasticity and disease. Nat. Rev. Neurosci. 2014;15:637–654. doi: 10.1038/nrn3819. - DOI - PMC - PubMed
    1. Virtanen M.A., Uvarov P., Mavrovic M., Poncer J.C., Kaila K. The Multifaceted Roles of KCC2 in Cortical Development. Trends Neurosci. 2021;44:378–392. doi: 10.1016/j.tins.2021.01.004. - DOI - PubMed
    1. Duy P.Q., David W.B., Kahle K.T. Identification of KCC2 Mutations in Human Epilepsy Suggests Strategies for Therapeutic Transporter Modulation. Front. Cell. Neurosci. 2019;13:515. doi: 10.3389/fncel.2019.00515. - DOI - PMC - PubMed