. 2024 May 8;9(9):e168792.
doi: 10.1172/jci.insight.168792.

Spon1+ inflammatory monocytes promote collagen remodeling and lung cancer metastasis through lipoprotein receptor 8 signaling

Affiliations

Spon1+ inflammatory monocytes promote collagen remodeling and lung cancer metastasis through lipoprotein receptor 8 signaling

Kristina M Whately et al. JCI Insight. .

Abstract

Lung cancer is the leading cause of cancer-related deaths in the world, and non-small cell lung cancer (NSCLC) is the most common subset. We previously found that infiltration of tumor inflammatory monocytes (TIMs) into lung squamous carcinoma (LUSC) tumors is associated with increased metastases and poor survival. To further understand how TIMs promote metastases, we compared RNA-Seq profiles of TIMs from several LUSC metastatic models with inflammatory monocytes (IMs) of non-tumor-bearing controls. We identified Spon1 as upregulated in TIMs and found that Spon1 expression in LUSC tumors corresponded with poor survival and enrichment of collagen extracellular matrix signatures. We observed SPON1+ TIMs mediate their effects directly through LRP8 on NSCLC cells, which resulted in TGF-β1 activation and robust production of fibrillar collagens. Using several orthogonal approaches, we demonstrated that SPON1+ TIMs were sufficient to promote NSCLC metastases. Additionally, we found that Spon1 loss in the host, or Lrp8 loss in cancer cells, resulted in a significant decrease of both high-density collagen matrices and metastases. Finally, we confirmed the relevance of the SPON1/LRP8/TGF-β1 axis with collagen production and survival in patients with NSCLC. Taken together, our study describes how SPON1+ TIMs promote collagen remodeling and NSCLC metastases through an LRP8/TGF-β1 signaling axis.

Keywords: Collagens; Immunology; Lung cancer; Monocytes; Oncology.


Figures

Figure 1
Figure 1. Identifying Spon1 as an important mediator of LUSC disease progression.
(A) Model showing the development of the KAL-LN2E1 metastatic LUSC cell line by in vivo passaging. (B) RNA-Seq data of genes that are differentially expressed in TIMs from both the LN2E1 and LN4K1 tumor models (across the 3 experimental conditions) when compared with their respective host strain BM-derived IMs (used as baselines). (C) Relative expression of top 10 genes with highest hazard ratios found to be overexpressed in TIMs by qPCR. (D) Spon1 expression in healthy versus tumor-bearing IMs from tumors and blood. (E) Plasma SPON1 concentrations (ng/mL) in healthy versus tumor bearing mice. (F) measure of SPON1 released from WT versus Spon1–/– IMs. (G) SPON1 levels as seen in plasma taken from WT versus Spon1–/– mice with orthotopic LLC tumors at day 19. (H) Total SPON1 expression for each cell type from human NSCLC single cell samples. ****P < 0.001, ***P < 0.001, **P < 0.01, *P < 0.05. Data are shown as the mean ± SEM incorporating biological and technical replicate samples. Two-tailed Student’s t test for 2-group comparisons.
Figure 2
Figure 2. SPON1hi patients show enrichment of EMT and collagen remodeling gene sets.
(A) Differentially expressed genes between SPON1hi and SPON1lo patients. GSEA following Fisher’s Exact Test. (B) Top 20 most highly significant gene sets enriched in the Hallmark, C5, and C2 data sets. (C) Specific enrichment plots for EMT (Hallmark), Collagen (C5), and TGF-β (Hallmark) pathways.
Figure 3
Figure 3. Spon1 increases fibrillar collagen and collagen remodeling gene expression in cancer cells.
(A) Schematic and representative LN2E1 spheroid formation assay in Matrigel with recombinant SPON1 treatment. (B and C) Spheroid area and numbers for LLC and spheroid area and numbers for LN2E1 with and without recombinant murine SPON1 treatment (5 μg/mL). (D and E) Collagen gene expression with SPON1 treatment in LLC spheroids and in LN2E1 spheroids. (F) Schematic of WT or Spon1–/– IM coculture with LN2E1 or LLC spheroids. (G) Spheroid area and collagen gene expression with WT or Spon1–/– IM coculture with LN2E1 spheroids. (H) Collagen gene expression with WT or Spon1–/– IM coculture with LLC spheroids. (I) Collagen gene expression of LN2E1 and LLC spheroids with recombinant SPON1, WT IMs, Spon1–/– IMs, or recombinant SPON1 plus Spon1–/– IMs. ****P < 0.001, ***P < 0.001, **P < 0.01, *P < 0.05. Data are shown as the mean ± SEM incorporating biological and technical replicate samples. Two-tailed Student’s t test for 2-group comparisons; 1-way ANOVA test for multiple comparisons.
Figure 4
Figure 4. Reduced tumor formation and collagen production in the absence of Spon1.
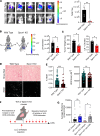
(A) IVIS imaging at 15 days from injection of LLC tumors into either WT or Spon1–/– mice. (B) Three-dimensional optical plus CT imaging at day 15 of LLC tumors in WT and Spon1–/– mice with higher resolution quantification. (C) Weight and counts of tumor burden from LLC tumors in WT and Spon1–/– mice. (D) Picrosirius red staining of FFPE tumors from WT and Spon1–/– mice. (E) Quantification of collagen read outs for high-density matrix (HDM). (F) Schematic of CD8 depletion experiment. (G) IVIS results at day 13 of LLC tumors in WT or Spon1–/– mice with Isotype or anti-CD8 antibody treatment. ***P < 0.001, **P < 0.01, *P < 0.05. Data are shown as the mean ± SEM incorporating biological and technical replicate samples. Two-tailed Student’s t test for 2-group comparisons. Total original magnification, ×20.
Figure 5
Figure 5. Phenotypic rescue of disease burden with restoration of Spon1+ TIMs.
(A) Schematic of adoptive transfer experiment with either WT or Spon1–/– IMs infused into Spon1–/– mice orthotopically injected with LLC cells. Infusions took place on days 6, 8, 11, and 12 after injections. (B) IVIS results on day 14 after injection. n = 3. (C) Gross histology visualization of disease burden. (D) Lymph node tumor weight and counts on day 14 after injection. n = 3. (E) Representative IVIS images of WT and Spon1–/– mice with or without adoptive transfer of WT or KO IMs. (F) IVIS results on day 5 after injection. n = 7 each group. (G) IVIS results on day 13 after injection. n = 7 each group. **P < 0.01, *P < 0.05. Data are shown as the mean ± SEM incorporating biological and technical replicate samples. Two-tailed Student’s t test for 2-group comparisons; 1-way ANOVA test for multiple comparisons.
Figure 6
Figure 6. Spon1 mediates its effects on disease progression and collagen content via LRP8.
(A and B) Collagen gene expression in both LN2E1 (A) and LLC (B) spheroids for negative control and LRP8 KO. (C and D) In vivo disease burden by tumor weight and counts in LN2E1 and LLC. (E) Collagen content in LLC shown by Sirius red high-density matrix levels. (F) In vivo IVIS results of LLC WT or LRP8-KO tumors in either WT mice or Spon1–/– mice. n = 9 each group. (G) TGF-β1 as a top upstream regulator of the genes composing our Collagen Gene Signature. (H and I) Phospho-SMAD2 scoring of WT and Spon1–/– LLC tumors and of negative control and LRP8-KO LLC tumors. Scale bars: 125 μM. (J) qPCR of Collagen and EMT genes of LN2E1 WT or LRP8-KO spheroids under treatment conditions of untreated, recombinant SPON1, TGF-βi (SB431542), recombinant SPON11+TGF-βi, and KRFK peptide. ****P < 0.001, ***P < 0.001, **P < 0.01, *P < 0.05. Data are shown as the mean ± SEM incorporating biological and technical replicate samples. Two-tailed Student’s t test for 2-group comparisons; 1-way ANOVA test for multiple comparisons.
Figure 7
Figure 7. Patient NSCLC tumors show Spon1+ TIMs, and LRP8 expression on cancer cells and TGF-β1 signaling positively correlate with collagen expression, which leads to poor survival.
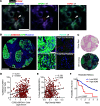
(A) CCR2+SPON1+ staining identifies SPON1+ TIMs in tumor cell islets (PanCK+) in an LUAD tumor. PanCK, white; CCR2, red; SPON1, green; Hoechst (nuclear stain), blue. Scale bar: 25 μM. Arrowheads are pointing to a CCR2+SPON1+ TIM. (B) Immunofluorescence staining of LUSC tumors showing cancer cells (aqua) expressing LRP8 (green) with TGF-β1 activation (+pSMAD2/red). Scale bars: 300 μM (full core), 50 μM (insets). (C) Sirius red staining of the same core used in B and an overlay with positive sirius red staining shown in white. (D and E) Two-sided Pearson correlations of percentage of pSMAD2+LRP8+panCK+ cells with CCR2+SPON1+ cell density (P < 0.0001, r = 0.272) (D) and between pSMAD2+LRP8+panCK+ cells and high-density matrix indices based on Sirius red staining (E) (P = 0.008, r = 0.139). (F) Survival differences between patients expressing high and low HDM (n = 164 patients, P = 0.0057).
Figure 8
Figure 8. Schematic of Spon1hi TIMs altering the LUSC TME.
Spon1hi TIMs are recruited to the TME and bind to their receptor, LRP8, located on cancer cells. Through TGF-β1 activation, they enhance upregulation of our Collagen Gene Signature, which includes several fibrillar collagens. This then leads to extracellular collagen deposition and increased protumorigenic phenotypes such as migration, invasion, spheroid formation, and metastases.

References

    1. Siegel RL, et al. Cancer statistics, 2022. CA Cancer J Clin. 2022;72(1):7–33. doi: 10.3322/caac.21708. - DOI - PubMed
    1. Warren GW, Cummings KM. Tobacco and lung cancer: risks, trends, and outcomes in patients with cancer. Am Soc Clin Oncol Educ Book. 2013:359–364. doi: 10.14694/EdBook_AM.2013.33.359. - DOI - PubMed
    1. Gandhi L, et al. Pembrolizumab plus chemotherapy in metastatic non-small-cell lung cancer. N Engl J Med. 2018;378(22):2078–2092. doi: 10.1056/NEJMoa1801005. - DOI - PubMed
    1. Paz-Ares L, et al. Pembrolizumab plus chemotherapy for squamous non-small-cell lung cancer. N Engl J Med. 2018;379(21):2040–2051. doi: 10.1056/NEJMoa1810865. - DOI - PubMed
    1. Brahmer J, et al. Nivolumab versus docetaxel in advanced squamous-cell non-small-cell lung cancer. N Engl J Med. 2015;373(2):123–135. doi: 10.1056/NEJMoa1504627. - DOI - PMC - PubMed

Publication types

MeSH terms

Substances