Randomized Controlled Trial
. 2024 May 8;9(9):e170210.
doi: 10.1172/jci.insight.170210.

Immune responses associated with protection induced by chemoattenuated PfSPZ vaccine in malaria-naive Europeans

Affiliations
Randomized Controlled Trial

Immune responses associated with protection induced by chemoattenuated PfSPZ vaccine in malaria-naive Europeans

Yoanne D Mouwenda et al. JCI Insight. .

Abstract

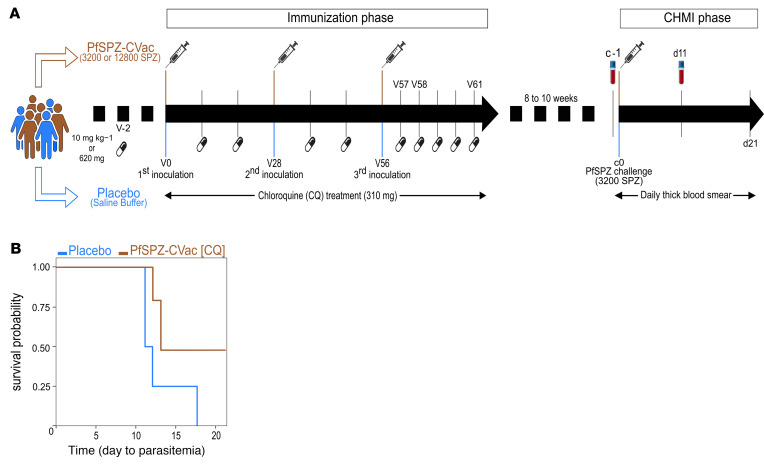
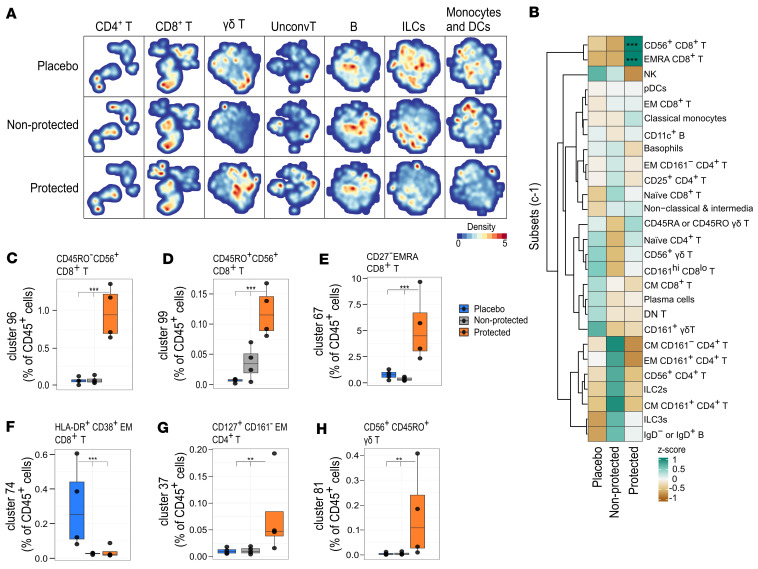
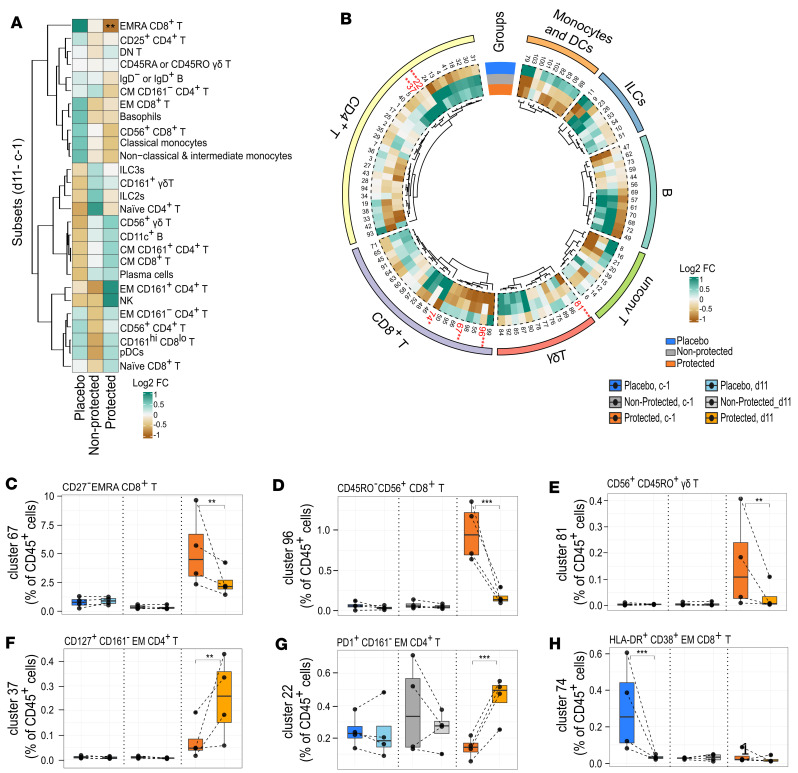
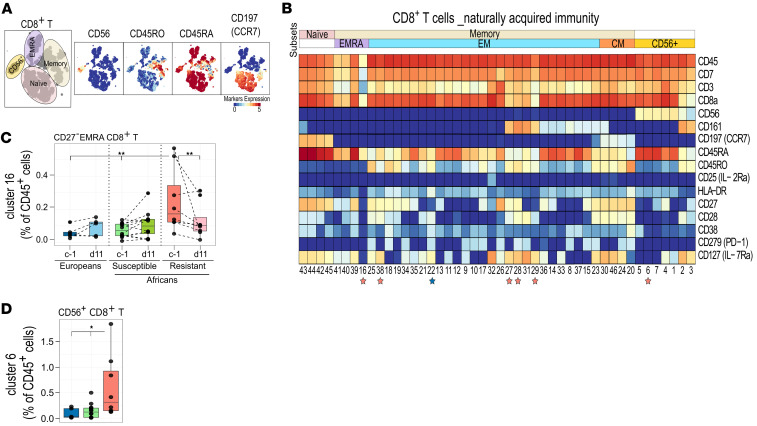
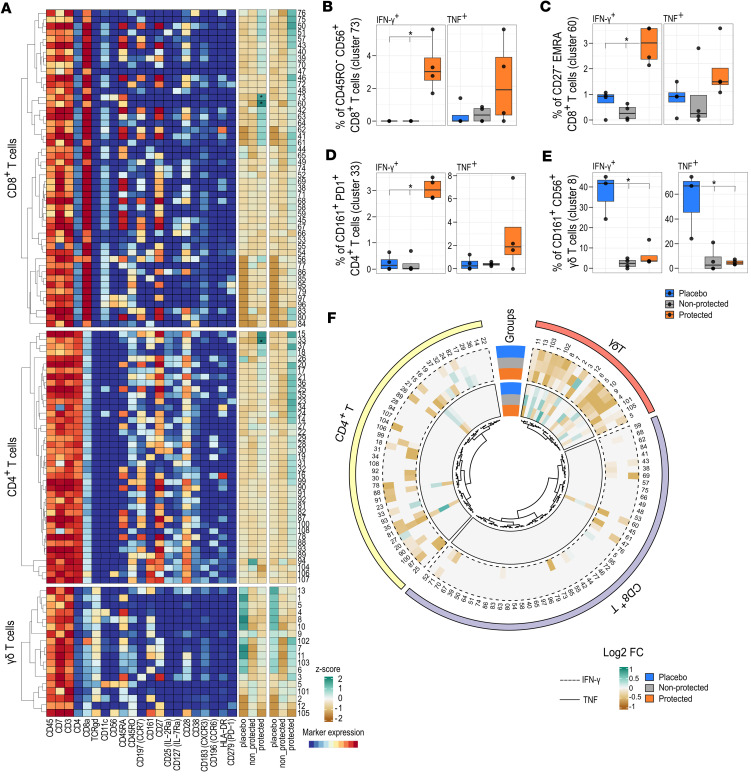
Vaccination of malaria-naive volunteers with a high dose of Plasmodium falciparum sporozoites chemoattenuated by chloroquine (CQ) (PfSPZ-CVac [CQ]) has previously demonstrated full protection against controlled human malaria infection (CHMI). However, lower doses of PfSPZ-CVac [CQ] resulted in incomplete protection. This provides the opportunity to understand the immune mechanisms needed for better vaccine-induced protection by comparing individuals who were protected with those not protected. Using mass cytometry, we characterized immune cell composition and responses of malaria-naive European volunteers who received either lower doses of PfSPZ-CVac [CQ], resulting in 50% protection irrespective of the dose, or a placebo vaccination, with everyone becoming infected following CHMI. Clusters of CD4+ and γδ T cells associated with protection were identified, consistent with their known role in malaria immunity. Additionally, EMRA CD8+ T cells and CD56+CD8+ T cell clusters were associated with protection. In a cohort from a malaria-endemic area in Gabon, these CD8+ T cell clusters were also associated with parasitemia control in individuals with lifelong exposure to malaria. Upon stimulation with P. falciparum-infected erythrocytes, CD4+, γδ, and EMRA CD8+ T cells produced IFN-γ and/or TNF, indicating their ability to mediate responses that eliminate malaria parasites.

Keywords: Cellular immune response; Cytokines; Immunology; Malaria; Vaccines.


Conflict of interest statement

Conflict of interest: The authors have declared that no conflict of interest exists.

Figures

Figure 1
Figure 1. TüCHMI trial and outcome.
(A) Healthy volunteers included in the trial were split in 2 main groups: the experimental group (in brown) consisted of volunteers (n = 8) receiving 3 doses of PfSPZ vaccine at 28-days intervals (V0, V28, and V56) in combination with a weekly dose of chloroquine up to 5 days after the last inoculation (V61) (PfSPZ-CVac [CQ]), and the placebo group (in blue), which consisted of volunteers (n = 4) inoculated with saline buffer. Eight to 10 weeks after the last inoculation, all volunteers in both the experimental and placebo groups underwent a CHMI trial. Immune responses to PfSPZ-CVac [CQ] inoculation were assessed at c–1 (1 day before the challenge [c0]) and d11 (11 days after the challenge). (B) Proportion of protected volunteers. Kaplan-Meier survival curves for days to parasitemia determined by thick blood smear for PfSPZ-CVac [CQ]–vaccinated (brown) and placebo (blue) groups. Volunteers in the placebo group all became malaria positive by day 18 after CHMI, while in the vaccinated group, some volunteers (4 of 8 volunteers vaccinated in total) remained malaria negative up to 21 days after CHMI.
Figure 2
Figure 2. Vaccine-induced immunity associated with protection prior to CHMI.
(A) Hierarchical stochastic neighbor embedding density maps showing differences in major cell lineages among volunteers n the placebo (n = 4), nonprotected (n = 4), and protected (n = 4) groups. The cell density per individual map is indicated by color. (B) Heatmap summary of Z scores of the normalized cell count per cell subset per group, where colors represent the mean Z score as indicated. (C) Box plots showing the frequency of CD56+CD8+ T cell cluster 96, (D) CD56+CD8+ T cell cluster 99, (E) EMRA CD8+ T cell cluster 67, (F) HLA-DR+CD38+ EM CD8+ T cells, (G) CD4+ T cell cluster 37, and (H) CD56+γδ T cell cluster 81 relative to CD45+ cells, comparing placebo (n = 4, blue), nonprotected (n = 4, gray), and protected (n = 4, orange) groups. The box plots represent the median and first and third quantile, and the whiskers represent the maximum/minimum, no further than 1.5 times the interquartile range (IQR). *P ≤ 0.05, **P < 0.01, ***P < 0.001, computed using the GLME model after FDR correction.
Figure 3
Figure 3. Dynamic changes of immune cell clusters following CHMI.
(A) Heatmap summary of log2 fold change (FC) of cell subsets from c–1 to d11. (B) Circos heatmap showing the log2 FC from c–1 to d11 for each cluster per group. Clusters that significantly change overtime are in red. (C) The frequency of EMRA CD8+ T cell cluster 67, (D) CD56+CD8+ T cell cluster 96, (E) CD56+ γδ T cell cluster 81, (F) CD161 EM CD4+ T cell cluster 37, (G) CD161+ EM CD4+ T cell cluster 22, and (H) HLA-DR+CD38+ EM CD8+ T cells (cluster 74), from c–1 to d11 per placebo (n = 4, blue), nonprotected (n = 4, gray), and protected (n = 4, orange) groups. Data in CH are presented as box plots, representing the median and first and third quantile, while the whiskers indicate the overall data range no further than 1.5 times the interquartile range (IQR). The interaction among the groups and the time points was computed in a generalized linear mixed models (GLMM) for binomial family) model to assess the dynamic change overtime. *P ≤ 0.05, **P < 0.01, ***P < 0.001 after FDR correction. The abundance of the indicated clusters is given as a percentage of CD45+ cells.
Figure 4
Figure 4. Characterization of CD8+ T cells in naturally acquired immunity.
(A) HSNE plots showing cell subsets within the CD8+ T cells lineage (left), annotated based on the indicated markers (right). Colors represent the arc-hyperbolic sine 5–transformed (arsinh-5–transformed) marker expression as indicated. (B) Heatmap of CD8+ T cell clusters, showing expression of markers as median signal intensity after arsinh transformation. Each cluster has a unique cluster number, and the subset to which each cluster belongs is shown at the top. The generalized linear mixed models (GLMM) for binomial family was used to compare cluster abundance among malaria-naive Europeans (n = 5, blue), lifelong exposed susceptible Africans (n = 12, green), and resistant Africans (n = 8, pink). Colored stars below the clusters indicate statistical significance in naive Europeans and lifelong exposed resistant Africans. (C and D) Box plot representing the median and first and third quantile of the frequency of (C) EMRA CD8+ T cells (cluster 16) and (D) CD56+CD8+ T cells (cluster 6), both relative to CD45+ cells. The whiskers of the box plots indicate a range no further than 1.5 times the interquartile range (IQR). *P ≤ 0.05, **P < 0.01, ***P < 0.001. P values were computed using the generalized linear mixed models (GLMM) for binomial family.
Figure 5
Figure 5. Cytokine response to PfRBC stimulation.
(A) The heatmap on the left shows the expression of markers as median signal intensity after arsinh transformation for CD8+, CD4+, and γδ T cells. Each cluster has a unique number. The heatmap on the right shows the summary of Z scores of the normalized frequency of cells producing IFN-γ and TNF per cluster (after subtraction of uRBCs) in placebo (n = 4), nonprotected (n = 4), and protected (n = 4) groups at baseline. The colors indicated represent the mean Z score per cluster per group. (B) Frequency of IFN-γ– and TNF-producing CD56+CD8+ T cells (cluster 73), (C) EMRA CD8+ T cells (cluster 60), (D) CD161+ EM CD4+ T cells, and (E) CD56+ γδ T cells, given as a percentage of parents among the indicated groups. The data are presented as box plots showing the median, the first, and the third quantile, and whiskers extend to the maximum/minimum, no further than 1.5 times the interquartile range (IQR). *P ≤ 0.05, computed using the generalized linear mixed models (GLMM) for binomial family. (F) Circos heatmap showing the log2 FC of IFN-γ– (dashed line) and TNF-producing (full line) cells from c–1 to d11.

References

    1. Verma R, et al. Malaria vaccine can prevent millions of deaths in the world. Hum Vaccin Immunother. 2013;9(6):1268–1271. doi: 10.4161/hv.23950. - DOI - PMC - PubMed
    1. WHO. World Malaria Report 2023. https://www.who.int/publications/i/item/9789240086173 Accessed March 18, 2024.
    1. Datoo MS, et al. Efficacy and immunogenicity of R21/Matrix-M vaccine against clinical malaria after 2 years’ follow-up in children in Burkina Faso: a phase 1/2b randomised controlled trial. Lancet Infect Dis. 2022;22(12):1728–1736. doi: 10.1016/S1473-3099(22)00442-X. - DOI - PubMed
    1. Arora N, et al. Towards eradication of malaria: is the WHO’s RTS,S/AS01 vaccination effective enough? Risk Manag Healthc Policy. 2021;14:1033–1039. doi: 10.2147/RMHP.S219294. - DOI - PMC - PubMed
    1. RTS,S Clinical Trials Partnership. Efficacy and safety of RTS,S/AS01 malaria vaccine with or without a booster dose in infants and children in Africa: final results of a phase 3, individually randomised, controlled trial. Lancet. 2015;386(9988):31–45. doi: 10.1016/S0140-6736(15)60721-8. - DOI - PMC - PubMed

Publication types

MeSH terms