. 2024 May 8;9(9):e175401.
doi: 10.1172/jci.insight.175401.

Modulation of innate immune response to mRNA vaccination after SARS-CoV-2 infection or sequential vaccination in humans

Affiliations

Modulation of innate immune response to mRNA vaccination after SARS-CoV-2 infection or sequential vaccination in humans

Fredrika Hellgren et al. JCI Insight. .

Abstract

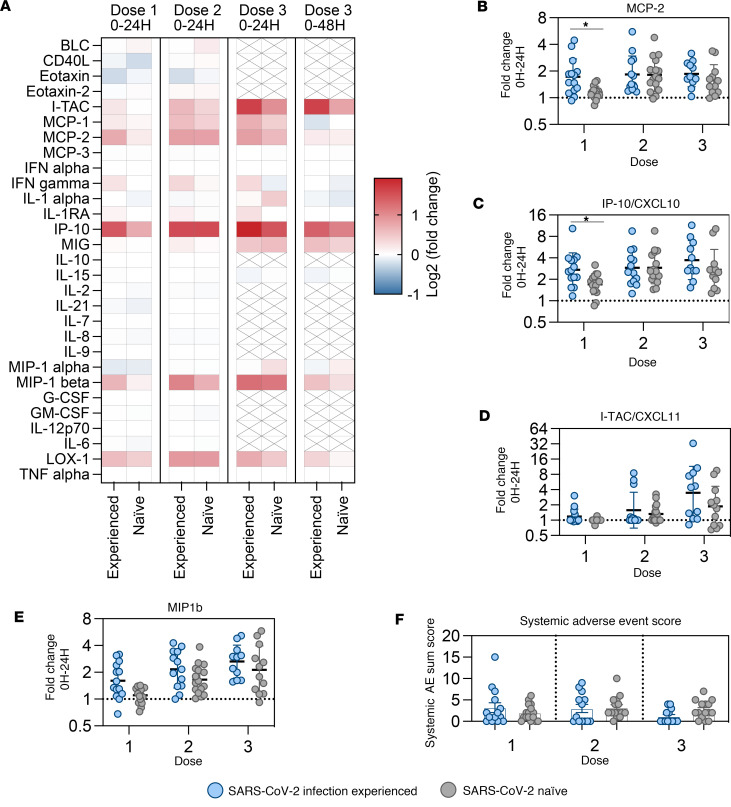
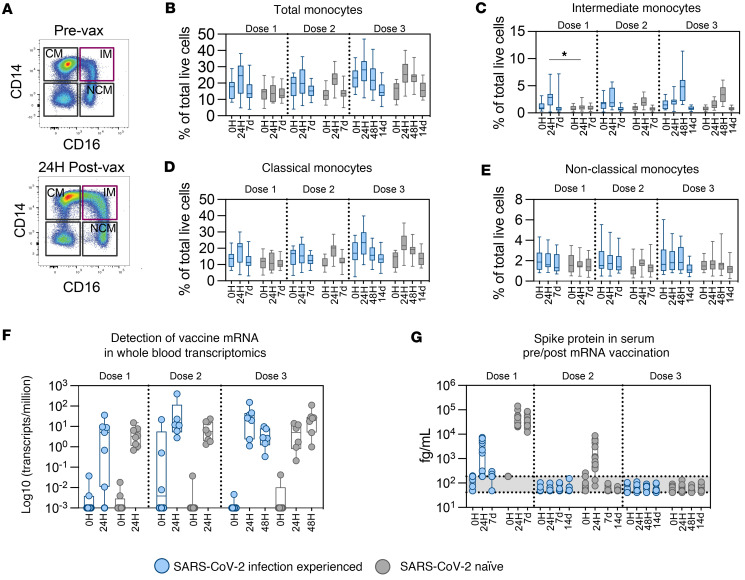
mRNA vaccines are likely to become widely used for the prevention of infectious diseases in the future. Nevertheless, a notable gap exists in mechanistic data, particularly concerning the potential effects of sequential mRNA immunization or preexisting immunity on the early innate immune response triggered by vaccination. In this study, healthy adults, with or without documented prior SARS-CoV-2 infection, were vaccinated with the BNT162b2/Comirnaty mRNA vaccine. Prior infection conferred significantly stronger induction of proinflammatory and type I IFN-related gene signatures, serum cytokines, and monocyte expansion after the prime vaccination. The response to the second vaccination further increased the magnitude of the early innate response in both study groups. The third vaccination did not further increase vaccine-induced inflammation. In vitro stimulation of PBMCs with TLR ligands showed no difference in cytokine responses between groups, or before or after prime vaccination, indicating absence of a trained immunity effect. We observed that levels of preexisting antigen-specific CD4 T cells, antibody, and memory B cells correlated with elements of the early innate response to the first vaccination. Our data thereby indicate that preexisting memory formed by infection may augment the innate immune activation induced by mRNA vaccines.

Keywords: Adaptive immunity; Immunology; Innate immunity; Vaccines.


Figures

Figure 1
Figure 1. Three doses of vaccine required to attain similar levels of humoral immunity in SARS-CoV-2 infection naive as infection-experienced individuals.
(A) Schematic of group division and sampling schedule. (B and C) Spike-binding (B) and RBD-binding (C) IgG plasma titers, quantified by binding ELISA. Data reported as IU/mL based on the WHO First International Standard. Data are shown as geometric mean ± geometric SD. (D) Plasma live virus neutralizing titers (Wu-Hu-1 equivalent strain, Swedish isolate). Data are shown as geometric mean ± geometric SD. (E) Antibody potency index, calculated as ratio of virus neutralizing titer (IC50) to spike binding titer (IU/mL). Line indicates geometric mean. (F) Spike IgG antibody avidity measured by chaotropic wash ELISA, reported as avidity index (% of antibody binding remaining after chaotropic wash). Data are shown as mean ± SEM. (G) Fraction of RBD-binding plasma IgG out of total spike binding measured by competition ELISA using recombinant RBD in solution. Dotted line indicates binding ratio of 1.0. Data are shown as mean ± SEM. (H) Fractions of total spike-specific and spike/RBD-specific IgG+ B cells over time, shown as percentage of total B cells. Representative gating of total spike and spike/RBD-specific B cells shown in Supplemental Figure 14. Data are shown as mean ± SEM. (I) Spike-specific CD4 T cells producing IFN-γ and/or IL-2 in response to SARS-CoV-2 spike overlapping peptide stimulation. Data shown as percentage of CD4 memory T cells. Data are shown as mean ± SEM. (J) Spike-specific CD8 T cells producing IFN-γ in response to SARS-CoV-2 spike overlapping peptide stimulation. Data are shown as percentage of CD8 memory T cells. Data are shown as mean ± SEM. Groups were compared by multiple Mann-Whitney U test with comparison between groups at each time point and P value adjustment using the Holm-Šidák method (α threshold 0.05). Number of participants analyzed: Week 0 = 30; Week 4 = 30 (AG), 28 (HJ); Week 6 = 29; Week 18 = 29; Week 30 = 23; Week 30 + 14d = 24; Week 51 = 28 (BG, I, and J), 27 (H). The x axis indicates time point.
Figure 2
Figure 2. Increased level of differential gene expression in infection-experienced participants compared with infection-naive in response to first mRNA vaccination.
(A) Volcano plots displaying differentially regulated genes in peripheral blood measured by RNA-Seq. Fold changes and P values for each sample group generated by Wald test between prevaccination (0 hours [0H]) and postvaccination samples (24H or 48H) at each vaccine dose. Total number of differentially up- or downregulated genes are indicated in each plot. Cut-off for significant differential regulation were log2(fold change) > 1, FDR-adjusted P < 0.05. (B) Heatmap displaying overlap (Jaccard index/Jaccard similarity coefficient) between differentially regulated genes compared between study groups and time point. (C) Pearson’s correlation of fold changes in individual genes identified as differentially regulated in any group. n = 15 (dose 1); 14 (dose 2); 13 (dose 3) (Supplemental Figure 4B).
Figure 3
Figure 3. Genes differentially upregulated in response to mRNA vaccination are enriched for antiviral and proinflammatory signaling pathways.
(A) Overrepresentation analysis of DEGs with log2(fold change) greater than 1 using KEGG Pathway database. (B) Overrepresentation analysis of DEGs with log2(fold change) greater than 1 using the MSigDB subset of Transcriptional Factor Targets (C3: TFT). P value cut-off for consideration of genes as differentially expressed/DEGs was FDR-adjusted P < 0.05. n = 15 (dose 1); 14 (dose 2); 13 (dose 3).
Figure 4
Figure 4. Transient type I IFN polarized transcriptional changes following mRNA vaccination.
(A) Collection of significant DEGs of immune-associated groups of receptor ligands and receptors annotated in the HUGO database (total of 157). The bubble size represents the mean of absolute fold change when significant for both groups but represents the value itself when significant for only 1 of the groups. P value cut-off for consideration of genes, as differentially expressed/DEGs was FDR-adjusted P < 0.05. (B) Gene set enrichment analysis based on fold change ranking using previously described blood transcription modules (36). Gene modules with absolute normalized enrichment score (NES) > 2 are shown. n = 15 (dose 1); 14 (dose 2); 13 (dose 3).
Figure 5
Figure 5. Transient increases in serum levels of proinflammatory cytokines following mRNA vaccination.
(A) Summary of changes in serum cytokines measured by Luminex across vaccine doses, reported log2-fold change calculated between day of vaccination and 24H or 48H after vaccination. Crossed-through boxes indicate cytokines not tested at dose 3. (BE) Detection of selected cytokines in serum before and after mRNA vaccination by Luminex bead–based multiplex assay. Shown as fold change at 24H compared with 0H at each vaccine dose. Data are shown as geometric mean ± geometric SD. The x axis labels denote vaccine dose numbers. (F) Scoring of systemic adverse events per study participant and vaccine dose. Systemic adverse events (AE) were classified by the following system: 0 = local AE < 48H; 1 = local AE > 48H; 2 = systemic < 48H; 3 = systemic > 48H. Systemic AE scores were summed for each individual and vaccine dose. Data are shown as mean ± SEM. Groups were compared by multiple Mann-Whitney U test with comparison between groups at each time point and P value adjustment using the Holm-Šidák method (α threshold 0.05). Number of study participants shown (all panels): dose 1 = 30; dose 2 = 29; dose 3 = 23.
Figure 6
Figure 6. Transient changes in distribution of immune cell populations in peripheral blood after mRNA vaccination.
(A) Representative gating of monocyte subsets in peripheral blood. (BE) Quantification of monocyte and monocyte subsets (CM, classical; IM, intermediate; NCM, nonclassical) as proportions of total gated live single cells per sample. (F) Detection of mRNA vaccine transcripts in bulk blood transcriptomic data. The vaccine mRNA sequence was sourced as reported in the repository by Jeong et al. (39) and appended to the human reference genome prior to alignment of blood RNA-Seq data. Transcripts matching the reported BNT162b2 vaccine sequence are reported as log(transcripts per million). (G) Detection of spike protein in serum before and after mRNA vaccination by Mesoscale Discovery assay. Box and whiskers indicate minimum to maximum. Gray shading indicates lower limits of detection (range of total 4 MSD plates run). Groups were compared by multiple Mann-Whitney U test with comparison between groups at each time point and P value adjustment using the Holm-Šidák method (α threshold 0.05). No statistical tests performed for F and G. Number of participants shown: dose 1 = 29, dose 2 = 28 (0H = 27), and dose 3 = 23 (0H = 19) (BE); dose 1 = 15, dose 2 = 14, and dose 3 = 13 (F); and dose 1 = 30; dose 2 = 29; dose 3 = 23 (G).
Figure 7
Figure 7. Assessment of general reactivity to TLR ligands before and after mRNA vaccination.
(A) Schematic of assay principle. (BD) Fold changes of selected cytokines (out of total 92 analytes) after stimulation with LPS (B), R848 (C), or BNT162b2 (D). Cytokine secretion was measured in culture supernatants by OLINK proximity extension assay and fold changes calculated based on unstimulated controls (cultured with R10 media only). Groups were compared by multiple Mann-Whitney U test with comparison between groups at each time point and P value adjustment using the Holm-Šidák method (α threshold 0.05). Dotted line denotes fold change 1.0 (i.e., no change). n= 10 (5 per study group).
Figure 8
Figure 8. Correlation of selected innate immune parameters and humoral immune responses to vaccination at first vaccine dose.
Correlation matrix displaying relationship between selected preexisting adaptive immune parameters measured at study start, and fold changes in innate immune parameters from study start to 24 hours after first mRNA vaccination. Nonparametric Spearman correlation. Color scale denotes Spearman R value. Correlations with P < 0.05 were considered significant. Nonsignificant correlations shown in gray. n = 14. Only SARS-CoV-2 infection–experienced study group included in analysis.

References

    1. Goel RR, et al. mRNA vaccines induce durable immune memory to SARS-CoV-2 and variants of concern. Science. 2021;374(6572):abm0829. doi: 10.1126/science.abm0829. - DOI - PMC - PubMed
    1. Lederer K, et al. SARS-CoV-2 mRNA vaccines foster potent antigen-specific germinal center responses associated with neutralizing antibody generation. Immunity. 2020;53(6):1281–1295. doi: 10.1016/j.immuni.2020.11.009. - DOI - PMC - PubMed
    1. Li C, et al. Mechanisms of innate and adaptive immunity to the Pfizer-BioNTech BNT162b2 vaccine. Nat Immunol. 2022;23(4):543–555. doi: 10.1038/s41590-022-01163-9. - DOI - PMC - PubMed
    1. Pardi N, et al. Nucleoside-modified mRNA vaccines induce potent T follicular helper and germinal center B cell responses. J Exp Med. 2018;215(6):1571–1588. doi: 10.1084/jem.20171450. - DOI - PMC - PubMed
    1. Zhang Z, et al. Humoral and cellular immune memory to four COVID-19 vaccines. Cell. 2022;185(14):2434–2451. doi: 10.1016/j.cell.2022.05.022. - DOI - PMC - PubMed

Publication types

MeSH terms