. 2024 May 31;4(5):1380-1397.
doi: 10.1158/2767-9764.CRC-24-0205.

LYVE-1-expressing Macrophages Modulate the Hyaluronan-containing Extracellular Matrix in the Mammary Stroma and Contribute to Mammary Tumor Growth

Affiliations

LYVE-1-expressing Macrophages Modulate the Hyaluronan-containing Extracellular Matrix in the Mammary Stroma and Contribute to Mammary Tumor Growth

Alexis K Elfstrum et al. Cancer Res Commun. .

Abstract

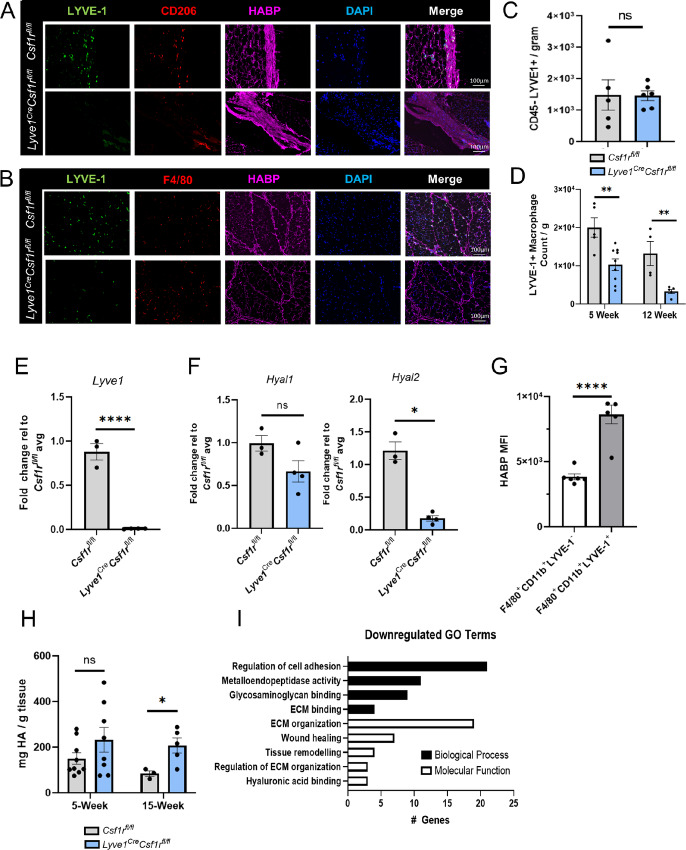
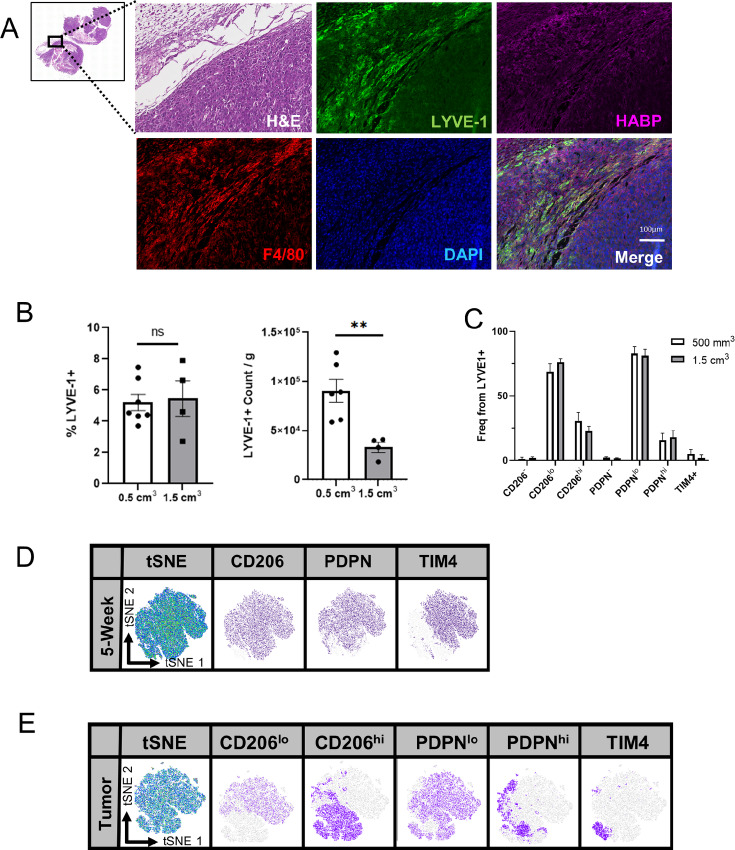
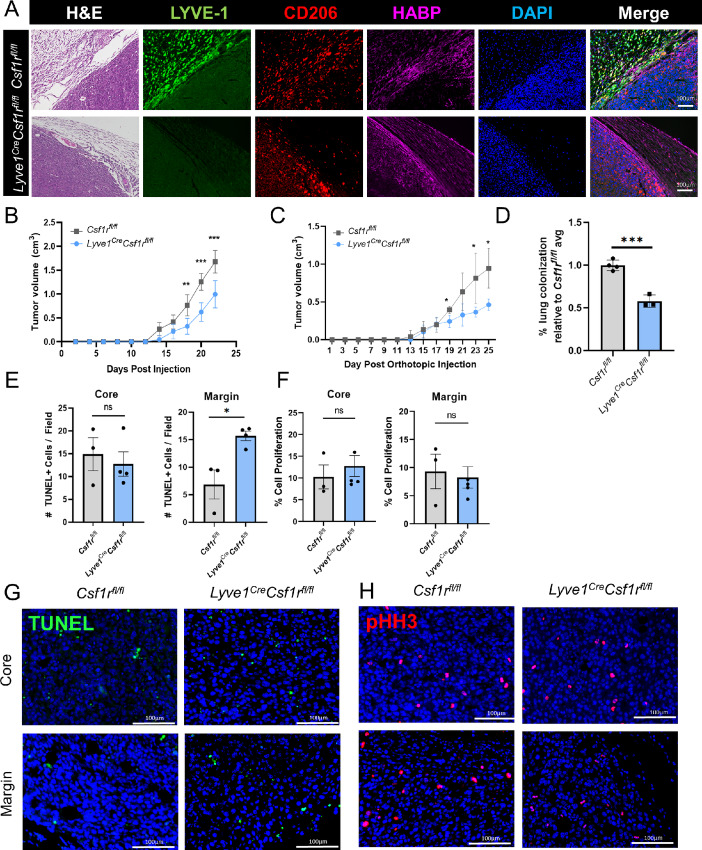
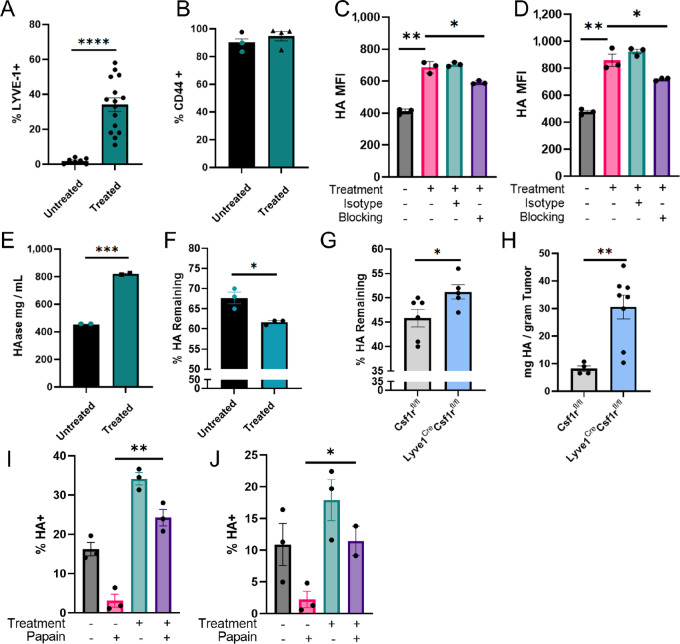
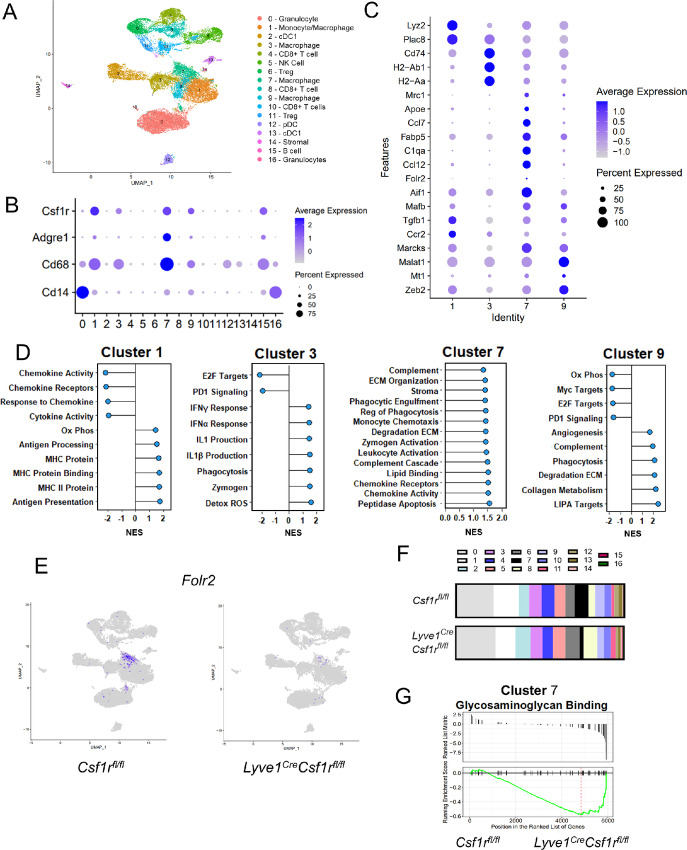
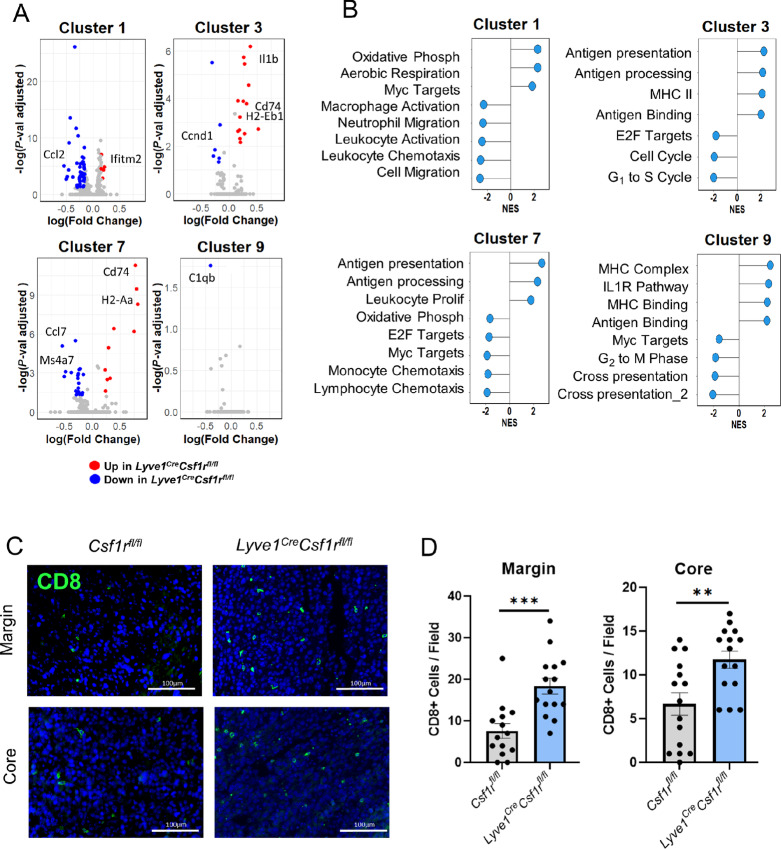
Macrophages represent a heterogeneous myeloid population with diverse functions in normal tissues and tumors. While macrophages expressing the cell surface marker lymphatic vessel endothelial hyaluronan receptor 1 (LYVE-1) have been identified in stromal regions of the normal mammary gland and in the peritumoral stroma, their functions within these regions are not well understood. Using a genetic mouse model of LYVE-1+ macrophage depletion, we demonstrate that loss of LYVE-1+ macrophages is associated with altered extracellular matrix remodeling in the normal mammary gland and reduced mammary tumor growth in vivo. In further studies focused on investigating the functions of LYVE-1+ macrophages in the tumor microenvironment, we demonstrate that LYVE-1 expression correlates with an increased ability of macrophages to bind, internalize, and degrade hyaluronan. Consistent with this, we show that depletion of LYVE-1+ macrophages correlates with increased hyaluronan accumulation in both the normal mammary gland and in mammary tumors. Analysis of single-cell RNA sequencing of macrophages isolated from these tumors reveals that depletion of LYVE-1+ macrophages in tumors drives a shift in the majority of the remaining macrophages toward a proinflammatory phenotype, as well as an increase in CD8+ T-cell infiltration. Together, these findings indicate that LYVE-1+ macrophages represent a tumor-promoting anti-inflammatory subset of macrophages that contributes to hyaluronan remodeling in the tumor microenvironment.

Significance: We have identified a macrophage subset in mouse mammary tumors associated with tumor structural components. When this macrophage subset is absent in tumors, we report a delay in tumor growth and an increase in antitumor immune cells. Understanding the functions of distinct macrophage subsets may allow for improved therapeutic strategies for patients with breast cancer.


Figures

FIGURE 1
FIGURE 1
LYVE-1+ macrophages localize near stromal HA in the nulliparous mouse mammary gland and are associated with ECM regulation. A, Representative images from mammary gland capsular regions of 5-week Csf1rfl/fl (top) and Lyve1CreCsf1rfl/fl (bottom) mice immunostained for LYVE-1 (green), CD206 (red), HABP (magenta), and DAPI (blue; n = 4 per genotype). B, Representative images from mammary gland stroma regions of 5-week Csf1rfl/fl (top) and Lyve1CreCsf1rfl/fl (bottom) mice immunostained for LYVE-1 (green), F4/80 (red), HABP (magenta), and DAPI (blue; n = 4 per genotype). C, Mammary glands from 5-week Csf1rfl/fl (gray) and Lyve1CreCsf1rfl/fl (blue) female mice were assessed for CD45LYVE-1+ frequency by flow cytometry. D, Mammary glands from 5-week Csf1rfl/fl (gray) and Lyve1CreCsf1rfl/fl (blue) female mice were assessed for CD45+F4/80+CD11b+ LYVE-1+ macrophage count by flow cytometry. Fold change of Lyve1 (E), Hyal1, and Hyal2 (F) RNA expression from 15-week Csf1rfl/fl (gray) and Lyve1CreCsf1rfl/fl (blue) female mice. G, MFI of HABP in mammary glands assessing CD45+F4/80+CD11b+LYVE-1 and CD45+F4/80+CD11b+LYVE-1+ macrophages. H, Mammary gland from 5-week and 15-week Csf1rfl/fl (gray) and Lyve1CreCsf1rfl/fl (blue) female mice assessed for HA by ELISA and normalized by weight. I, Female mammary glands assessed by ECM qRT-PCR array with differentially downregulated genes associated with biological process Gene Ontology (GO) terms (black) and molecular function GO terms (white; n = 3 per genotype). *, P < 0.05; **, P < 0.01; ****, P < 0.0001, using Student t test. Scale bars, 100 µm. Each dot represents one mouse.
FIGURE 2
FIGURE 2
Identification and localization of LYVE-1+ macrophages in mammary tumors. A, Representative images from formalin-fixed and paraffin-embedded (FFPE) sections of EO771 tumors from Csf1rfl/fl mice stained by H&E, and immunostained for LYVE-1 (green), HABP (magenta), F4/80 (red), and DAPI (blue; n = 5). CD45+F4/80+CD11b+LYVE-1+ macrophage count, CD45+F4/80+CD11b+LYVE-1+ macrophage count normalized to tumor weight (B), and frequency of CD206, PDPN, and TIM4 from CD45+F4/80+CD11b+LYVE-1+ macrophage subset in EO771 tumors from C57BL/6 mice (C). FlowJo generated tSNE plots from CD45+F4/80+CD11b+LYVE-1+ subset in 5-week female mammary glands (D), and EO771 C57BL/6 tumors (E). **, P < 0.01. Scale bars, 100 µm. Each dot represents one mouse.
FIGURE 3
FIGURE 3
Genetic depletion of LYVE-1+ macrophages delays mammary tumor growth. A, Representative images from FFPE sections of EO771 tumors from Csf1rfl/fl (top) and Lyve1CreCsf1rfl/fl (bottom) mice stained by H&E, and immunostained for LYVE-1 (green), HABP (magenta), CD206 (red), and DAPI (blue; n = 5). B, EO771 tumor growth curve from Csf1rfl/fl (gray, n = 4) and Lyve1CreCsf1rfl/fl (blue, n = 4) mice, cutoff when the first mouse reaches endpoint. C, WNT-4226-65 L tumor growth curve from Csf1rfl/fl (gray, n = 4) and Lyve1CreCsf1rfl/fl (blue, n = 4) mice, cutoff when the first mouse reaches endpoint. D, Lung colonization of EO771 tumor cells measured by H&E staining. Colonization is quantified as percent colonization per lung by area, relative to experimental Csf1rfl/fl average. Quantification of TUNEL (E) and pHH3 (F) staining of EO771 tumors from Csf1rfl/fl (gray) and Lyve1CreCsf1rfl/fl (blue) mice from the core and margin. Representative images of TUNEL (G) and pHH3 (H) staining of EO771 tumors from Csf1rfl/fl and Lyve1CreCsf1rfl/fl mice from the core and margin. *, P < 0.05; **, P < 0.01. Scale bars, 100 µm. Each dot represents one mouse.
FIGURE 4
FIGURE 4
LYVE-1 expression correlates with HA internalization. J774 macrophages untreated or treated with MCSF, IL4, dexamethasone, and EO771 conditioned media assessed for LYVE-1 expression (A) and CD44 expression (B) by flow cytometry. J774 macrophages untreated or treated with MCSF, IL4, dexamethasone, and EO771 conditioned media and pretreated with an isotype control or LYVE-1 blocking antibody followed by incubation with LMW-HA (C) or HMW-HA (D) and assessed by flow cytometry. Untreated and treated J774 macrophages assayed for hyaluronidase protein by ELISA (E) and hyaluronidase activity assay (F). G, Tumor lysates from Csf1rfl/fl and LyveCre Csf1rfl/fl mice assayed by HA Activity ELISA (n = 5). H, EO771 tumors from Csf1rfl/fl (gray) and LyveCre Csf1rfl/fl (blue) mice assessed for HA by ELISA and normalized by weight. J774 macrophages untreated or treated and incubated with LMW-HA (I) or HMW-HA (J) and assessed for HA internalization by flow cytometry. *, P < 0.05; **, P < 0.01; ***, P < 0.001; ****, P < 0.0001. Each dot represents one replicate.
FIGURE 5
FIGURE 5
scRNA-seq identifies macrophage subsets in the tumor microenvironment. A, UMAP projection of 17 distinct clusters from the total population of CD45+ cells from EO771 tumors from Csf1rfl/fl and Lyve1CreCsf1rfl/fl mice (n = 2 per genotype) with cell-specific labels. B, Dot plot of macrophage-associated genes from cells derived from Csf1rfl/fl tumors. C, Dot plot of enriched genes in macrophage clusters. D, Intercluster GSEA from Csf1rfl/fl macrophage clusters [normalized enrichment scale (NES) adjusted P-value < 0.05] with detailed gene set names in Supplementary Table S2. E, Feature plot of Folr2 from tumors from Csf1rfl/fl and Lyve1CreCsf1rfl/fl mice. F, Average cell counts per cluster from tumors from Csf1rfl/fl and Lyve1CreCsf1rfl/fl mice. G, Waterfall plots of relative enrichment in cluster 7 Lyve1CreCsf1rfl/fl relative to Csf1rfl/fl of genes associated with glycosaminoglycan binding.
FIGURE 6
FIGURE 6
Depletion of LYVE-1+ macrophages promotes a shift toward a proinflammatory environment. A, Volcano plots of four macrophage clusters with log(fold change) of Lyve1CreCsf1rfl/fl relative to Csf1rfl/fl and significance (P < 0.05) denoted as a red (upregulated) or blue (downregulated) coloration. B, Intracluster GSEA Lyve1CreCsf1rfl/fl relative to Csf1rfl/fl macrophage clusters (NES adjusted P-value < 0.05) with detailed gene set names in Supplementary Table S2. Quantification (C) and representative images (D) of EO771 tumors from Csf1rfl/fl and Lyve1CreCsf1rfl/fl mice immunostained for CD8a (green) and DAPI (blue). Each dot represents total CD8 count from one image, with five images taken per margin and five images taken per core of each tumor (n = 3). **, P < 0.01; ***, P < 0.001. Scale bars, 100 µm.

References

    1. Gordon S, Plüddemann A, Martinez Estrada F. Macrophage heterogeneity in tissues: phenotypic diversity and functions. Immunol Rev 2014;262:36–55. - PMC - PubMed
    1. Chen Y, Song Y, Du W, Gong L, Chang H, Zou Z. Tumor-associated macrophages: an accomplice in solid tumor progression. J Biomed Sci 2019;26:78. - PMC - PubMed
    1. Denning TL, Wang YC, Patel SR, Williams IR, Pulendran B. Lamina propria macrophages and dendritic cells differentially induce regulatory and interleukin 17–producing T cell responses. Nat Immunol 2007;8:1086–94. - PubMed
    1. Afik R, Zigmond E, Vugman M, Klepfish M, Shimshoni E, Pasmanik-Chor M, et al. . Tumor macrophages are pivotal constructors of tumor collagenous matrix. J Exp Med 2016;213:2315–31. - PMC - PubMed
    1. Hagemann T, Robinson SC, Schulz M, Trümper L, Balkwill FR, Binder C. Enhanced invasiveness of breast cancer cell lines upon co-cultivation with macrophages is due to TNF-α dependent up-regulation of matrix metalloproteases. Carcinogenesis 2004;25:1543–9. - PubMed

Publication types

MeSH terms