

doi: 10.1001/jamanetworkopen.2024.10441.
Adolescent Neurodevelopmental Variance Across Social Strata
Affiliations
- PMID: 38717776
- PMCID: PMC11079691
- DOI: 10.1001/jamanetworkopen.2024.10441
Item in Clipboard
Adolescent Neurodevelopmental Variance Across Social Strata
JAMA Netw Open.
.
No abstract available
Plain language summary
This cohort study explores variability in neurodevelopment across sociodemographic factors among youths.
Conflict of interest statement
Figures
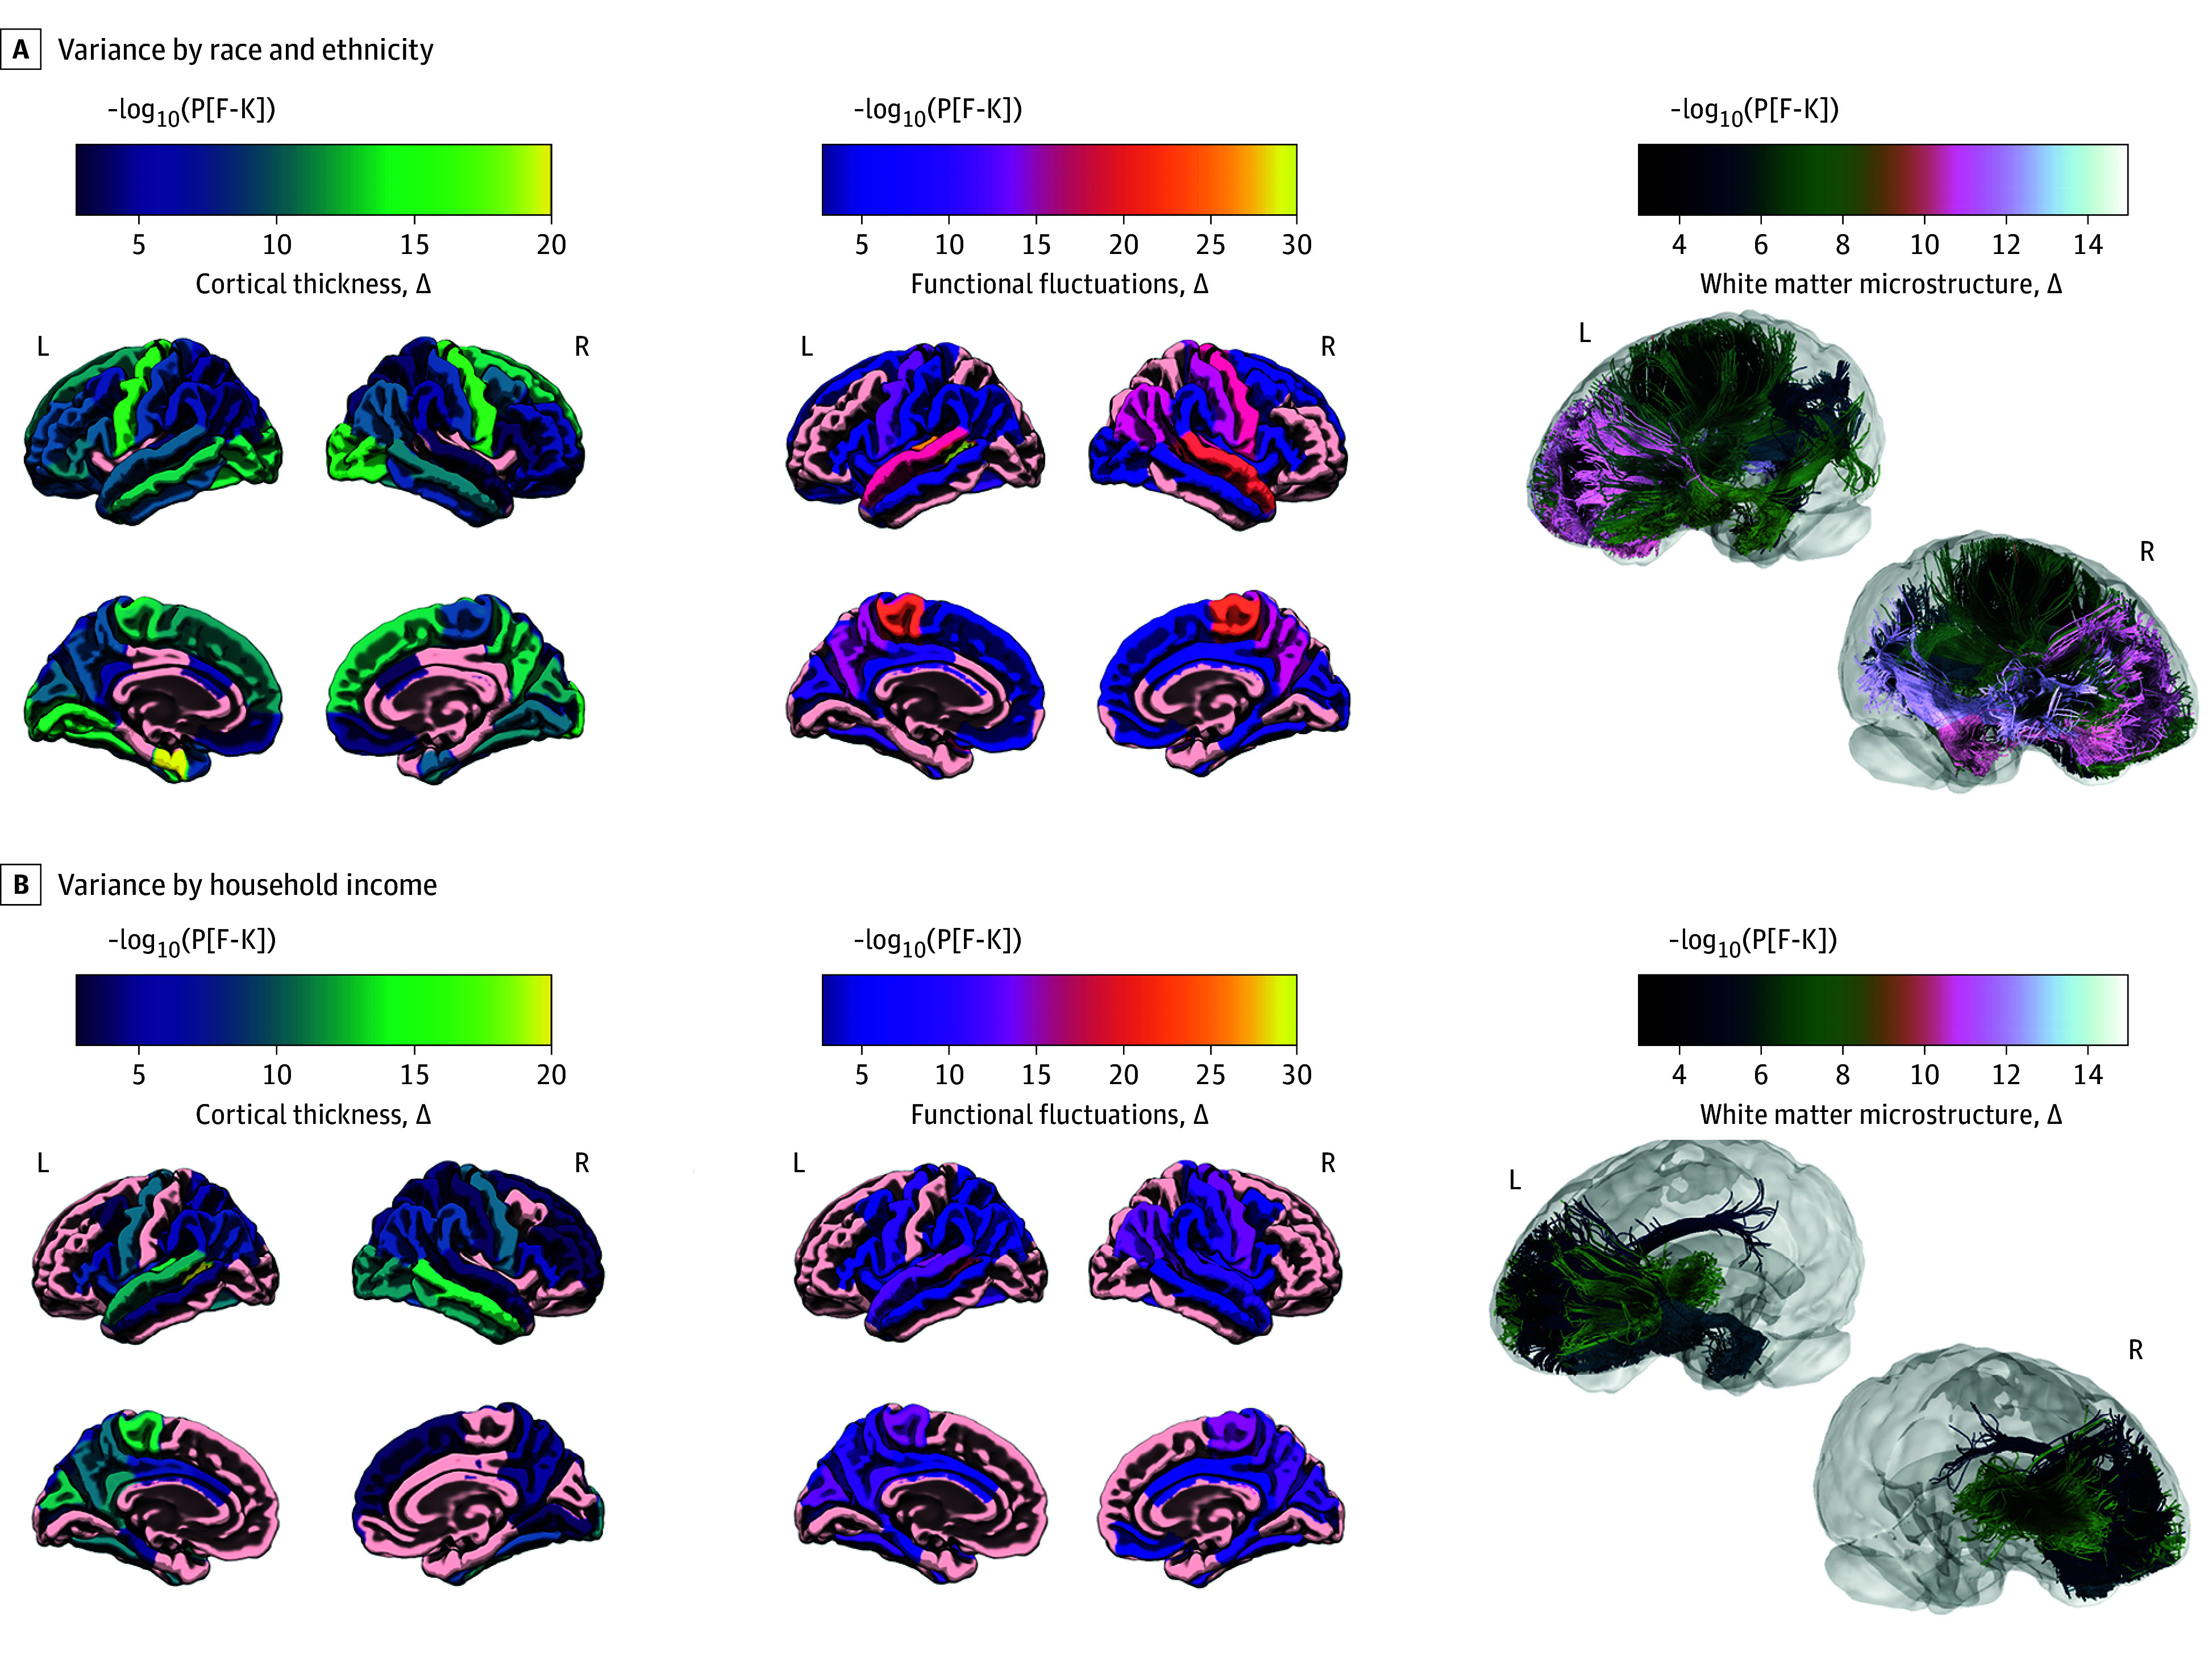
A and B, Heterogeneous neurodevelopmental variance across sociodemographic factors, including race and ethnicity (A) and household income (B), for cortical thickness (left), functional fluctuations (middle), and white matter microstructure (right). Cortical thickness is thought to reflect dendritic arborization and pruning. Functional fluctuations (middle) quantify the temporal variance of the blood oxygen level–dependent signal from functional MRI and are thought to reflect neural flexibility. White matter microstructure (right) refers to fractional anisotropy, a measure of white matter integrity that continues to mature across childhood and adolescence. Color coding indicates the negative logarithm of the F − K statistic P value, representing the degree of inhomogeneity of variance across strata, per sociodemographic variable. In the left and middle columns (ie, cortical thickness and functional fluctuations), 4 views of the brain’s surface are presented, including the left lateral (top left), right lateral (top right), left medial (bottom left), and right medial (bottom right). Because the right column presents white matter tracts inside the brain (ie, not on the cortical surface), only 2 views are presented, providing multiple angles from which to observe significantly heteroscedastic tracts. L indicates left; R, right.

A and B, Distribution of variance (x-axis) in annual rates of change, per brain region, in cortical thickness (left), functional fluctuations (middle), and white matter microstructure (ie, fractional anisotropy) (right). Distributions are color coded by strata across sociodemographic variables, including race and ethnicity (A) and household income (B). Caregiver education is not pictured. Statistically significant differences in variance (P < .01) were observed in (1) cortical thickness changes (top left) between non-Hispanic Black (hereinafter, Black) youths and both their Hispanic and non-Hispanic White (hereinafter, White) peers, (2) in functional fluctuations changes (top middle) between Black youths and their peers of each other race or ethnicity, and (3) in white matter microstructure changes (top right) between non-Hispanic Asian youths or youths of other race or ethnicity and White youths. Statistically significant differences were also observed (1) in cortical thickness (bottom left) and functional variance (bottom middle) changes between youths in households making less than $50 000 annually and households with incomes greater than $50 000 and (2) in white matter microstructure changes (bottom right) in youths in households making less than $50 000 annually and those in households with incomes greater than $100 000.
References
Publication types
MeSH terms
Grants and funding
- R25 NS089462/NS/NINDS NIH HHS/United States
- R25 NS094094/NS/NINDS NIH HHS/United States
- U01 DA041174/DA/NIDA NIH HHS/United States
- R25 MH125545/MH/NIMH NIH HHS/United States
- U01 DA041093/DA/NIDA NIH HHS/United States
- U01 DA041106/DA/NIDA NIH HHS/United States
- R25 MH120869/MH/NIMH NIH HHS/United States
- U01 DA050989/DA/NIDA NIH HHS/United States
- U01 DA041089/DA/NIDA NIH HHS/United States
- R01 ES031074/ES/NIEHS NIH HHS/United States
- U01 DA041134/DA/NIDA NIH HHS/United States
- U01 DA050987/DA/NIDA NIH HHS/United States
- U24 DA041147/DA/NIDA NIH HHS/United States
- P30 ES007048/ES/NIEHS NIH HHS/United States
- U01 DA041022/DA/NIDA NIH HHS/United States
- U01 DA041025/DA/NIDA NIH HHS/United States
- U01 DA051037/DA/NIDA NIH HHS/United States
- U01 DA051016/DA/NIDA NIH HHS/United States
- U01 DA041156/DA/NIDA NIH HHS/United States
- U01 DA041148/DA/NIDA NIH HHS/United States
- U24 DA041123/DA/NIDA NIH HHS/United States
- U01 DA041120/DA/NIDA NIH HHS/United States
- U01 DA051039/DA/NIDA NIH HHS/United States
- U01 DA050988/DA/NIDA NIH HHS/United States
- U01 DA041048/DA/NIDA NIH HHS/United States
- U01 DA041028/DA/NIDA NIH HHS/United States
- R25 NS117356/NS/NINDS NIH HHS/United States
- U01 DA041117/DA/NIDA NIH HHS/United States
- U01 DA051018/DA/NIDA NIH HHS/United States
- U01 DA051038/DA/NIDA NIH HHS/United States
LinkOut - more resources
Full Text Sources
Medical
