Estimation of cause-specific mortality in Rakai, Uganda, using verbal autopsy 1999-2019
- PMID: 38717826
- PMCID: PMC11080674
- DOI: 10.1080/16549716.2024.2338635
Estimation of cause-specific mortality in Rakai, Uganda, using verbal autopsy 1999-2019
Abstract
Background: There are scant data on the causes of adult deaths in sub-Saharan Africa. We estimated the level and trends in adult mortality, overall and by different causes, in rural Rakai, Uganda, by age, sex, and HIV status.
Objectives: To estimate and analyse adult cause-specific mortality trends in Rakai, Uganda.
Methodology: Mortality information by cause, age, sex, and HIV status was recorded in the Rakai Community Cohort study using verbal autopsy interviews, HIV serosurveys, and residency data. We estimated the average number of years lived in adulthood. Using demographic decomposition methods, we estimated the contribution of each cause of death to adult mortality based on the average number of years lived in adulthood.
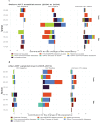
Results: Between 1999 and 2019, 63082 adults (15-60 years) were censused, with 1670 deaths registered. Of these, 1656 (99.2%) had completed cause of death data from verbal autopsy. The crude adult death rate was 5.60 (95% confidence interval (CI): 5.33-5.87) per 1000 person-years of observation (pyo). The crude death rate decreased from 11.41 (95% CI: 10.61-12.28) to 3.27 (95% CI: 2.89-3.68) per 1000 pyo between 1999-2004 and 2015-2019. The average number of years lived in adulthood increased in people living with HIV and decreased in HIV-negative individuals between 2000 and 2019. Communicable diseases, primarily HIV and Malaria, had the biggest decreases, which improved the average number of years lived by approximately extra 12 years of life in females and 6 years in males. There were increases in deaths due to non-communicable diseases and external causes, which reduced the average number of years lived in adulthood by 2.0 years and 1.5 years in females and males, respectively.
Conclusion: There has been a significant decline in overall mortality from 1999 to 2019, with the greatest decline seen in people living with HIV since the availability of antiretroviral therapy in 2004. By 2020, the predominant causes of death among females were non-communicable diseases, with external causes of death dominating in males.
Keywords: Uganda; Verbal autopsy; adult mortality; cause of death; health and demographic surveillance sites.
Plain language summary
Main findings: There are significant declines in mortality in people living with HIV. However, mortality in HIV-negative people increased due to non-communicable diseases in females, and injuries and external causes of death among males.Added knowledge: In this HIV-endemic area, decreasing adult mortality has been documented over the last 20 years. This paper benchmarks the changes in cause-specific mortality in this area.Global health impact for policy action: As in many African countries, more effort is needed to reduce mortality for non-communicable diseases, injuries, and external causes of death as these seem to have been neglected.
Conflict of interest statement
No potential conflict of interest was reported by the author(s).
Figures


References
-
- Bradshaw D, Timaeus IM.. Levels and trends of adult mortality. In: Jamison DT, Feachem RG, Makgoba MW, editors. Disease and Mortality in Sub-Saharan Africa. 2nd ed. Washington (DC): The International Bank for Reconstruction and Development/The World Bank; 2006. [Chapter 4. Available from: https://www.ncbi.nlm.nih.gov/books/NBK2297/] - PubMed
-
- Dicker D, Nguyen G, Abate D, Abate KH, Abay SM, Abbafati C, et al. Global, regional, and national age-sex-specific mortality and life expectancy, 1950–2017: a systematic analysis for the global burden of disease study 2017. Lancet. 2018;392:1684–10. doi: 10.1016/S0140-6736(18)31891-9 - DOI - PMC - PubMed
Publication types
MeSH terms
Grants and funding
LinkOut - more resources
Full Text Sources
Medical
Research Materials
