. 2024 May 8;22(5):e3002596.
doi: 10.1371/journal.pbio.3002596. eCollection 2024 May.

Loss of Katnal2 leads to ependymal ciliary hyperfunction and autism-related phenotypes in mice

Affiliations

Loss of Katnal2 leads to ependymal ciliary hyperfunction and autism-related phenotypes in mice

Ryeonghwa Kang et al. PLoS Biol. .

Abstract

Autism spectrum disorders (ASD) frequently accompany macrocephaly, which often involves hydrocephalic enlargement of brain ventricles. Katnal2 is a microtubule-regulatory protein strongly linked to ASD, but it remains unclear whether Katnal2 knockout (KO) in mice leads to microtubule- and ASD-related molecular, synaptic, brain, and behavioral phenotypes. We found that Katnal2-KO mice display ASD-like social communication deficits and age-dependent progressive ventricular enlargements. The latter involves increased length and beating frequency of motile cilia on ependymal cells lining ventricles. Katnal2-KO hippocampal neurons surrounded by enlarged lateral ventricles show progressive synaptic deficits that correlate with ASD-like transcriptomic changes involving synaptic gene down-regulation. Importantly, early postnatal Katnal2 re-expression prevents ciliary, ventricular, and behavioral phenotypes in Katnal2-KO adults, suggesting a causal relationship and a potential treatment. Therefore, Katnal2 negatively regulates ependymal ciliary function and its deletion in mice leads to ependymal ciliary hyperfunction and hydrocephalus accompanying ASD-related behavioral, synaptic, and transcriptomic changes.


Conflict of interest statement

The authors have declared that no competing interests exist.

Figures
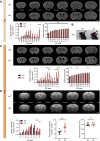
Fig 1
Fig 1. Age-dependent progressive ventricular enlargements in Katnal2-KO mice.
(A–C) Increased areas of lateral ventricles in Katnal2-KO mice at P28 and P70, as shown by area measurements derived from coronal brain slices. Note that brain areas are moderately increased at P70 but not at P28. The image in (B) shows an example of the visually detectable abnormalities in the external regions of the head in some (<10%) mice (P28), likely reflecting severe hydrocephalus. AP axis, anterior-posterior axis. Scale bar, 2 mm. (n = 3 mice [WT-P28], 3 [KO-P28]; 3 [WT-P70], 3 [KO-P70], two-way RM-ANOVA with Sidak’s test). (D) Increased volumes of lateral ventricles with unaltered intracranial volumes (total brain volume encompassing ventricular + non-ventricular brain regional volumes) in Katnal2-KO mice (3 months), as shown by MRI volumetric analyses. Scale bar, 2 mm. (n = 8 mice [WT-intracranial volume], 6 [KO-intracranial volume], Student’s t test; n = 10 mice [WT-lateral ventricle volume], 9 [KO-lateral ventricle volume], two-way RM-ANOVA with Sidak’s test). Data values represent means ± SEM. Significance is indicated as * (<0.05), ** (<0.01), *** (<0.001), or ns (not significant). Statistical results and numerical data values can be found in S1 Data. KO, knockout; MRI, magnetic resonance imaging; WT, wild type.
Fig 2
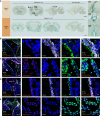
Fig 2. Katnal2 localization in ventricular ependymal cells.
(A) Distribution patterns of Katnal2 proteins in ventricle-related structures (ventricles [arrowheads] and choroid plexus [the bottom structure in enlarged inset a2]) in the mouse brain, as revealed by X-gal staining of Katnal2-β-galactosidase fusion proteins expressed in Katnal2-KO mice with the β-geo cassette left intact (P21 and P56). Note that Katnal2 is additionally detected in cortical layers at P56 but not at P21. Enlarged insets: a1, lateral ventricle; a2, dorsal third ventricle; a3, ventral third ventricle. See also S5 Fig for additional images. Scale bar, 1 mm. (B–E) Localizations of Katnal2 mRNAs in the ependymal cells and choroid plexus in the lateral ventricles (b, c; LV) and dorsal third ventricles (d, e; D3V) of WT mice (P56), as shown by combined fluorescence in situ hybridization for Katnal2 mRNAs and immunofluorescence staining for S100 (ependymal cell marker), acetylated β-tubulin (cilia marker; Ac-tub), and FoxJ1 (choroid plexus marker). Scale bar, 100 μm (left) and 10 μm (magnified images, right). KO, knockout; WT, wild type.
Fig 3
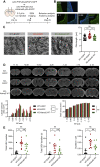
Fig 3. Lengthened ependymal cilia and increased ciliary beating function and frequency in the Katnal2-KO brain.
(A and B) Increased length of ependymal motile cilia in Katnal2-KO mice (P28–33), as determined from SEM images of lateral ventricular walls. (n = 42 cilia from 6 images from 6 mice [WT], 77, 11, 11 [KO], Mann–Whitney test). (C–H) Enhanced ependymal ciliary function in Katnal2-KO mice (P31–40), as shown by bead flow assays using the ependymal tissue of lateral ventricular walls. (C) Schematic diagram showing the movement of fluorescent beads on live lateral ventricular walls. The bead flow follows the anterior-dorsal (AD), anterior-ventral (AC), or posterior-medial (PM) direction around the adhesion area. (D and F) High-speed video imaging analysis of each fluorescent bead at different time points. The movement of each bead was marked by arrowheads. Five consecutive frames taken by 200 msec intervals were merged into a single image. Scale bar, 200 μm. (E and G) Quantification of the speed of microbeads. (n = 60 beads from 4 mice [WT-AD], 39, 4 [WT-AV], 62, 4 [KO-AD], 33, 4 [KO-AV], 116, 4 [WT-PM], and 82, 4 [KO-PM], Student’s t-test [AV bead speed], Mann-Whitney test [AD bead speed, PM bead speed]). (H) A decreased speed of microbeads in AD + AV regions after a 10-min pretreatment of brain slices with pneumolysin (PNML; 0.5 μg/ml) (n = 40 beads from 3 mice for pneumolysin and control [without pneumolysin] groups, Mann–Whitney test). (I) Increased ciliary beating frequency in lateral ventricles of Katnal2-KO mice (P28–42), as measured by high-speed (approximately 1,000 frames/sec) time-lapse imaging and quantification of the beating frequency. Scale bar, 10 μm. (n = 1,442 ROIs from 67 cilia videos from 10 mice [WT-lateral], 1,346, 72, 9 [KO-lateral], Permutation test). (J) A working hypothesis suggesting that increased ependymal ciliary length and beating frequency would enhance CSF propulsion. The big arrow indicates the overall propulsion power of the cilia, and the small arrows indicate the forward directions of each ciliary movement. The additional cilium in the Katnal2-KO mice indicates increased beating frequency. (K) Increased CSF flow rates in the cerebral aqueduct of Katnal2-KO mice (P28–42), as measured by MRI. (n = 6 mice [WT], 5 [KO], Student’s t test). (L) Comparable ICPs in WT and Katnal2-KO mice (3 months). (n = 9 mice [WT], 6 [KO], Student’s t test). Data values represent means ± SEM. Significance is indicated as * (<0.05), ** (<0.01), *** (<0.001), or ns (not significant). Statistical results and numerical data values can be found in S1 Data. CSF, cerebrospinal fluid; ICP, intracranial pressure; KO, knockout; MRI, magnetic resonance imaging; WT, wild type.
Fig 4
Fig 4. Progressive synaptic deficits in the Katnal2-KO hippocampus.
(A–D) Decreased CBVs in various brain regions of Katnal2-KO mice, including the hippocampus surrounded by lateral ventricles, as compared with WT mice (3 months). CBV-weighted MRI measurements were performed with nitrogen stimuli in WT and Katnal2-KO mouse brains, and the relative CBV index was computed by the integration of the area under the curve (A). Note that the color-coded decreases in CBVs in Katnal2-KO mice occur in various brain regions (B, left and middle), although it seems to be greater in the mutant hippocampus (B, right). The results of the quantification of relative CBV indices are shown in (C) and (D) for the hippocampus and whole brain and in S7A Fig for various cortical and subcortical regions. (n = 8 mice [WT], 6 [KO], Student’s t test). (E) Normal TBS-LTP at Katnal2-KO hippocampal SC-CA1 synapses (P26–33; last 5 min). (n = 7 slices from 3 mice [WT], 9, 3 [KO], Student’s t test [last 5 min]). (F) Normal basal transmission at Katnal2-KO SC-CA1 synapses (P25-30), as measured by input-output curves. (n = 7, 3 [WT], 8, 4 [KO], two-way RM-ANOVA). (G) Normal paired pulse facilitation at Katnal2-KO SC-CA1 synapses (P25-30). (n = 9, 4 [WT], 10, 4 [KO], two-way RM-ANOVA). (H) Normal ratios of NMDAR- and AMPAR-mediated EPSCs (NMDA/AMPA ratios) at Katnal2-KO SC-CA1 synapses (P20-21). (n = 9 neurons from 4 mice [WT], 11, 4 [KO], Student’s t test). (I) Normal neuronal excitability in Katnal2-KO CA1 pyramidal neurons (P26–30), as measured by input-firing curves. (n = 20, 3 [WT], 14, 3 [KO], two-way RM-ANOVA). (J) Suppressed TBS-LTP at Katnal2-KO SC-CA1 synapses (P56–70). (n = 9, 4 [WT], 7, 3 [KO], Student’s t test). (K) Normal input-output ratio at Katnal2-KO SC-CA1 synapses (P56–70). (n = 9, 3 [WT], 9, 4 [KO], two-way RM-ANOVA). (L) Suppressed paired pulse facilitation at Katnal2-KO SC-CA1 synapses (P56–70). (n = 10, 4 [WT], 10, 4 [KO], two-way RM-ANOVA with Sidak’s test). (M) Normal NMDA/AMPA ratios at Katnal2-KO SC-CA1 synapses (P56–70). (n = 13, 5 [WT], 9, 5 [KO], Mann–Whitney test [NMDA/AMPA ratio], Student’s t test [decay tau]). (N) Moderately increased excitability of Katnal2-KO CA1 pyramidal neurons (P56–70). (n = 15, 4 [WT], 15, 4 [KO], two-way RM-ANOVA with Sidak’s test). Data values represent means ± SEM. Significance is indicated as * (<0.05), ** (<0.01), *** (<0.001), or ns (not significant). Statistical results and numerical data values can be found in S1 Data. CBV, cerebral blood volume; EPSC, excitatory postsynaptic current; KO, knockout; MRI, magnetic resonance imaging; WT, wild type.
Fig 5
Fig 5. Progressive synaptic and ASD-related transcriptomic changes in Katnal2-KO mice.
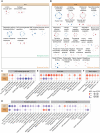
(A and B) GSEA results revealing the enrichment of P21- and P70-Katnal2/WT transcripts (whole brains) for biological functions, as shown by the list of top-five positively (red) and negatively (blue) enriched gene sets in the CC domain (left) and the clusters of enriched gene sets visualized using EnrichmentMap Cytoscape App (right). (C) GSEA results assessing Katnal2/WT transcripts for ASD-related gene sets that are up-regulated in ASD (DEG_Up and Co-Exp_Up), down-regulated in ASD (DEG_Down and Co-Exp_Down), and ASD-risk gene sets that are usually down-regulated in ASD (SFARI [all], SFARI [high-confidence], FMRP target, DeNovoMiss, and DeNovoVariants, but not ASD_AutismKB). (n = 5 mice for WT and KO, FDR < 0.05). (D) GSEA results assessing Katnal2/WT transcripts for neuron type-specific gene sets (excitatory and inhibitory neuronal) that are usually down-regulated in ASD. (n = 5 mice for WT and KO, FDR < 0.05). (E) GSEA results assessing Katnal2/WT transcripts for glial cell type-specific gene sets that are usually down-regulated in oligodendrocytes and up-regulated in astrocytes and microglia in ASD. (n = 5 mice for WT and KO, FDR < 0.05). (F) GSEA results assessing Katnal2/WT transcripts for brain region-related gene sets. (n = 5 mice for WT and KO, FDR < 0.05). Raw RNA-Seq data and detailed GSEA results can be found in S2 Data and S4 Data. ASD, autism spectrum disorder; CC, cellular component; DEG, differentially expressed gene; FDR, false discovery rate; GSEA, gene set enrichment analysis; KO, knockout; WT, wild type.
Fig 6
Fig 6. Early Katnal2 gene re-expression prevents ciliary, ventricular, and behavioral phenotypes in adult Katnal2-KO mice.
(A) Schematic diagram of Katnal2 re-expression experiments in which PHP.eB.AAV-pCAG-Katnal2-p2A-EGFP, or control virus (PHP.eB.AAV-pGFAP-EGFP; pGFAP for ependymal cell expression), was bilaterally injected into the lateral ventricles (intracerebroventricular/icv injection) of WT or Katnal2-KO mice at approximately P8–12, and the effects on ventricles and behaviors were determined at adult stages (approximately P56–70). (B) Examples of Katnal2 re-expression (marked by EGFP) in the lateral ventricles of Katnal2-KO brain (P56). The numbers above brain images indicate anterior-posterior positions. Scale bar, 200 μm. (C) Prevention of ependymal ciliary lengthening in the Katnal2-KO brain (P28–32) by early postnatal Katnal2 re-expression (P8–12), as compared with control conditions (Katnal2-KO-EGFP alone and WT-EGFP alone). (n = 160 cilia from 16 images from 4 mice [WT-EGFP alone/control], 120, 12, 3 [KO-EGFP alone], and 120, 12, 3 [KO-rescue/Katnal2 re-expression], one-way ANOVA with Sidak’s test). Scale bar, 10 μm. (D) Prevention of ventricular enlargement in the Katnal2-KO brain (P56–70) by early postnatal Katnal2 re-expression (P8–12), as compared with control conditions (Katnal2-KO-EGFP alone and WT-EGFP alone). Note that the brain areas are minimally affected by the treatments. (n = 22 mice [WT-EGFP alone/control], 8 [KO-rescue/Katnal2 re-expression], and 20 [KO-EGFP alone], two-way RM-ANOVA with Sidak’s test). Scale bar, 2 mm. (E) Partial prevention of excessive courtship USVs in Katnal2-KO mice (P56–70) by early postnatal Katnal2 re-expression (P8–12), as compared with control conditions (Katnal2-KO-EGFP alone [not significant] and WT-EGFP alone [not significant, meaning rescued]). (n = 8 [WT-EGFP alone], 10 [KO-EGFP alone], and 8 [KO-rescue], one-way ANOVA with Sidak’s test). Data values represent means ± SEM. Significance is indicated as * (<0.05), ** (<0.01), *** (<0.001), or ns (not significant). Statistical results and numerical data values can be found in S1 Data. KO, knockout; USV, ultrasonic vocalization; WT, wild type.

References

    1. Williams CA, Dagli A, Battaglia A. Genetic disorders associated with macrocephaly. Am J Med Genet A. 2008;146A(15):2023–37. Epub 2008/07/17. doi: 10.1002/ajmg.a.32434 . - DOI - PubMed
    1. Lainhart JE, Piven J, Wzorek M, Landa R, Santangelo SL, Coon H, et al.. Macrocephaly in children and adults with autism. J Am Acad Child Adolesc Psychiatry. 1997;36(2):282–290. doi: 10.1097/00004583-199702000-00019 . - DOI - PubMed
    1. Pan PY, Bolte S, Kaur P, Jamil S, Jonsson U. Neurological disorders in autism: A systematic review and meta-analysis. Autism. 2020:1362361320951370. Epub 2020/09/11. doi: 10.1177/1362361320951370 . - DOI - PubMed
    1. Shen MD, Nordahl CW, Li DD, Lee A, Angkustsiri K, Emerson RW, et al.. Extra-axial cerebrospinal fluid in high-risk and normal-risk children with autism aged 2–4 years: a case-control study. Lancet Psychiatry. 2018;5(11):895–904. Epub 20180927. doi: 10.1016/S2215-0366(18)30294-3 ; PubMed Central PMCID: PMC6223655. - DOI - PMC - PubMed
    1. Tully HM, Dobyns WB. Infantile hydrocephalus: a review of epidemiology, classification and causes. Eur J Med Genet. 2014;57(8):359–68. Epub 2014/06/17. doi: 10.1016/j.ejmg.2014.06.002 ; PubMed Central PMCID: PMC4334358. - DOI - PMC - PubMed

MeSH terms