. 2024 May 10;10(19):eadi9156.
doi: 10.1126/sciadv.adi9156. Epub 2024 May 8.

Endocytosis blocks the vesicular secretion of exosome marker proteins

Affiliations

Endocytosis blocks the vesicular secretion of exosome marker proteins

Yiwei Ai et al. Sci Adv. .

Abstract

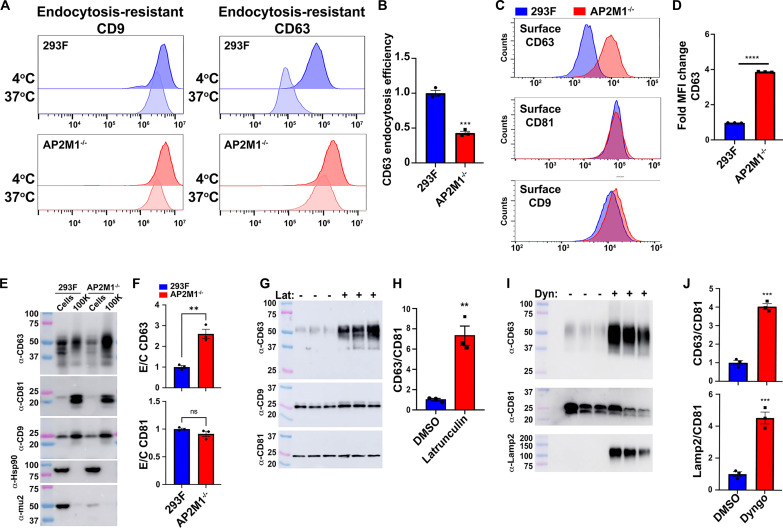
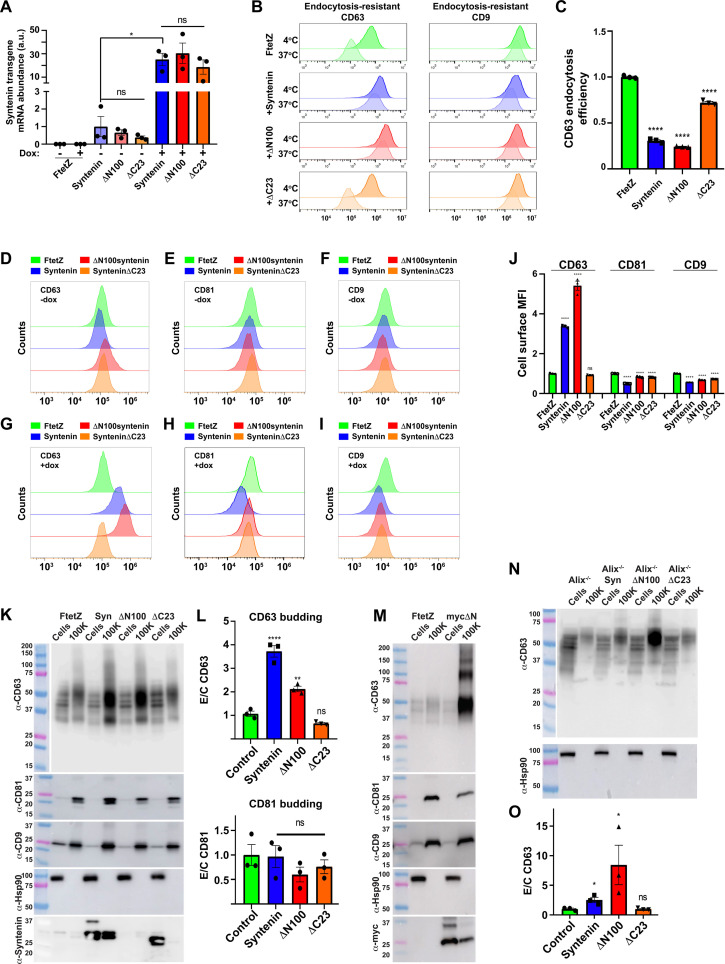
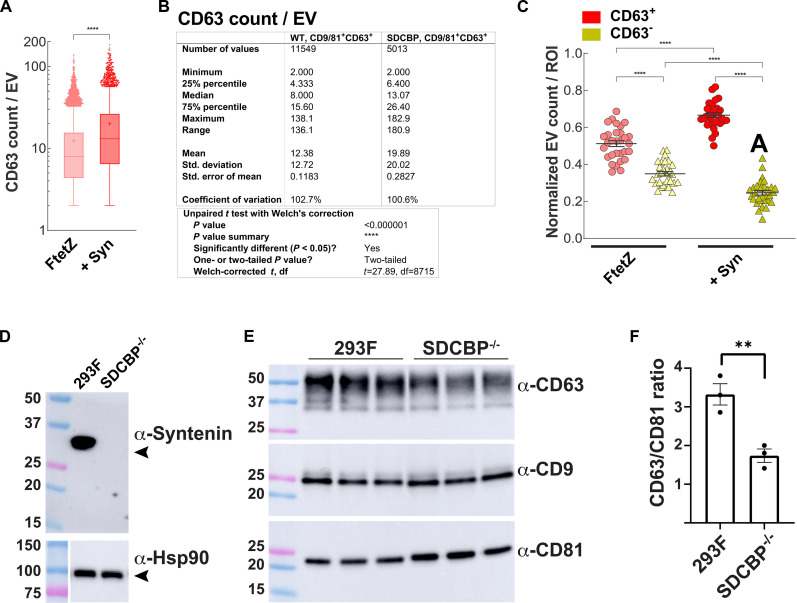
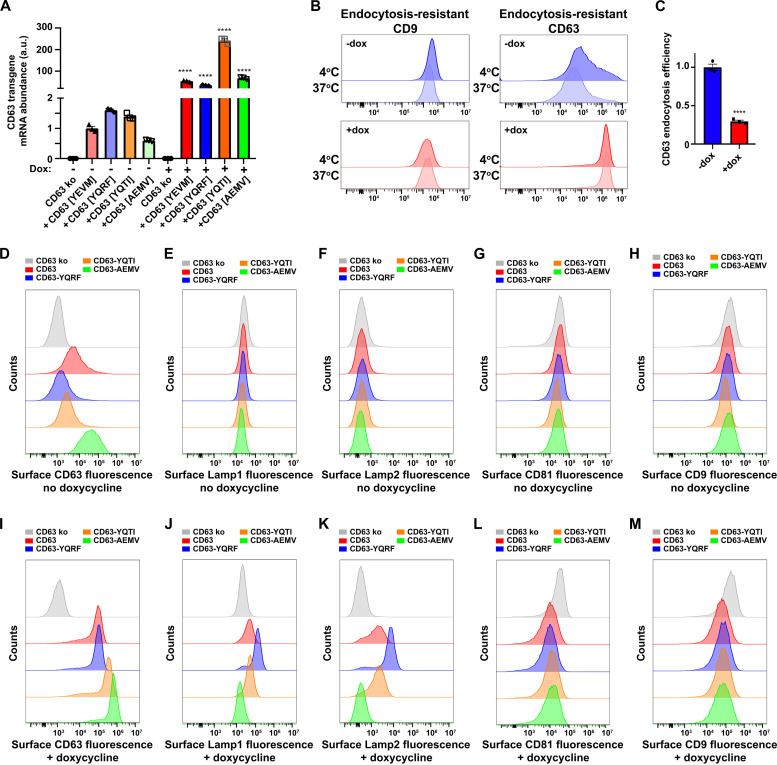
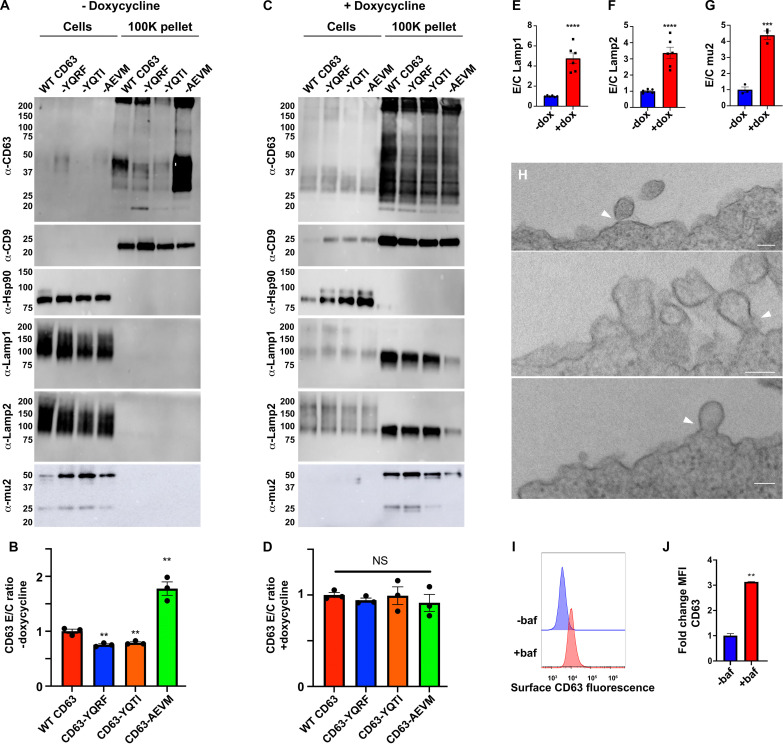
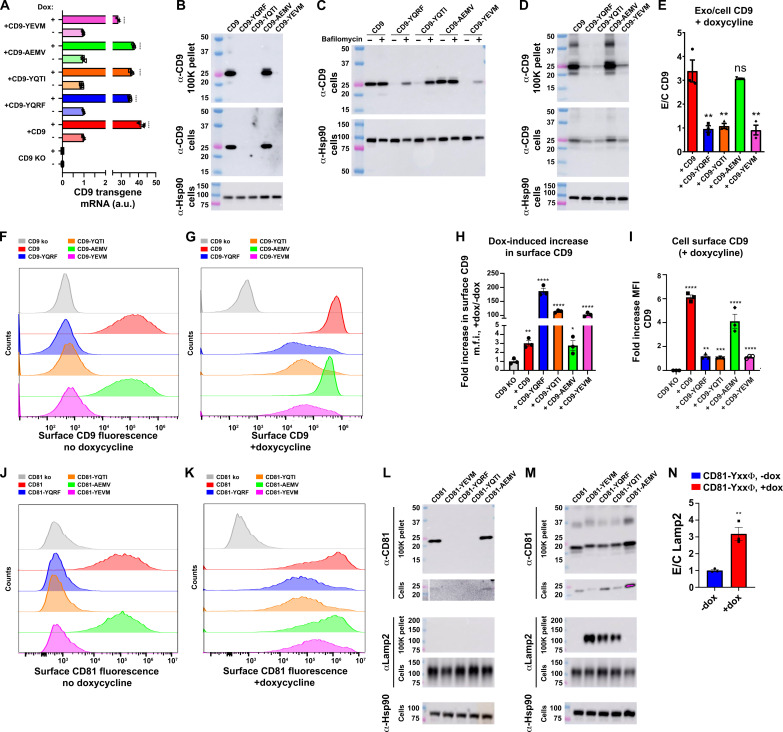
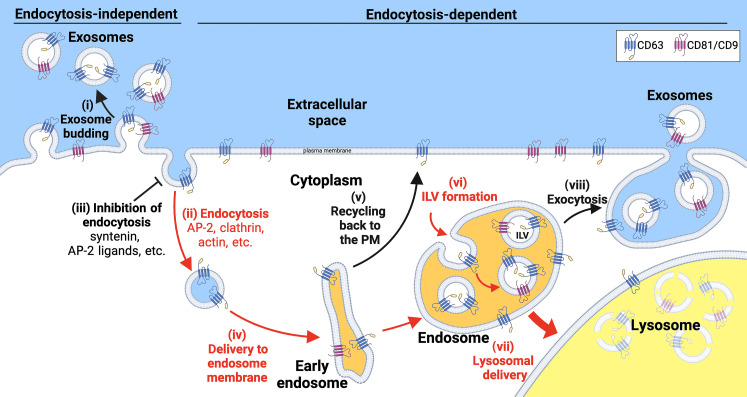
Exosomes are secreted vesicles of ~30 to 150 nm diameter that play important roles in human health and disease. To better understand how cells release these vesicles, we examined the biogenesis of the most highly enriched human exosome marker proteins, the exosomal tetraspanins CD81, CD9, and CD63. We show here that endocytosis inhibits their vesicular secretion and, in the case of CD9 and CD81, triggers their destruction. Furthermore, we show that syntenin, a previously described exosome biogenesis factor, drives the vesicular secretion of CD63 by blocking CD63 endocytosis and that other endocytosis inhibitors also induce the plasma membrane accumulation and vesicular secretion of CD63. Finally, we show that CD63 is an expression-dependent inhibitor of endocytosis that triggers the vesicular secretion of lysosomal proteins and the clathrin adaptor AP-2 mu2. These results suggest that the vesicular secretion of exosome marker proteins in exosome-sized vesicles occurs primarily by an endocytosis-independent pathway.


Figures

Fig. 1.
Fig. 1.. Inhibiting endocytosis induces a selective increase in the vesicular secretion of CD63.
(A) Flow cytometry histograms showing the fluorescence staining intensity for surface-exposed anti-CD63 and anti-CD9 mAbs following 30-min-long incubations at 4°C versus 37°C for (blue) 293F cells and (red) AP2M1−/− cells. (B) Bar graph of the CD63 EE in 293F and AP2M1−/− cells. Bar heights represent the mean, error bars show the SEM, and *** denotes a P value of <0.001. (C) Flow cytometry histograms display the levels of fluorescence brightness of (blue) 293F cells and (red) AP2M1−/− cells stained with fluorescently tagged antibodies specific for CD63, CD81, and CD9. (D) Bar graph showing the mean fluorescence intensities (MFI) of surface-stained CD63, with **** denoting a P value of <0.0001. (E) Immunoblots of cell and exosome-containing samples collected from 293F and AP2M1−/− cells. (F) Bar graph showing the mean secretion efficiency (amount in exosome-sized vesicles/amount in cells) for CD63 and CD81 in 293F and 293F/AP2M1−/− cells, with ** denoting a P value of <0.01. (G) Immunoblots of exosome-containing samples produced by 293F cells cultured in medium lacking or containing latrunculin A. (H) Bar graph showing the CD63/CD81 ratio in these exosome-containing samples, with ** denoting a value of 0.0028. (I) Immunoblots of exosome-containing fractions collected from 293F cells cultured in medium lacking or containing the dynamin inhibitor dyngo-4a. (J) Bar graphs showing the ratios of CD63/CD81 and Lamp2/CD81 in exosome-containing fractions, ± dyngo-4a, with *** denoting a P value of <0.001. Experiments were performed a minimum of three times.
Fig. 2.
Fig. 2.. Syntenin drives the vesicular secretion of CD63 by blocking CD63 endocytosis.
(A) Bar graph of transgene-encoded syntenin mRNA levels in Tet-on 293F (FtetZ) cells and FtetZ cells carrying the TRE3G-regulated transgenes encoding syntenin (syntenin), ΔN100syntenin (ΔN100), or synteninΔC23 (ΔC23), grown ± dox (a.u., arbitrary units), with * denoting a P value of <0.05. (B) Flow cytometry histograms showing the fluorescence staining intensity for surface-exposed anti-CD63 and anti-CD9 mAbs following 30-min-long incubations at 4°C versus 37°C for dox-induced (green) control cells, (blue) syntenin-expressing cells, (red) ΔN100syntenin-expressing cells, or (orange) synteninΔC23-expressing cells. (C) Bar graph showing the EEs of CD63 in these cells, with **** denoting a P value of <0.0001. (D to I) Flow cytometry histograms of the same four cell lines, grown in the [(D) to (F)] absence of dox or [(G) to (I)] presence of dox, stained for surface-exposed [(D) and (G)] CD63, [(E) and (H)] CD81, or [(F) and (I)] CD9. (J) Bar graph of MFIs for these plasma membrane fluorescence brightness data, with **** denoting a P value of <0.0001. (K) Immunoblots of cells and exosome-containing fractions collected from dox-induced (FtetZ) control cells, (Syn) syntenin-expressing cells, (ΔN100) ΔN100syntenin-expressing cells, or (ΔC23) synteninΔC23-expressing cells. (L) Bar graphs showing the efficiency with which CD63 and CD81 were loaded into exosome-sized vesicles (E/C ratio) for, with ** and **** denoting P values of <0.01 and 0.0001, respectively. (M) Immunoblots of cell and exosome lysates collected from dox-induced FtetZ cells and FtetZ cells expressing mycΔN100syntenin (mycΔN). (N) Immunoblots of cell lysates and exosome-containing fractions of dox-induced Tet-on Alix−/− control cells and Alix−/− cells expressing syntenin (Syn), ΔN100syntenin (ΔN100), or synteninΔC23 (ΔC23). (O) Bar graph showing the vesicular secretion efficiency (E/C ratio) of CD63, with * denoting a Student’s t test P value of <0.05. All experiments were performed a minimum of three times.
Fig. 3.
Fig. 3.. Syntenin drives CD63 into CD81/CD9-positive exosome-sized vesicles.
(A) Box and whisker plot showing the number of CD63 molecules detected on CD81/CD9-positive exosome-sized vesicles, as determined by qSMLM, from vesicles released by (WT) FtetZ cells and (SDCBP) FtetZ cells expressing high levels of syntenin. Note that the vesicle-to-vesicle variation spans two orders of magnitude in both samples. **** denotes P value of <0.000001from an unpaired t test with Welch’s correction. Data are from three independent trials. (B) Table of data from the same experiment as shown in (A). (C) Plot showing that high-level expression of syntenin increased the proportion of CD81/CD9-positive vesicles that contained two or more detected CD63 molecules. Each data point represents the mean values of all vesicles present within 30 regions of interest (ROIs) for each sample from six coverslips. Wide bars denote the average, and error bars denote the SEM. ****, ***, and * denote P values of <0.00005, <0.0005, and <0.05 from Dunnett’s T3 multiple comparisons test, respectively. Data are from three independent trials. (D) Anti-syntenin immunoblot of cell lysates prepared from 293F cells and the 293F/SDCBP−/− cell line that carries large indels at exons 2 and 3. Molecular weight (MW) markers are in kDa. (E) Immunoblot of exosome-containing fractions produced 293F cells and the 293F/SDCBP−/− cell line. (F) Bar graph of CD63/CD81 ratio in exosome-containing fractions produced by 293F cells and the 293F/SDCBP−/− cell line, in arbitrary units. ** refers to a Student’s t test P value of <0.01.
Fig. 4.
Fig. 4.. CD63 inhibits endocytosis and triggers the plasma membrane accumulation of itself, Lamp1, and Lamp2.
(A) Bar graph of CD63 transgene mRNA levels in Tet-on CD63−/− cells and CD63−/− cells carrying TRE3G-regulated CD63 transgenes. ****P < 0.0001. (B) Endocytosis assay flow cytometry histograms showing the cell surface fluorescence of endocytosis-resistant CD9 and CD63 following incubations at 4°C versus 37°C of CD63 transgenic cells from (blue) −dox or (red) +dox cultures. (C) Bar graph of CD63 EE values of CD63 transgenic cells grown ± dox. ****P < 0.0001. (D to M) Flow cytometry fluorescence brightness levels in FtetZ/CD63−/− cells carrying (gray) no transgene or the (red) WT CD63, (blue) CD63-YQRF, (orange) CD9-YQTI, or (green) CD63-AEMV transgenes, grown in the [(D) to (H)] absence of dox or [(I) to (M)] presence of dox, and stained for surface-exposed [(D) and (I)] CD63, [(E) and (J)], Lamp1, [(F) and (K)] Lamp2, [(G) and (L)] CD81, or [(H) and (M)] CD9.
Fig. 5.
Fig. 5.. Endocytosis inhibits the vesicular secretion of CD63, while CD63 expression induces the vesicular secretion of Lamp1, Lamp2, and AP-2 mu2.
(A) Immunoblots of cell lysates and exosome-containing fractions (100K pellet) collected from uninduced FtetZ/CD63−/− cells carrying WT CD63, CD63-YQRF, CD9-YQTI, or CD63-AEMV transgenes. MW size markers in kDa. (B) Bar graph showing that strengthening the CD63 endocytosis signal inhibited its vesicular secretion, while mutationally inactivating the CD63 endocytosis signal increased its vesicular secretion. E/C ratios were normalized to 1 for the WT CD63 sample in this experiment. **P < 0.01. (C) Immunoblots of cell lysates and exosome-containing fractions (100K pellet) collected from dox-induced FtetZ/CD63−/− cells carrying WT CD63, CD63-YQRF, CD9-YQTI, or CD63-AEMV transgenes. MW size markers in kDa. (D) Bar graph showing that high-level expression led to all CD63 proteins displaying the same vesicular secretion (E/C ratio). E/C ratios were normalized to 1 for the WT CD63 sample in this experiment. denotes P value of >0.05. (E to G) Bar graphs of E/C ratios for (E) Lamp1, (F) Lamp2, and (G) mu2 in CD63 knockout cells carrying the WT CD63, CD63-YQRF, or CD9-YQTI transgenes, grown in the (blue) absence or (red) presence of dox. E/C ratios were in each case normalized to 1 for the -dox sample. ***P < 0.001, ****P < 0.0001. (H) Transmission electron micrographs of FtetZ/CD63−/− cells expressing a high level of CD63. Arrowheads point to the presumed neck of possible budding intermediates. Scale bar, 100 nm. (I) Flow cytometry histograms showing the surface-stained CD63 fluorescence of 293F cells grown overnight in the (blue) absence of bafilomycin or (red) presence of bafilomycin. (J) Bar graph showing the relative levels of cell surface CD63 staining (MFI) of 293F cells grown in the (blue) absence of bafilomycin or (red) presence of bafilomycin. **P < 0.01.
Fig. 6.
Fig. 6.. Directed endocytosis of CD9 or CD81 inhibits their vesicular secretion and triggers their destruction.
(A) Bar graph of transgene-encoded CD9 mRNA levels ± dox, in Tet-on CD9−/−/− cells and matching cells carrying TRE3G-regulated CD9 transgenes, with **** denoting a P value of <0.0001. (B) Immunoblots of cells and exosome-containing fractions collected from uninduced Tet-on CD9−/−/− cells and matching cells expressing CD9, CD9-YQRF, CD9-YQTI, CD9-AEMV, or CD9-YEVM. (C) Immunoblots of cell lysates collected from the same cell lines grown overnight ± 30 nM bafilomycin A1. (D) Immunoblots of cells and exosome-containing fractions collected from dox-induced Tet-on CD9−/−/− cells expressing CD9, CD9-YQRF, CD9-YQTI, CD9-AEMV, or CD9-YEVM. (E) Bar graph showing the vesicular secretion efficiency (E/C ratio) for each form of CD9, with ** denoting a P value of <0.01. E/C ratios were normalized to 1 for the CD9-YQRF sample in this experiment. (F and G) Flow cytometry histograms showing the cell surface, anti-CD9 fluorescence staining intensity of (gray) Tet-on CD9−/−/− cells and cells expressing (red) CD9, (blue) CD9-YQRF, (orange) CD9-YQTI, (green) CD9-AEMV, or (purple) CD9-YEVM, which had been grown in the (F) absence of dox or (G) presence of dox. (H) Bar graph showing the fold increase in cell surface CD9 MFIs triggered by addition of dox, with **** denoting a P value of <0.0001. (I) Bar graph showing the MFIs of cell surface CD9 staining, with *** and **** denoting P values of <0.001 and <0.0001, respectively. (J and K) Immunoblots of cell lysates and exosome-containing fractions from (J) uninduced and (K) dox-induced Tet-on CD81−/− cells expressing CD81, CD81-YEVM, CD81-YQRF, CD81-YQTI, or CD81-AEMV. (L and M) Flow cytometry histograms showing the anti-CD81 surface-stained fluorescence staining intensities of (gray) Tet-on CD81−/− cells and matching cells expressing (red) CD81, (blue) CD81-YQRF, (orange) CD81-YQTI, (green) CD81-AEMV, or (purple) CD81-YEVM, grown in the (L) absence or (M) presence of dox. (N) Bar graph showing the vesicular secretion efficiency (E/C ratio) for Lamp2 in cells expressing endocytosed forms of CD81, normalized to 1 in the -dox sample, with ** denoting a P value of <0.01. Experiments were performed three times.
Fig. 7.
Fig. 7.. The endocytosis-independent and endocytosis-dependent pathways of exosome marker protein secretion.
The vesicular secretion of highly enriched exosome marker proteins (i) occurs primarily by the endocytosis-independent pathway and (ii) is strongly inhibited by their endocytosis, while (iii) inhibitors of endocytosis induce the vesicular secretion of CD63, Lamp2, and other constitutively-endocytosed exosomal proteins. Once a highly enriched exosome marker protein is internalized and (iv) delivered to endosomes, it can be (v) recycled to the plasma membrane or (vi) loaded into ILVs, which are then retained indefinitely, (vii) destroyed in lysosomes, or (viii) secreted as exosomes. In the case of CD81 and CD9, endocytosis triggers their nearly complete destruction, indicating that endocytosis results in their nearly stoichiometric delivery to lysosomes.

Update of

References

    1. Pegtel D. M., Gould S. J., Exosomes. Annu. Rev. Biochem. 88, 487–514 (2019). - PubMed
    1. Kalluri R., LeBleu V. S., The biology, function, and biomedical applications of exosomes. Science 367, eaau6977 (2020). - PMC - PubMed
    1. Escola J. M., Kleijmeer M. J., Stoorvogel W., Griffith J. M., Yoshie O., Geuze H. J., Selective enrichment of tetraspan proteins on the internal vesicles of multivesicular endosomes and on exosomes secreted by human B-lymphocytes. J. Biol. Chem. 273, 20121–20127 (1998). - PubMed
    1. Thery C., Regnault A., Garin J., Wolfers J., Zitvogel L., Ricciardi-Castagnoli P., Raposo G., Amigorena S., Molecular characterization of dendritic cell-derived exosomes. Selective accumulation of the heat shock protein hsc73. J. Cell Biol. 147, 599–610 (1999). - PMC - PubMed
    1. Fordjour F. K., Guo C., Ai Y., Daaboul G. G., Gould S. J., A shared, stochastic pathway mediates exosome protein budding along plasma and endosome membranes. J. Biol. Chem. 298, 102394 (2022). - PMC - PubMed

Publication types