. 2024 Jun;630(8016):493-500.
doi: 10.1038/s41586-024-07487-w. Epub 2024 May 8.

Accurate structure prediction of biomolecular interactions with AlphaFold 3

Affiliations

Accurate structure prediction of biomolecular interactions with AlphaFold 3

Josh Abramson et al. Nature. 2024 Jun.

Abstract

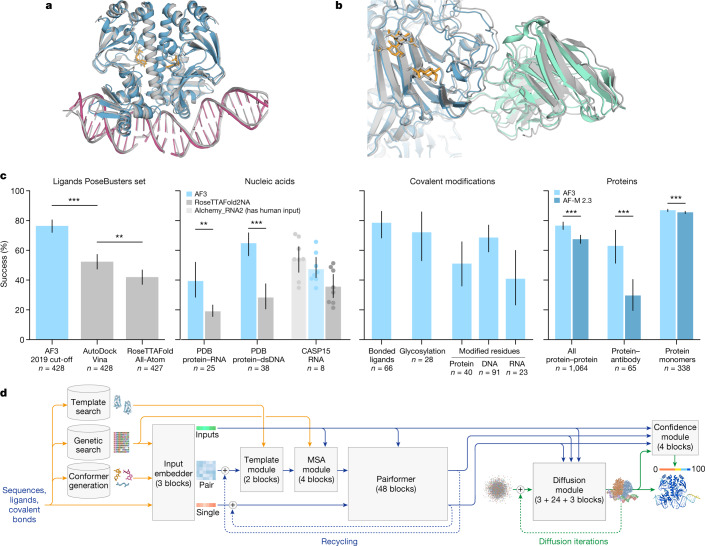
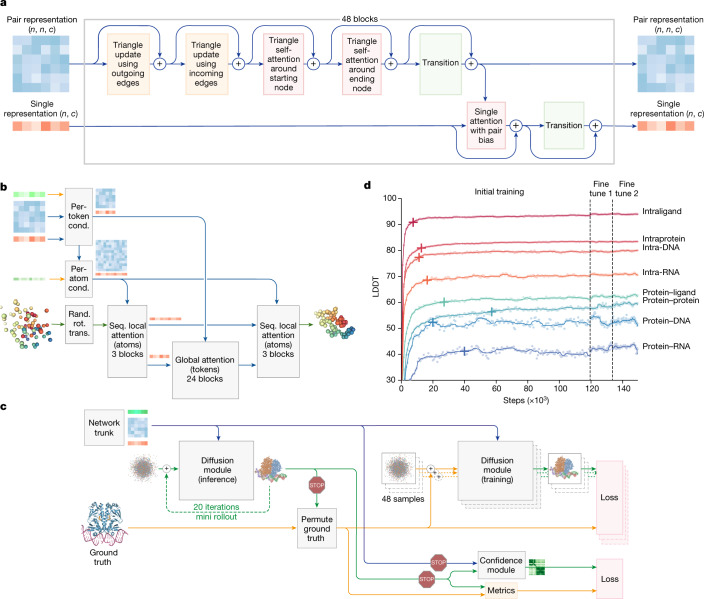
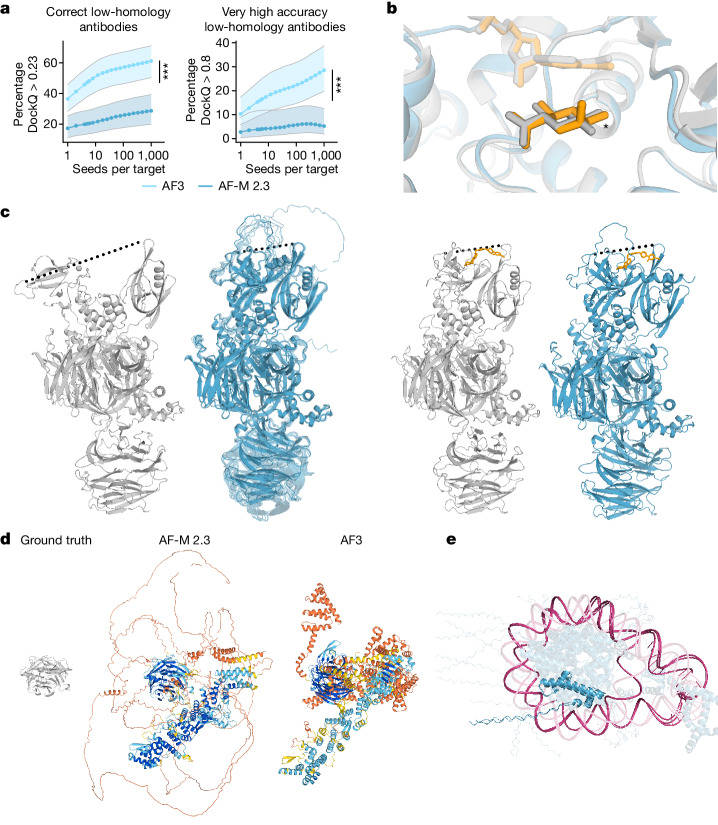
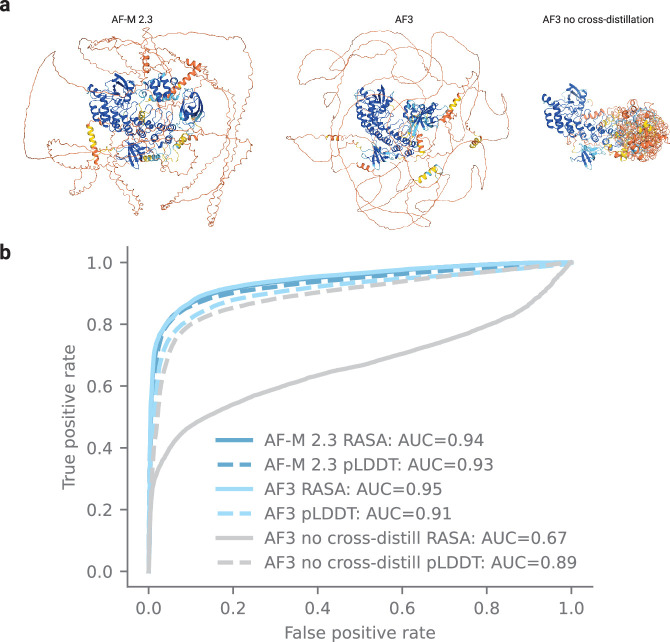
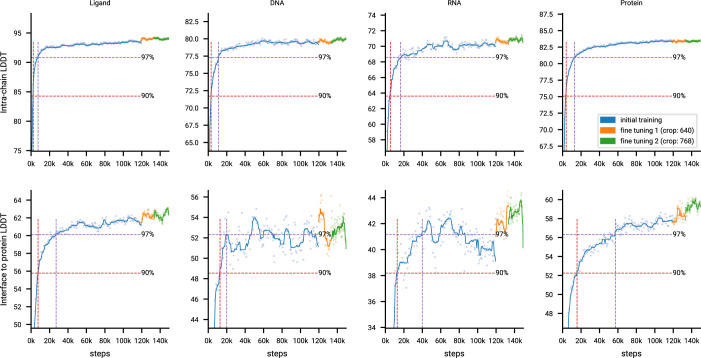
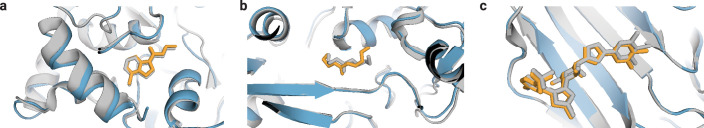
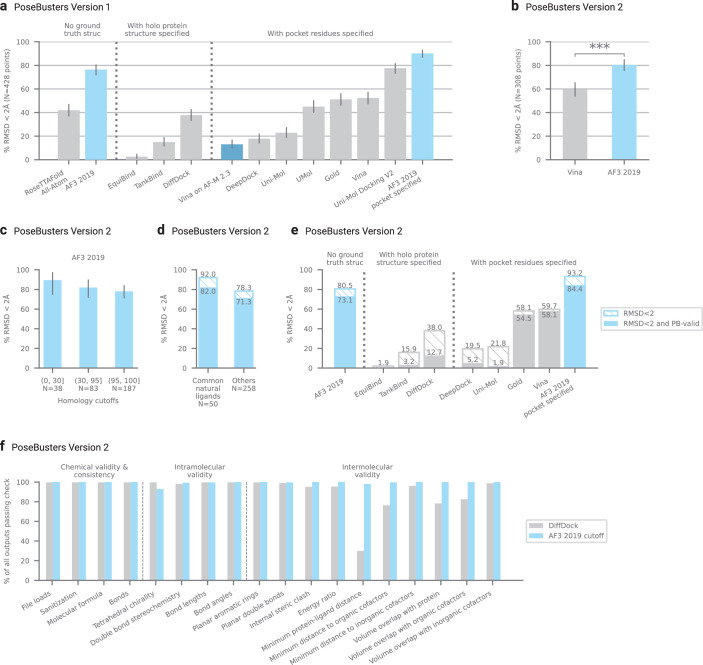
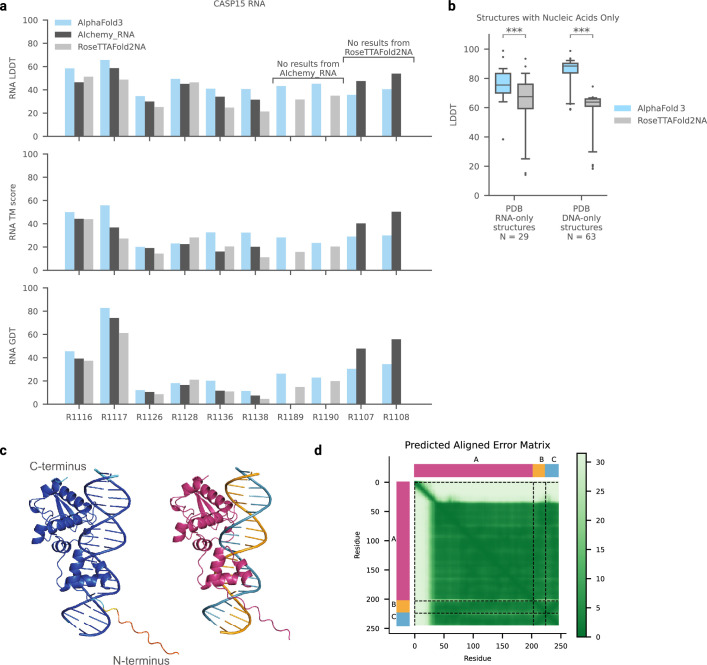
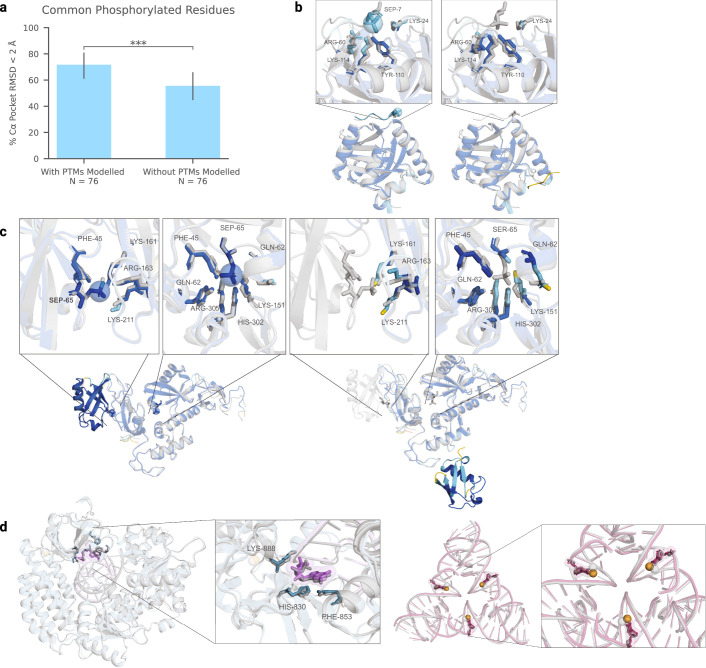
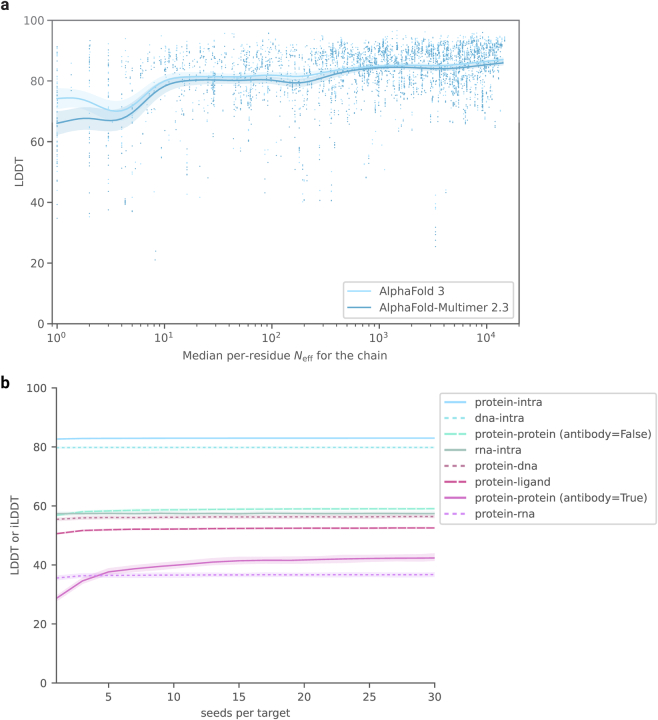
The introduction of AlphaFold 21 has spurred a revolution in modelling the structure of proteins and their interactions, enabling a huge range of applications in protein modelling and design2-6. Here we describe our AlphaFold 3 model with a substantially updated diffusion-based architecture that is capable of predicting the joint structure of complexes including proteins, nucleic acids, small molecules, ions and modified residues. The new AlphaFold model demonstrates substantially improved accuracy over many previous specialized tools: far greater accuracy for protein-ligand interactions compared with state-of-the-art docking tools, much higher accuracy for protein-nucleic acid interactions compared with nucleic-acid-specific predictors and substantially higher antibody-antigen prediction accuracy compared with AlphaFold-Multimer v.2.37,8. Together, these results show that high-accuracy modelling across biomolecular space is possible within a single unified deep-learning framework.


Conflict of interest statement

Author-affiliated entities have filed US provisional patent applications including 63/611,674, 63/611,638 and 63/546,444 relating to predicting 3D structures of molecule complexes using embedding neural networks and generative models. All of the authors other than A.B., Y.A.K. and E.D.Z. have commercial interests in the work described.

Figures

Fig. 1
Fig. 1. AF3 accurately predicts structures across biomolecular complexes.
a,b, Example structures predicted using AF3. a, Bacterial CRP/FNR family transcriptional regulator protein bound to DNA and cGMP (PDB 7PZB; full-complex LDDT, 82.8; global distance test (GDT), 90.1). b, Human coronavirus OC43 spike protein, 4,665 residues, heavily glycosylated and bound by neutralizing antibodies (PDB 7PNM; full-complex LDDT, 83.0; GDT, 83.1). c, AF3 performance on PoseBusters (v.1, August 2023 release), our recent PDB evaluation set and CASP15 RNA. Metrics are as follows: percentage of pocket-aligned ligand r.m.s.d. < 2 Å for ligands and covalent modifications; interface LDDT for protein–nucleic acid complexes; LDDT for nucleic acid and protein monomers; and percentage DockQ > 0.23 for protein–protein and protein–antibody interfaces. All scores are reported from the top confidence-ranked sample out of five model seeds (each with five diffusion samples), except for protein–antibody scores, which were ranked across 1,000 model seeds for both models (each AF3 seed with five diffusion samples). Sampling and ranking details are provided in the Methods. For ligands, n indicates the number of targets; for nucleic acids, n indicates the number of structures; for modifications, n indicates the number of clusters; and for proteins, n indicates the number of clusters. The bar height indicates the mean; error bars indicate exact binomial distribution 95% confidence intervals for PoseBusters and by 10,000 bootstrap resamples for all others. Significance levels were calculated using two-sided Fisher’s exact tests for PoseBusters and using two-sided Wilcoxon signed-rank tests for all others; ***P < 0.001, **P < 0.01. Exact P values (from left to right) are as follows: 2.27 × 10−13, 2.57 × 10−3, 2.78 × 10−3, 7.28 × 10−12, 1.81 × 10−18, 6.54 × 10−5 and 1.74 × 10−34. AF-M 2.3, AlphaFold-Multimer v.2.3; dsDNA, double-stranded DNA. d, AF3 architecture for inference. The rectangles represent processing modules and the arrows show the data flow. Yellow, input data; blue, abstract network activations; green, output data. The coloured balls represent physical atom coordinates.
Fig. 2
Fig. 2. Architectural and training details.
a, The pairformer module. Input and output: pair representation with dimension (n, n, c) and single representation with dimension (n, c). n is the number of tokens (polymer residues and atoms); c is the number of channels (128 for the pair representation, 384 for the single representation). Each of the 48 blocks has an independent set of trainable parameters. b, The diffusion module. Input: coarse arrays depict per-token representations (green, inputs; blue, pair; red, single). Fine arrays depict per-atom representations. The coloured balls represent physical atom coordinates. Cond., conditioning; rand. rot. trans., random rotation and translation; seq., sequence. c, The training set-up (distogram head omitted) starting from the end of the network trunk. The coloured arrays show activations from the network trunk (green, inputs; blue, pair; red, single). The blue arrows show abstract activation arrays. The yellow arrows show ground-truth data. The green arrows show predicted data. The stop sign represents stopping of the gradient. Both depicted diffusion modules share weights. d, Training curves for initial training and fine-tuning stages, showing the LDDT on our evaluation set as a function of optimizer steps. The scatter plot shows the raw datapoints and the lines show the smoothed performance using a median filter with a kernel width of nine datapoints. The crosses mark the point at which the smoothed performance reaches 97% of its initial training maximum.
Fig. 3
Fig. 3. Examples of predicted complexes.
Selected structure predictions from AF3. Predicted protein chains are shown in blue (predicted antibody in green), predicted ligands and glycans in orange, predicted RNA in purple and the ground truth is shown in grey. a, Human 40S small ribosomal subunit (7,663 residues) including 18S ribosomal RNA and Met-tRNAiMet (opaque purple) in a complex with translation initiation factors eIF1A and eIF5B (opaque blue; PDB 7TQL; full-complex LDDT, 87.7; GDT, 86.9). b, The glycosylated globular portion of an EXTL3 homodimer (PDB 7AU2; mean pocket-aligned r.m.s.d., 1.10 Å). c, Mesothelin C-terminal peptide bound to the monoclonal antibody 15B6 (PDB 7U8C; DockQ, 0.85). d, LGK974, a clinical-stage inhibitor, bound to PORCN in a complex with the WNT3A peptide (PDB 7URD; ligand r.m.s.d., 1.00 Å). e, (5S,6S)-O7-sulfo DADH bound to the AziU3/U2 complex with a novel fold (PDB 7WUX; ligand r.m.s.d., 1.92 Å). f, Analogue of NIH-12848 bound to an allosteric site of PI5P4Kγ (PDB 7QIE; ligand r.m.s.d., 0.37 Å).
Fig. 4
Fig. 4. AF3 confidences track accuracy.
a, The accuracy of protein-containing interfaces as a function of chain pair ipTM (top). Bottom, the LDDT-to-polymer accuracy was evaluated for various chain types as a function of chain-averaged pLDDT. The box plots show the 25–75% confidence intervals (box limits), the median (centre line) and the 5–95% confidence intervals (whiskers). n values report the number of clusters in each band. b, The predicted structure of PDB 7T82 coloured by pLDDT (orange, 0–50; yellow, 50–70; cyan, 70–90; and blue, 90–100). c, The same prediction coloured by chain. d, DockQ scores for protein–protein interfaces. e, PAE matrix of same prediction (darker is more confident), with chain colouring of c on the side bars. The dashed black lines indicate the chain boundaries.
Fig. 5
Fig. 5. Model limitations.
a, Antibody prediction quality increases with the number of model seeds. The quality of top-ranked, low-homology antibody–antigen interface predictions as a function of the number of seeds. Each datapoint shows the mean over 1,000 random samples (with replacement) of seeds to rank over, out of 1,200 seeds. Confidence intervals are 95% bootstraps over 10,000 resamples of cluster scores at each datapoint. Samples per interface are ranked by protein–protein ipTM. Significance tests were performed using by two-sided Wilcoxon signed-rank tests. n = 65 clusters. Exact P values were as follows: 2.0 × 10−5 (percentage correct) and P = 0.009 (percentage very high accuracy). b, Prediction (coloured) and ground-truth (grey) structures of Thermotoga maritima α-glucuronidase and beta-d-glucuronic acid—a target from the PoseBusters set (PDB: 7CTM). AF3 predicts alpha-d-glucuronic acid; the differing chiral centre is indicated by an asterisk. The prediction shown is top-ranked by ligand–protein ipTM and with a chirality and clash penalty. c, Conformation coverage is limited. Ground-truth structures (grey) of cereblon in open (apo, PDB: 8CVP; left) and closed (holo mezigdomide-bound, PDB: 8D7U; right) conformations. Predictions (blue) of both apo (with 10 overlaid samples) and holo structures are in the closed conformation. The dashed lines indicate the distance between the N-terminal Lon protease-like and C-terminal thalidomide-binding domain. d, A nuclear pore complex with 1,854 unresolved residues (PDB: 7F60). The ground truth (left) and predictions from AlphaFold-Multimer v.2.3 (middle) and AF3 (right) are shown. e, Prediction of a trinucleosome with overlapping DNA (pink) and protein (blue) chains (PDB: 7PEU); highlighted are overlapping protein chains B and J and self-overlapping DNA chain AA. Unless otherwise stated, predictions are top-ranked by our global complex ranking metric with chiral mismatch and steric clash penalties (Supplementary Methods 5.9.1).
Extended Data Fig. 1
Extended Data Fig. 1. Disordered region prediction.
a, Example prediction for a disordered protein from AlphaFoldMultimer v2.3, AlphaFold 3, and AlphaFold 3 trained without the disordered protein PDB cross distillation set. Protein is DP02376 from the CAID 2 (Critical Assessment of protein Intrinsic Disorder prediction) set. Predictions coloured by pLDDT (orange: pLDDT <= 50, yellow: 50 < pLDDT <= 70, light blue: 70 < pLDDT <= 90, and dark blue: 90 <= pLDDT < 100). b, Predictions of disorder across residues in proteins in the CAID 2 set, which are also low homology to the AF3 training set. Prediction methods include RASA (relative accessible surface area) and pLDDT (N = 151 proteins; 46,093 residues).
Extended Data Fig. 2
Extended Data Fig. 2. Accuracy across training.
Training curves for initial training and fine tuning showing LDDT (local distance difference test) on our evaluation set as a function of optimizer steps. One optimizer step uses a mini batch of 256 trunk samples and during initial training 256 * 48 = 12,288 diffusion samples. For fine tuning the number of diffusion samples is reduced to 256 * 32 = 8,192. The scatter plot shows the raw data points and the lines show the smoothed performance using a median filter with a kernel width of 9 data points. The dashed lines mark the points where the smoothed performance passes 90% and 97% of the initial training maximum for the first time.
Extended Data Fig. 3
Extended Data Fig. 3. AlphaFold 3 predictions of PoseBusters examples for which Vina and Gold were inaccurate.
Predicted protein chains are shown in blue, predicted ligands in orange, and ground truth in grey. a, Human Notum bound to inhibitor ARUK3004556 (PDB ID 8BTI, ligand RMSD: 0.65 Å). b, Pseudomonas sp. PDC86 Aapf bound to HEHEAA (PDB ID 7KZ9, ligand RMSD: 1.3 Å). c, Human Galectin-3 carbohydrate-recognition domain in complex with compound 22 (PDB ID 7XFA, ligand RMSD: 0.44 Å).
Extended Data Fig. 4
Extended Data Fig. 4. PoseBusters analysis.
a, Comparison of AlphaFold 3 and baseline method protein-ligand binding success on the PoseBusters Version 1 benchmark set (V1, August 2023 release). Methods classified by the extent of ground truth information used to make predictions. Note all methods that use pocket residue information except for UMol and AF3 also use ground truth holo protein structures. b, PoseBusters Version 2 (V2, November 2023 release) comparison between the leading docking method Vina and AF3 2019 (two-sided Fisher exact test, N = 308 targets, p = 2.3 * 10−8). c, PoseBusters V2 results of AF3 2019 on targets with low, moderate, and high protein sequence homology (integer ranges indicate maximum sequence identity with proteins in the training set). d, PoseBusters V2 results of AF3 2019 with ligands split by those characterized as “common natural” ligands and others. “Common natural” ligands are defined as those which occur greater than 100 times in the PDB and which are not non-natural (by visual inspection). A full list may be found in Supplementary Table 15. Dark bar indicates RMSD < 2 Å and passing PoseBusters validity checks (PB-valid). e, PoseBusters V2 structural accuracy and validity. Dark bar indicates RMSD < 2 Å and passing PoseBusters validity checks (PB-valid). Light hashed bar indicates RMSD < 2 Å but not PB valid. f, PoseBusters V2 detailed validity check comparison. Error bars indicate exact binomial distribution 95% confidence intervals. N = 427 targets for RoseTTAFold All-Atom and 428 targets for all others in Version 1; 308 targets in Version 2.
Extended Data Fig. 5
Extended Data Fig. 5. Nucleic acid prediction accuracy and confidences.
a, CASP15 RNA prediction accuracy from AIChemy_RNA (the top AI-based submission), RoseTTAFold2NA (the AI-based method capable of predicting proteinRNA complexes), and AlphaFold 3. Ten of the 13 targets are available in the PDB or via the CASP15 website for evaluation. Predictions are downloaded from the CASP website for external models. b, Accuracy on structures containing low homology RNA-only or DNA-only complexes from the recent PDB evaluation set. Comparison between AlphaFold 3 and RoseTTAFold2NA (RF2NA) (RNA: N = 29 structures, paired Wilcoxon signed-rank test, p = 1.6 * 10−7; DNA: N = 63 structures, paired two-sided Wilcoxon signed-rank test, p = 5.2 * 10−12). Note RF2NA was only trained and evaluated on duplexes (chains forming at least 10 hydrogen bonds), but some DNA structures in this set may not be duplexes. Box, centerline, and whiskers boundaries are at (25%, 75%) intervals, median, and (5%, 95%) intervals. c Predicted structure of a mycobacteriophage immunity repressor protein bound to double stranded DNA (PDB ID 7R6R), coloured by pLDDT (left; orange: 0–50, yellow: 50–70, cyan 70–90, and blue 90–100) and chain id (right). Note the disordered N-terminus not entirely shown. d, Predicted aligned error (PAE) per token-pair for the prediction in c with rows and columns labelled by chain id and green gradient indicating PAE.
Extended Data Fig. 6
Extended Data Fig. 6. Analysis and examples for modified proteins and nucleic acids.
a, Accuracy on structures. containing common phosphorylation residues (SEP, TPO, PTR, NEP, HIP) from the recent PDB evaluation set. Comparison between AlphaFold 3 with phosphorylation modelled, and AlphaFold 3 without modelling phosphorylation (N = 76 clusters, paired two-sided Wilcoxon signed-rank test, p = 1.6 * 10−4). Note, to predict a structure without modelling phosphorylation, we predict the parent (standard) residue in place of the modification. AlphaFold 3 generally achieves better backbone accuracy when modelling phosphorylation. Error bars indicate exact binomial distribution 95% confidence intervals. b, SPOC domain of human SHARP in complex with phosphorylated RNA polymerase II C-terminal domain (PDB ID 7Z1K), predictions coloured by pLDDT (orange: 0–50, yellow: 50–70, cyan 70–90, and blue 90–100). Left: Phosphorylation modelled (mean pocket-aligned RMSD 2.104 Å). Right: Without modelling phosphorylation (mean pocketaligned RMSD 10.261 Å). When excluding phosphorylation, AlphaFold 3 provides lower pLDDT confidence on the phosphopeptide. c, Structure of parkin bound to two phospho-ubiquitin molecules (PDB ID 7US1), predictions similarly coloured by pLDDT. Left: Phosphorylation modelled (mean pocket-aligned RMSD 0.424 Å). Right: Without modelling phosphorylation (mean pocket-aligned RMSD 9.706 Å). When excluding phosphorylation, AlphaFold 3 provides lower pLDDT confidence on the interface residues of the incorrectly predicted ubiquitin. d, Example structures with modified nucleic acids. Left: Guanosine monophosphate in RNA (PDB ID 7TNZ, mean pocket-aligned modified residue RMSD 0.840 Å). Right: Methylated DNA cytosines (PDB ID 7SDW, mean pocket-aligned modified residue RMSD 0.502 Å). Welabel residues of the predicted structure for reference. Ground truth structure in grey; predicted protein in blue, predicted RNA in purple, predicted DNA in magenta, predicted ions in orange, with predicted modifications highlighted via spheres.
Extended Data Fig. 7
Extended Data Fig. 7. Model accuracy with MSA size and number of seeds.
a, Effect of MSA depth on protein prediction accuracy. Accuracy is given as single chain LDDT score and MSA depth is computed by counting the number of non-gap residues for each position in the MSA using the Neff weighting scheme and taking the median across residues (see Methods for details on Neff). MSA used for AF-M 2.3 differs slightly from AF3; the data uses the AF3 MSA depth for both to make the comparison clearer. The analysis uses every protein chain in the low homology Recent PDB set, restricted to chains in complexes with fewer than 20 protein chains and fewer than 2,560 tokens (see Methods for details on Recent PDB set and comparisons to AF-M 2.3). The curves are obtained through Gaussian kernel average smoothing (window size is 0.2 units in log10(Neff)); the shaded area is the 95% confidence interval estimated using bootstrap of 10,000 samples. b, Increase in ranked accuracy with number of seeds for different molecule types. Predictions are ranked by confidence, and only the most confident per interface is scored. Evaluated on the low homology recent PDB set, filtered to less than 1,536 tokens. Number of clusters evaluated: dna-intra = 386, protein-intra = 875, rnaintra = 78, protein-dna = 307, protein-rna = 102, protein-protein (antibody = False) = 697, protein-protein (antibody = True) = 58. Confidence intervals are 95% bootstraps over 1,000 samples.
Extended Data Fig. 8
Extended Data Fig. 8. Relationship between confidence and accuracy for protein interactions with ions, bonded ligands and bonded glycans.
Accuracy is given as the percentage of interface clusters under various pocket-aligned RMSD thresholds, as a function of the chain pair ipTM of the interface. The ions group includes both metals and nonmetals. N values report the number of clusters in each band. For a similar analysis on general ligand-protein interfaces, see Fig. 4 of main text.
Extended Data Fig. 9
Extended Data Fig. 9. Correlation of DockQ and iLDDT for protein-protein interfaces.
One data point per cluster, 4,182 clusters shown. Line of best fit with a Huber regressor with epsilon 1. DockQ categories correct (>0.23), and very high accuracy (>0.8) correspond to iLDDTs of 23.6 and 77.6 respectively.

References

    1. Jumper, J. et al. Highly accurate protein structure prediction with AlphaFold. Nature596, 583–589 (2021). - PMC - PubMed
    1. Kreitz, J. et al. Programmable protein delivery with a bacterial contractile injection system. Nature616, 357–364 (2023). - PMC - PubMed
    1. Lim, Y. et al. In silico protein interaction screening uncovers DONSON’s role in replication initiation. Science381, eadi3448 (2023). - PMC - PubMed
    1. Mosalaganti, S. et al. AI-based structure prediction empowers integrative structural analysis of human nuclear pores. Science376, eabm9506 (2022). - PubMed
    1. Anand, N. & Achim, T. Protein structure and sequence generation with equivariant denoising diffusion probabilistic models. Preprint at arXiv10.48550/arXiv.2205.15019 (2022).