. 2024 Jun;300(6):107351.
doi: 10.1016/j.jbc.2024.107351. Epub 2024 May 6.

STAT3 activation of SCAP-SREBP-1 signaling upregulates fatty acid synthesis to promote tumor growth

Affiliations

STAT3 activation of SCAP-SREBP-1 signaling upregulates fatty acid synthesis to promote tumor growth

Yunzhou Fan et al. J Biol Chem. 2024 Jun.

Abstract

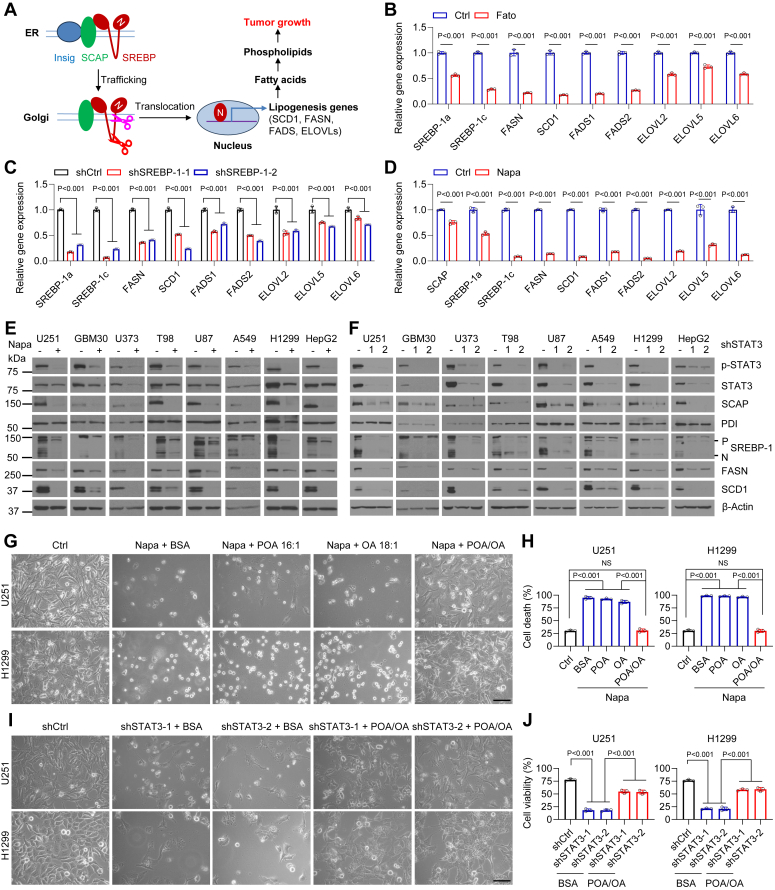
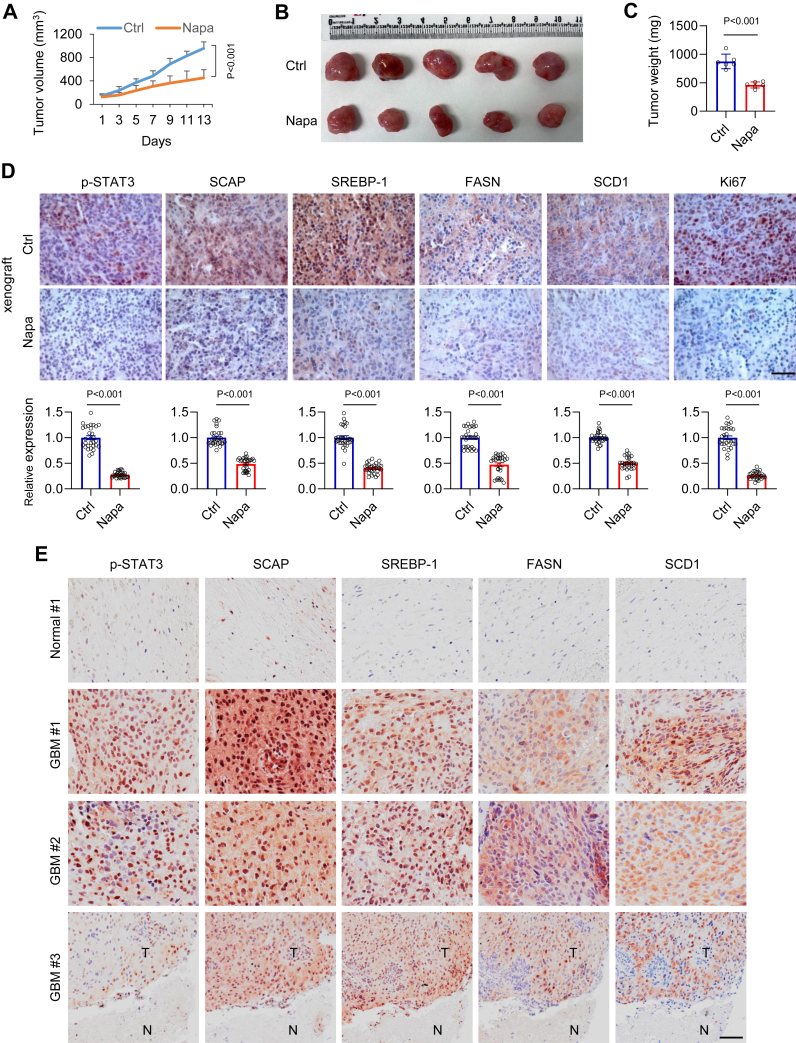
SCAP plays a central role in controlling lipid homeostasis by activating SREBP-1, a master transcription factor in controlling fatty acid (FA) synthesis. However, how SCAP expression is regulated in human cancer cells remains unknown. Here, we revealed that STAT3 binds to the promoter of SCAP to activate its expression across multiple cancer cell types. Moreover, we identified that STAT3 also concurrently interacts with the promoter of SREBF1 gene (encoding SREBP-1), amplifying its expression. This dual action by STAT3 collaboratively heightens FA synthesis. Pharmacological inhibition of STAT3 significantly reduces the levels of unsaturated FAs and phospholipids bearing unsaturated FA chains by reducing the SCAP-SREBP-1 signaling axis and its downstream effector SCD1. Examination of clinical samples from patients with glioblastoma, the most lethal brain tumor, demonstrates a substantial co-expression of STAT3, SCAP, SREBP-1, and SCD1. These findings unveil STAT3 directly regulates the expression of SCAP and SREBP-1 to promote FA synthesis, ultimately fueling tumor progression.

Keywords: FASN; SCAP; SCD1; SREBP-1; STAT3; fatty acid; glioblastoma; lipogenesis; phospholipid.


Conflict of interest statement

Conflict of interest The authors declare that they have no known competing financial interests or personal relationships that could have appeared to influence the work reported in this paper.

Figures

Figure 1
Figure 1
Inhibition of STAT3 significantly reduces free FA levels and disrupts phospholipid homeostasis in GBM cells.A, a schematic diagram illustrating the lipidomic analysis of GBM U251 cells treated with or without napabucasin (Napa, 1 μM) in serum-free DMEM medium for 24 h. B, heatmap of different lipids in U251 cells collected from panel A (n = 4). C, total levels of each type of lipids in U251 cells with or without Napa treatment. The data is shown as mean ± S.D. (n = 4). DG, heatmap of individual species of PA, PI, PS, and SM in U251 cells with or without Napa treatment (n = 4). H, levels of representative individual lipid species of PC, LPC, PE and SM in U251 cells with or without Napa treatment. The data is shown as mean ± S.D. (n = 4). I, heatmap of free fatty acids (FFAs) in U251 cells with or without Napa treatment (n = 4). J, schematic diagram illustrating the pathways of de novo FFA synthesis, elongation and desaturation catalyzed by the indicated enzymes and summary of the changes of specific FFAs in U251 cells after Napa treatment as panel A. Statistical significance was analyzed by an unpaired Student’s t test (C) or two-way ANOVA with Šídák's multiple comparisons test (H). NS, not significant. Please also see Fig. S1. ELOVL2/3/5/6, fatty acid elongase 2/3/5/6; FADS1/2, fatty acid desaturase 1/2; LPC, lysophosphatidylcholine; LPE, lysophosphatidylethanolamine; PA, phosphatidic acid; PC, phosphatidylcholine; PE, phosphatidylethanolamine; PG phosphatidylglycerol; PI, phosphatidylinositol; PS, phosphatidylserine; SCD1, stearoyl-CoA desaturase 1; SM, sphingomyelin; TG, triglycerides.
Figure 2
Figure 2
Inhibiting STAT3 suppresses SCAP and SREBP-1 expression and downregulates FA synthesis enzyme levels.A, a schematic diagram illustrating the pathway by which SCAP transports SREBP-1 from the endoplasmic reticulum (ER) to the Golgi after dissociation from the ER-resident protein Insig. In the Golgi, SREBP-1 is sequentially cleaved by two proteinases, which releases the N-terminal active SREBP-1 form that enters nucleus to activate the expression of FA synthesis-related genes to promote phospholipid formation and tumor growth. B and C, real-time PCR analysis of gene expression in U251 cells with or without fatostatin (10 μM) in serum-free medium for 24 h (B) or infection with two different lentivirus-mediated shRNA against SREBP-1 as compared with scramble shRNA (shCtrl) for 72 h (C). The data is shown as mean ± S.D. (n = 3). D, real-time PCR analysis of gene expression in U251 cells with or without Napa (1 μM) treatment in serum-free medium for 24 h. The data is shown as mean ± S.D. (n = 3). E and F, Western blot analysis of membrane (for SCAP and PDI) and whole lysates (for STAT3, p-STAT3, SREBP-1, FASN and SCD1) in U251, U373, T98, U87, A549, H1299, HepG2 cells (1 μM) in 1% FBS, or in primary GBM30 cells (5 μM) in 0.1 × B-27 medium with or without Napa treatment (E) for 24 h, or lentivirus-mediated shRNA knockdown of STAT3 for 72 h (F). Protein disulfide-isomerase (PDI), an ER-resident protein as SCAP internal control. G and H, representative micrographs of U251 and H1299 cells supplemented with BSA-conjugated palmitoleic acid (POA, 10 μM) and oleic acid (OA, 40 μM) alone or combination for 24 h, followed by treatment with or without Napa (U251, 0.5 μM; H1299, 0.4 μM) for 72 h (G). Live and dead cells were quantified (H) by hemocytometer after trypan blue staining. Cell death percentage was determined by the ratio of dead cells versus total cell number (live + dead). The data is shown as mean ± S.D. (n = 3). Scale bar, 100 μm. I and J, representative micrographs of U251 and H1299 cells with lentivirus-mediated shRNA knockdown of STAT3 in serum-free medium supplemented with BSA-conjugated palmitoleic acid (POA, 5 μM) and oleic acid (OA, 20 μM) combination for 72 h (I). Live and dead cells were quantified (J) by hemocytometer after trypan blue staining. Cell viability was determined by the ratio of live cells versus total cell number (live + dead). The data is shown as mean ± S.D. (n = 3). Scale bar, 100 μm. Statistical significance was analyzed by one-way ANOVA with Tukey's multiple comparisons test (J and H) or two-way ANOVA with Šídák's multiple comparisons test (BD). NS, not significant. Please also see Fig. S2. N, N-terminus of SREBP-1; P, precursor of SREBP-1.
Figure 3
Figure 3
STAT3 binds SCAP and SREBF1 promoters to activate their expression.AC, upper panels (scheme) show the putative STAT3 binding sites on promoters and negative binding site (NS) on exons of SCAP (A), SREBP-1a (B), and SREBP-1c (C) gene. Inserted tables under schemes show the detailed predicted STAT3-binding motifs in each gene promoter. Bottom panels show the results of ChIP-PCR analysis of STAT3 binding to the predicted sites in each promoter and NS motifs in exon in U251, U373, A549 and H1299 cells. The data were shown as mean ± S.D. (n = 3). D, promoter reporter luciferase (luc) activity (bottompanels) for respective gene promoters containing STAT3 binding motifs shown in the diagrams (AC) cloned in the pGL3-luc basic vector that were transfected into U251, U373, A549 or H1299 cells together with pRL-TK-Renilla, pcDNA3.1, pcDNA3.1-STAT3 for 48 h. Western blot analysis (upper panels) of STAT3 with pcDNA3.1, pcDNA3.1-STAT3 transfection into the corresponding cells for 48 h. The data is shown as mean ± S.D. (n = 3). Statistical significance was analyzed by two-way ANOVA with Šídák's multiple comparisons test (AD).
Figure 4
Figure 4
Pharmacological inhibition of STAT3 downregulates SCAP and SREBP-1 in a GBM xenograft model to shrink tumor volume.AC, tumor growth curve of GBM30-derived subcutaneous xenografts (mean ± S.D., n = 6) treated with Napa (40 mg/kg/2 days, i.p.) for 14 days (A). Tumors were imaged after 14 days of treatment (B) and weighed (C). D, representative images of immunohistochemistry (IHC) staining (top) and their quantitation (bottom) of indicated proteins in tumor tissues from panelB. Five separate areas from each tumor were quantified by ImageJ (mean ± SEM). Scale bar, 50 μm. E, representative images of IHC staining of indicated proteins in GBM tumor (T) versus adjacent normal (N) brain tissues from human patients. Scale bar, 50 μm. Statistical significance was analyzed by two-way ANOVA with Šídák's multiple comparisons test (A) or Student’s t test (C and D).

References

    1. Cheng C., Geng F., Cheng X., Guo D. Lipid metabolism reprogramming and its potential targets in cancer. Cancer Commun. (Lond) 2018;38:27. - PMC - PubMed
    1. Kou Y., Geng F., Guo D. Lipid metabolism in glioblastoma: from de novo synthesis to storage. Biomedicines. 2022;10:1943. - PMC - PubMed
    1. Cheng C., Ru P., Geng F., Liu J., Yoo J.Y., Wu X., et al. Glucose-mediated N-glycosylation of SCAP is essential for SREBP-1 activation and tumor. Growth Cancer Cell. 2015;28:569–581. - PMC - PubMed
    1. Zaidi N., Lupien L., Kuemmerle N.B., Kinlaw W.B., Swinnen J.V., Smans K. Lipogenesis and lipolysis: the pathways exploited by the cancer cells to acquire fatty acids. Prog. Lipid Res. 2013;52:585–589. - PMC - PubMed
    1. Koundouros N., Poulogiannis G. Reprogramming of fatty acid metabolism in cancer. Br. J. Cancer. 2020;122:4–22. - PMC - PubMed

Publication types

MeSH terms

Substances