. 2024 Aug 8;73(9):1529-1542.
doi: 10.1136/gutjnl-2023-331773.

Comprehensive single-cell analysis deciphered microenvironmental dynamics and immune regulator olfactomedin 4 in pathogenesis of gallbladder cancer

Affiliations

Comprehensive single-cell analysis deciphered microenvironmental dynamics and immune regulator olfactomedin 4 in pathogenesis of gallbladder cancer

Huisi He et al. Gut. .

Abstract

Objective: Elucidating complex ecosystems and molecular features of gallbladder cancer (GBC) and benign gallbladder diseases is pivotal to proactive cancer prevention and optimal therapeutic intervention.

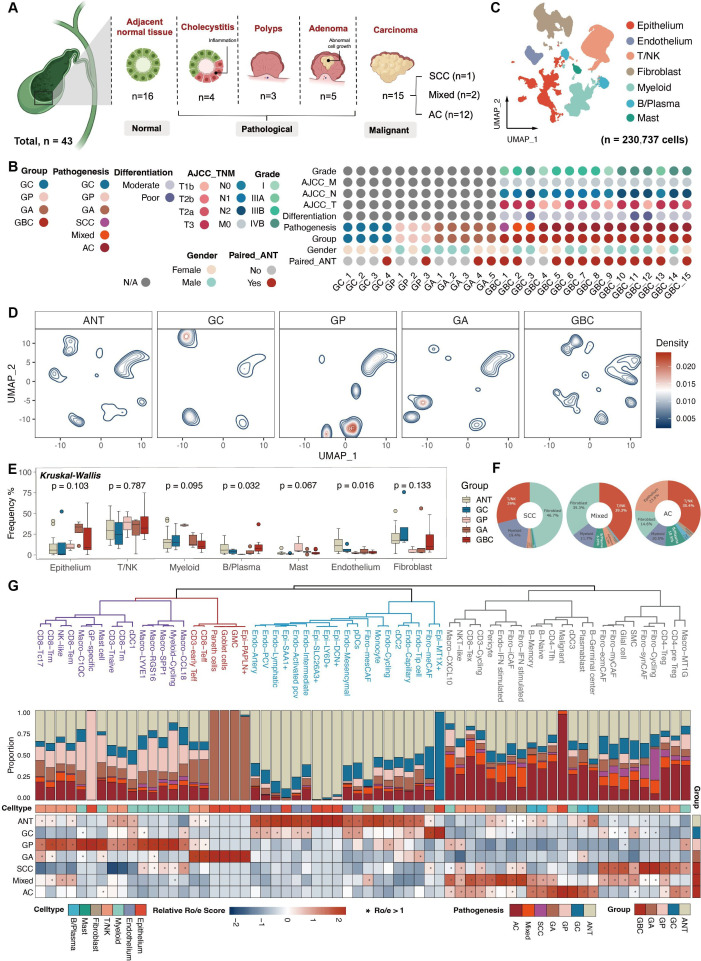
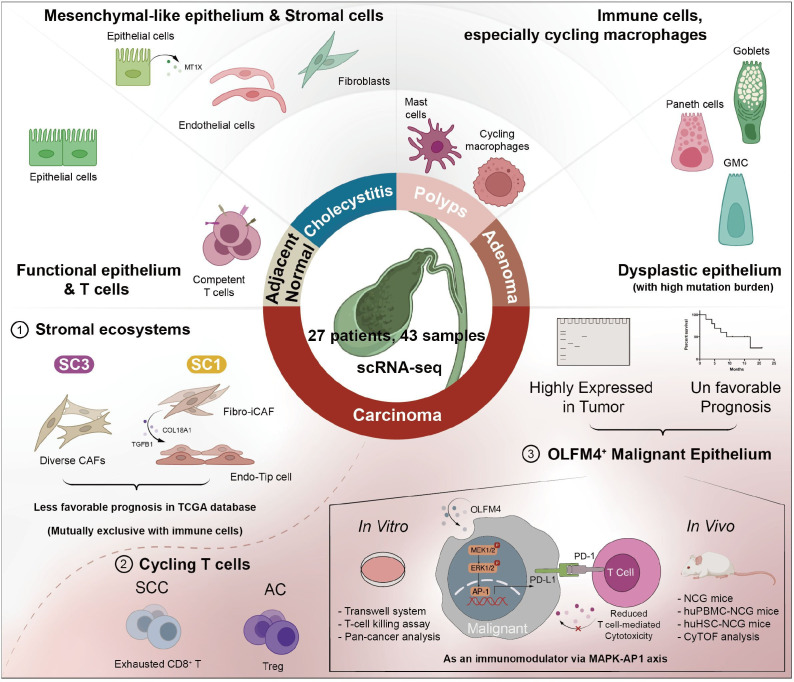
Design: We performed single-cell transcriptome analysis on 230 737 cells from 15 GBCs, 4 cholecystitis samples, 3 gallbladder polyps, 5 gallbladder adenomas and 16 adjacent normal tissues. Findings were validated through large-scale histological assays, digital spatial profiler multiplexed immunofluorescence (GeoMx), etc. Further molecular mechanism was demonstrated with in vitro and in vivo studies.

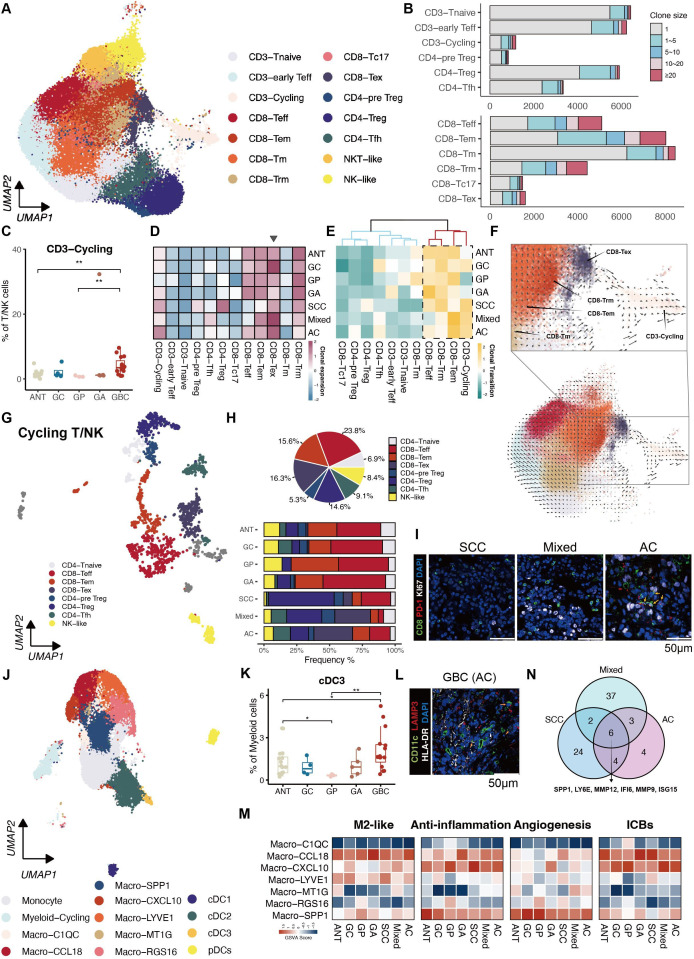
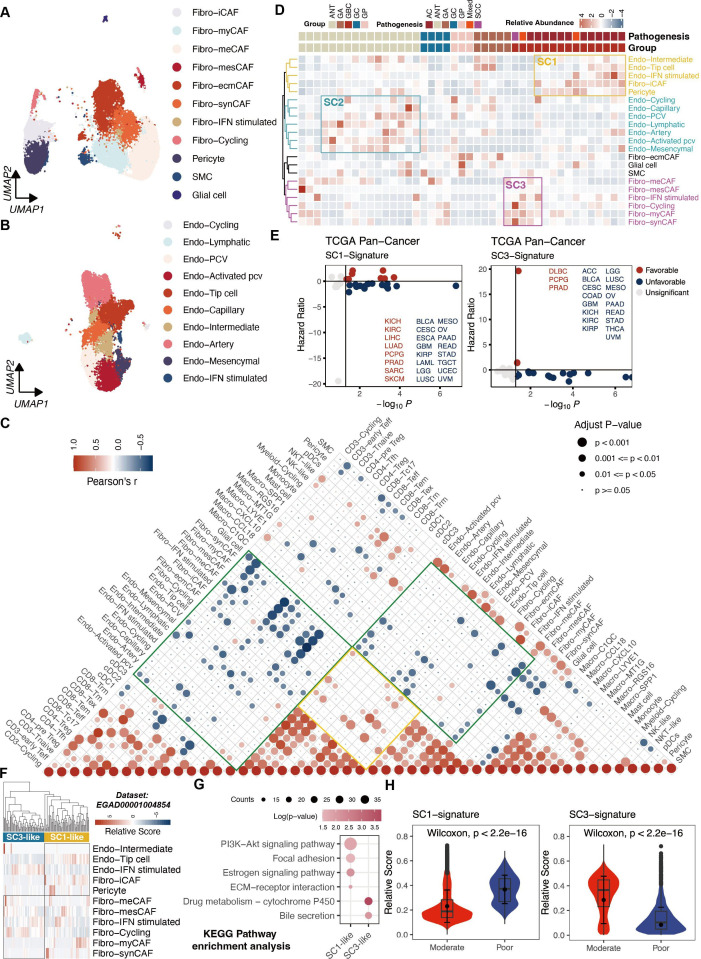
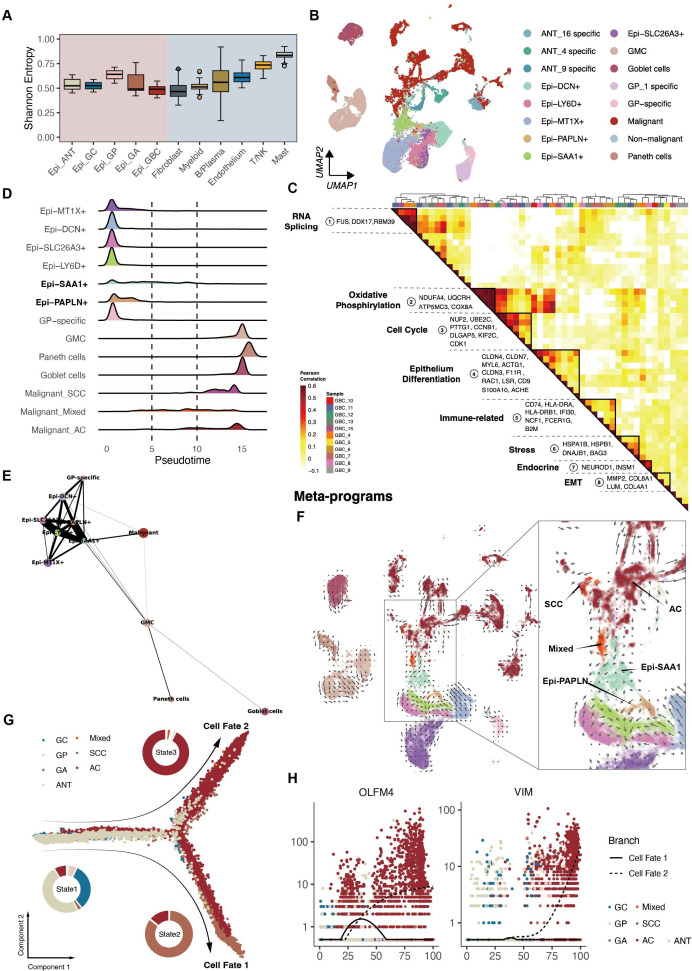
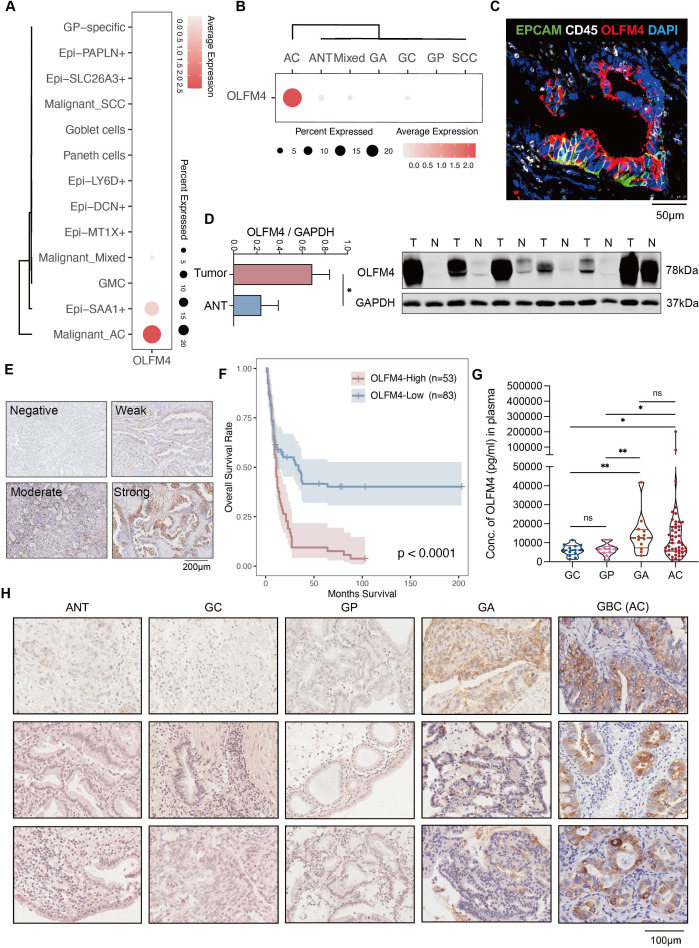
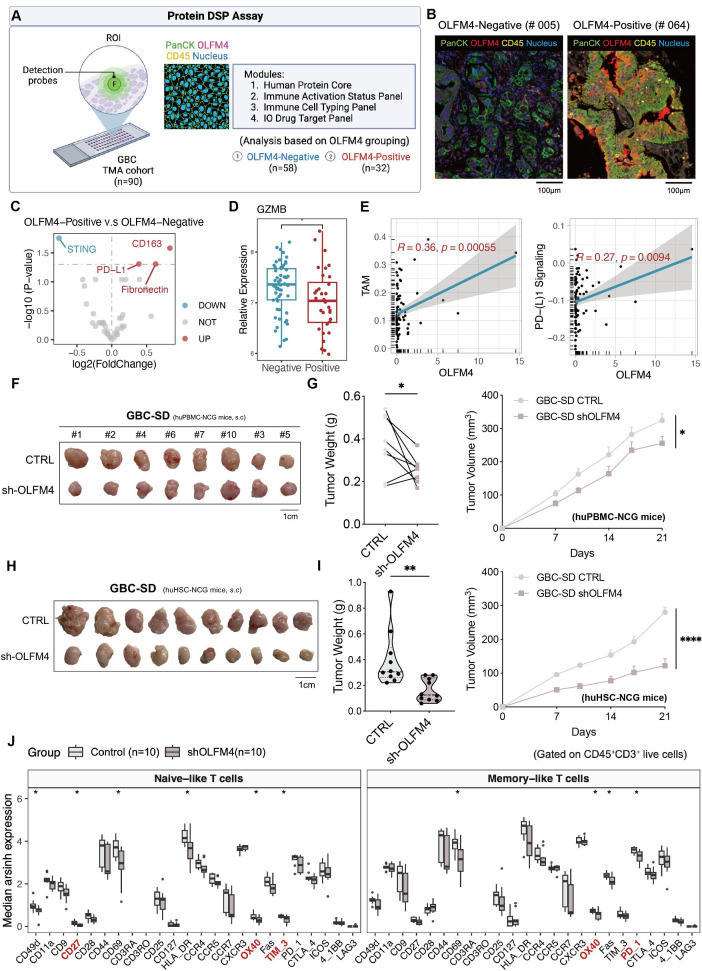
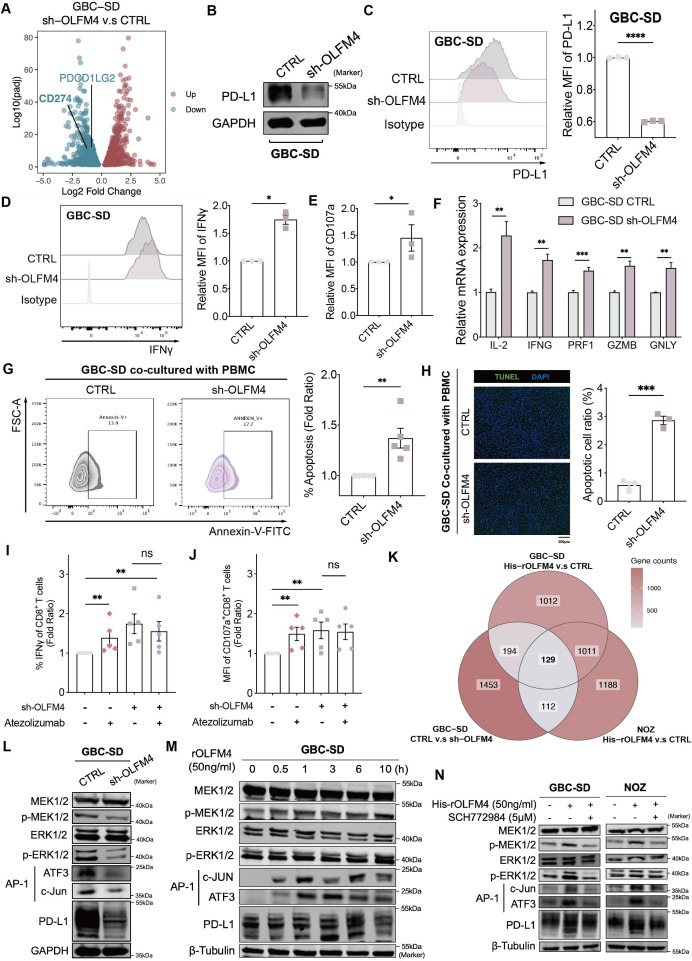
Results: The cell atlas unveiled an altered immune landscape across different pathological states of gallbladder diseases. GBC featured a more suppressive immune microenvironment with distinct T-cell proliferation patterns and macrophage attributions in different GBC subtypes. Notably, mutual exclusivity between stromal and immune cells was identified and remarkable stromal ecosystem (SC) heterogeneity during GBC progression was unveiled. Specifically, SC1 demonstrated active interaction between Fibro-iCAF and Endo-Tip cells, correlating with poor prognosis. Moreover, epithelium genetic variations within adenocarcinoma (AC) indicated an evolutionary similarity between adenoma and AC. Importantly, our study identified elevated olfactomedin 4 (OLFM4) in epithelial cells as a central player in GBC progression. OLFM4 was related to T-cell malfunction and tumour-associated macrophage infiltration, leading to a worse prognosis in GBC. Further investigations revealed that OLFM4 upregulated programmed death-ligand 1 (PD-L1) expression through the MAPK-AP1 axis, facilitating tumour cell immune evasion.

Conclusion: These findings offer a valuable resource for understanding the pathogenesis of gallbladder diseases and indicate OLFM4 as a potential biomarker and therapeutic target for GBC.

Keywords: adenoma; gallbladder cancer; inflammation; polyp.


Conflict of interest statement

Competing interests: None declared.

Figures

Figure 1
Figure 1
Landscape of precancerous lesions of gallbladder and gallbladder cancer by scRNA-seq of 43 samples. (A) Overview of the study design and sample composition. (B) Clinicopathological profiles of samples enrolled in scRNA-seq cohort. (C) Uniform Manifold Approximation and Projection unveiling seven major cell lineages. (D) Visualisation of alterations in major lineages composition among groups through cell density mapping. (E) Boxplots revealing the frequency of major cell compartments across different groups. Statistical significance was evaluated via the Kruskal-Wallis’ test. (F) Pie charts illustrating the predominant lineage composition among diverse GBC subtypes. (G) Phenotypic relationships and population abundance of 64 cell subsets excluding five patient-specific clusters. Unsupervised hierarchical clustering of cell subsets (top panel). Bar plot showing the distribution of cell subsets across seven tissue subtypes (middle panel). Heatmap at the bottom showing tissue prevalence estimated by Ro/e score for each cell subset. AC, adenocarcinomas; AJCC, American Joint Committee on Cancer; ANT, adjacent normal tissues; GA, gallbladder adenomas; GBC, gallbladder cancer; GC, gallbladder cholecystitis; GP, gallbladder polyps; NK, natural killer; SCC, squamous cell carcinoma; sc-RNA-seq, single-cell RNA sequencing; TNM, tumour, node, metastasis.
Figure 2
Figure 2
Characterisation of immune cell states throughout disease progression. (A) UMAP showing illustrating distinct subsets of T/NK cells. (B) Clonal expansion status of T cells shown as cell counts. (C) Proportion of the CD3-Cycling among different groups. (D) Heatmap displaying the clonal expansion of each T subset stratified by tissue subtypes. (E) Heatmap revealing clonal transitions between CD8-Tex and other clusters, stratified by tissue subtypes. (F) RNA velocity overlaid on UMAP of T cells, demonstrating potential transitional paths to CD8-Tex. (G) UMAP exhibiting subpopulations of Cycling T/NK cells. (H) Proportions of subpopulations of Cycling T/NK cells in each tissue subtype represented by Pie chart (top panel) and bar plot (bottom panel). (I) Immunofluorescence staining illustrating the dominance of cycling CD8-Tex in AC compared with the other two GBC subtypes. (J) UMAP showing subsets of myeloid cells identified in monocytes, macrophages and DCs. (K) Proportion of cCD3 among different groups. (L) Immunofluorescence staining confirms the presence of cCD3 in GBC. (N) Venn diagram illustrates six overlapping genes representing TAMs in GBC. (M) Heatmaps showing distinct expression patterns of function-associated signature genes among seven macrophage subsets in tissue subtypes. AC, adenocarcinomas; ANT, adjacent normal tissues; cDC, classical DC; DC, dendritic cell; GA, gallbladder adenomas; GBC, gallbladder cancer; GC, gallbladder cholecystitis; GP, gallbladder polyps; NK, natural killer; NKT, natural killer T; pDC, plasmacytoid DC; SCC, squamous cell carcinoma; TAM, tumour-associated macrophage; Teff, effector T; Tem, effector memory T; Tex, exhausted T; Tfh, follicular helper T; Tm, memory T; Treg, regulatory T; Trm, tissue-resident memory T; UMAP, Uniform Manifold Approximation and Projection.
Figure 3
Figure 3
Phenotypic abundance and interactions of stromal cells. (A) UMAP of subpopulations of fibroblasts. (B) UMAP of subpopulations of endothelial cells. (C) Correlation analysis among TME subsets in all samples based on corresponding relative abundance. P values were calculated using the Spearman correlation test with Benjamini-Hochberg correction for multiple comparisons. (D) Inference of three ecotypes based on stromal cell compositions in the 43 samples. (E) Survival analysis of SC1 and SC3 gene signature across all cancer types from TCGA. Optimal cut points were determined using the survminer package. (F) Deconvolution of SC1 and SC3 cellular ecotypes in cohort by Pandey et al. (G) KEGG enrichment analysis of SC1 and SC3 ecotypes. (H) Violin plots showing significant differences in signature scores of SC1 and SC3 between patients with well-differentiated and poor-differentiated GBC. AC, adenocarcinomas; ANT, adjacent normal tissues; ECM, extracellular matrix; GA, gallbladder adenomas; GBC, gallbladder cancer; GC, gallbladder cholecystitis; GP, gallbladder polyps; KEGG, Kyoto Encyclopedia of Genes and Genomes; SCC, squamous cell carcinoma; TCGA,The Cancer Genome Atlas; TME, tumour microenvironment; UMAP, Uniform Manifold Approximation and Projection.
Figure 4
Figure 4
Epithelium cell subtypes recapitulated dynamics of cell differentiation and specific gene expression. (A) Inter-epithelium heterogeneity across groups, measured by Shannon entropy, alongside other major cell types. (B) UMAP of subpopulations of epithelium. (C) Pearson correlation clustering of intratumour expression programmes generating eight meta-programmes. The colour was proportional to the absolute value of the correlation. (D) Distribution of epithelium subtypes during the transition, illustrated alongside pseudotime. (E) PAGA analysis of epithelium, where each dot represented an epithelium cluster. (F) RNA velocities overlaid on UMAP depicting potential transition paths from AC to mixed and SCC. Arrows on a grid show the RNA velocity field, and dots are coloured by meta-clusters. (G) Trajectory reconstruction of all epitheliums revealed three branches: pre-branch (before bifurcation), cell fate one branch, and cell fate two branch (after bifurcation). Pie charts indicated tissue subtype proportions of the cell fate 1/2 branches, respectively. (H) Two-dimensional plots showing the dynamic expression of OLFM4 and VIM in a pseudotime manner. AC, adenocarcinomas; ANT, adjacent normal tissues; GA, gallbladder adenomas; GBC, gallbladder cancer; GC, gallbladder cholecystitis; GP, gallbladder polyps; NK, natural killer; OLFM4, olfactomedin 4; PAGA, partition-based graph abstraction; SCC, squamous cell carcinoma; UMAP, Uniform Manifold Approximation and Projection; VIM, vimentin.
Figure 5
Figure 5
OLFM4 was upregulated along with GBC progression and could be detected in peripheral blood. (A) Dot plot showing the expression of OLFM4 across epithelial subsets. (B) Dot plot depicting the expression of OLFM4 across tissue subtypes. (C) Multiplex IHC staining confirmed the specific expression of OLFM4 in gallbladder epithelium. (D) Western blot analysis of OLFM4 expression in GBC tissues compared with corresponding adjacent non-cancerous tissues. Quantification of results was displayed in the bar chart on the right. (E) Representative images of OLFM4 IHC staining, related to figure 5F. (F) Overall survival analysis of patients with GBC stratified by the OLFM4 expression level in 136 IHC samples. (G) Plasma levels of OLFM4 across the progression of gallbladder disease. (H) Representative IHC images showing the distribution pattern of OLFM4 (each group, n=3). AC, adenocarcinomas; ANT, adjacent normal tissues; GA, gallbladder adenomas; GBC, gallbladder cancer; GC, gallbladder cholecystitis; GP, gallbladder polyps; IHC, immunohistochemistry; OLFM4, olfactomedin 4; SCC, squamous cell carcinoma.
Figure 6
Figure 6
OLFM4 positively correlated with TAM infiltration and suppressed antitumour T-cell immunity in vivo. (A) Overview of DSP assay design to investigate spatial heterogeneity of GBC. (B) Representative images of the OLFM4-negative sample and OLFM4-positive sample. (C) Volcanic plot of differentially expressed proteins among groups stratified by OLFM4 expression. (D) Box plot comparing GZMB expression between groups. (E) Pearson correlation of TAM and PD-(L)1 signalling with OLFM4 expression. (F) GBC-SD CTRL/sh-OLFM4 cells were injected subcutaneously into the right flank of NCG mice and transferred with activated PBMC to build the xenograft model. Gross morphology of tumours in the huPBMC-NCG model (CTRL, n=8; sh-OLFM4, n=8). (G) Tumour volume (left) and tumour weight (right) of F were calculated. (H) Subcutaneous injection of GBC-SD CTRL/sh-OLFM4 cells into CD34+ humanised mice to obtain tumour xenografts. Gross morphology of tumours in the huHSC-NCG model (CTRL, n=10; sh-OLFM4, n=10). (I) Tumour volume (left) and tumour weight (right) of H were calculated. (J) Relative expression levels of functional markers of naive-like+ T cells and memory-like+ T cells with tumours in H were determined by cytometry by time of flight. *p<0.05 using a Wilcoxon test. CyTOF, mass cytometry or cytometry by time of flight; DSP, digital spatial profiler; GBC, gallbladder cancer; GZMB, granzyme B; OLFM4, olfactomedin 4; PBMC, peripheral blood mononuclear cells; PD-L1, programmed cell death ligand 1; ROI, region of interest; TAM, tumour-associated macrophage.
Figure 7
Figure 7
OLFM4 impaired immune response via the MAPK-AP1-PD-L1 axis. (A) Volcano plot for the differentially expressed genes after OLFM4-knockdown in GBC-SD (adjusted p<0.05). (B) Expression levels of PD-L1 determined by western blot in OLFM4 knockdown GBC cells. (C) PD-L1 expression in OLFM4-knockdown GBC-SD cells analysed by flow cytometry (left). Bar plot comparing the relative mean fluorescence intensity (MFI) of PD-L1 (right). (D) Intracellular IFN-γ of CD8+T cells detected by flow cytometry after co-culturing with GBC-SD CTRL/sh-OLFM4 cells for 72 hours. Bar plot compared the relative MFI of IFN-γ (n=3, *p<0.05). (E) Bar plot comparing the relative MFI of CD107a from CD8+T cells co-cultured with GBC-SD CTRL/sh-OLFM4 cells (n=3, *p<0.05). (F) Quantitative RT-PCR performed to detect IL-2 (interleukin-2), IFN-G (IFN-γ), PRF1 (perforin-1), GZMB (granzyme) and GNLY (granulysin) in activated PBMCs co-cultured with GBC-SD CTRL/sh-OLFM4 cells (n=3, *p<0.05). (G) Activated PBMCs were co-cultured with GBC-SD CTRL/sh-OLFM4 cells for 72 hours at the ratio of 4:1. The PBMCs were collected and stained with FITC-annexin V, then subjected to flow cytometry analysis. The percentage of apoptotic cells was analysed (right panel). (H) Cell apoptosis in PBMC co-cultured GBC cells evaluated by transferase dUTP nick end labelling assay (left panel). The apoptotic cell ratios were shown (right panel). (I) Relative proportion of IFN-γ+CD8+T cells following a 72-hour co-culture with GBC-SD CTRL/sh-OLFM4 cells, in the presence or absence of atezolizumab (10 µg/mL) treatment. (J) Relative MFI of CD107a+CD8+T cells following a 72-hour co-culture with GBC-SD CTRL/sh-OLFM4 cells, in the presence or absence of atezolizumab (10 µg/mL) treatment. (K) Venn diagram illustrating overlapping genes in GBC cell lines with OLFM4 stimulation or knockdown. (L) Western blot analyses of total MEK1/2, p-MEK1/2, total ERK1/2, p-ERK1/2, AP-1 complex and PD-L1 levels in GBC-SD CTRL and GBC-SD sh-OLFM4. (M) Western blot analyses of total MEK1/2, p-MEK1/2, total ERK1/2, p-ERK1/2, AP-1 complex and PD-L1 levels in GBC-SD treated with OLFM4 (50 ng/mL). (N) Western blot analyses of total MEK1/2, p-MEK1/2, total ERK1/2, p-ERK1/2, AP-1 complex and PD-L1 levels in GBC-SD and NOZ treated with OLFM4 (50 ng/mL) combined with or without ERK1/2 pathway inhibitor (SCH772984). GBC, gallbladder cancer; IFN, interferon; mRNA, messenger RNA; OLFM4, olfactomedin 4; PBMC, peripheral blood mononuclear cells; PD-L1, programmed cell death ligand 1; RT-PCR, reverse transcription polymerase chain reaction.
Figure 8
Figure 8
Summary of immune features and dynamics of the ecosystem among gallbladder diseases within this study. AC, adenocarcinoma; CAF, cancer-associated fibroblast; CyTOF, cytometry by time of flight; GMC, glandular mucosal cell; OLFM4, olfactomedin 4; PD-1, programmed cell death protein 1; PD-L1, programmed cell death ligand 1; SCC, squamous cell carcinoma; scRNA-seq, single-cell RNA sequencing; TCGA, The Cancer Genome Atlas.

References

    1. Huang J, Patel HK, Boakye D, et al. . Worldwide distribution, associated factors, and trends of gallbladder cancer: A global country-level analysis. Cancer Letters 2021;521:238–51. 10.1016/j.canlet.2021.09.004 - DOI - PubMed
    1. Sung H, Ferlay J, Siegel RL, et al. . Global cancer Statistics 2020: GLOBOCAN estimates of incidence and mortality worldwide for 36 cancers in 185 countries. CA Cancer J Clin 2021;71:209–49. 10.3322/caac.21660 - DOI - PubMed
    1. Roa JC, García P, Kapoor VK, et al. . Gallbladder cancer. Nat Rev Dis Primers 2022;8:69. 10.1038/s41572-022-00398-y - DOI - PubMed
    1. Javle MM, Hainsworth JD, Swanton C, et al. . Pertuzumab + Trastuzumab for Her2-positive metastatic biliary cancer: preliminary data from Mypathway. JCO 2017;35:402. 10.1200/JCO.2017.35.4_suppl.402 - DOI
    1. Javle M, Zhao H, Abou-Alfa GK, et al. . Systemic therapy for gallbladder cancer. Chin Clin Oncol 2019;8:44. 10.21037/cco.2019.08.14 - DOI - PMC - PubMed

MeSH terms

Substances