. 2024 May 8;15(1):3872.
doi: 10.1038/s41467-024-47683-w.

Bacteroidota inhibit microglia clearance of amyloid-beta and promote plaque deposition in Alzheimer's disease mouse models

Affiliations

Bacteroidota inhibit microglia clearance of amyloid-beta and promote plaque deposition in Alzheimer's disease mouse models

Caroline Wasén et al. Nat Commun. .

Abstract

The gut microbiota and microglia play critical roles in Alzheimer's disease (AD), and elevated Bacteroides is correlated with cerebrospinal fluid amyloid-β (Aβ) and tau levels in AD. We hypothesize that Bacteroides contributes to AD by modulating microglia. Here we show that administering Bacteroides fragilis to APP/PS1-21 mice increases Aβ plaques in females, modulates cortical amyloid processing gene expression, and down regulates phagocytosis and protein degradation microglial gene expression. We further show that administering Bacteroides fragilis to aged wild-type male and female mice suppresses microglial uptake of Aβ1-42 injected into the hippocampus. Depleting murine Bacteroidota with metronidazole decreases amyloid load in aged 5xFAD mice, and activates microglial pathways related to phagocytosis, cytokine signaling, and lysosomal degradation. Taken together, our study demonstrates that members of the Bacteroidota phylum contribute to AD pathogenesis by suppressing microglia phagocytic function, which leads to impaired Aβ clearance and accumulation of amyloid plaques.


Conflict of interest statement

The authors declare no competing interests.

Figures
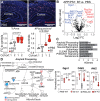
Fig. 1
Fig. 1. Bacteroides fragilis increases plaque burden and expression of amyloid processing genes in cortex.
APP/PS1 mice were treated with Bacteroides fragilis (Bf) between 2.6–5.0 months of age. A Amyloid plaque burden was assessed by immunohistofluorescence of the cortex. The graph represents the fold change (FC) of plaques in mice treated with Bf vs. controls treated with PBS. Plaque burden is defined as the percent of the cortex area that were covered with plaques and the number of plaques per square millimeter in the cortex. The data is pooled from two independent experiments, PBS: n = 6 mice/group, Bf: n = 7. Three mice from cohort 2 belonging to the PBS group was excluded from the analysis because the tissue was damaged during cutting. Histologic findings from cohort 1 are a modified representation of data originally published in Cox et al., Scientific reports, 2019, under the Creative Commons CC BY license https://www.nature.com/articles/s41598-019-54187-x#rightslink. The p-values were calculated with a two-sided Student’s t test. BD The cortical tissue from cohort 1 was analyzed for transcriptional changes with the NanoString Neuropathology panel, the statistical test was two-sided. B Volcano plot of differentially expressed genes between APP/PS1 mice treated with Bf or PBS. C Pathways identified by Ingenuity Pathway Analysis (IPA) in APP/PS1 mice treated with Bf vs. PBS, genes with FC > ±0.2 and a p-value < 0.05 were included in the analysis. D Schematic figure of the amyloid processing pathway (adaption of IPA-generated graph) and graphs showing the differentially expressed genes in the pathway, the p-values were generated with NSolver Advanced Analysis. n = 3 mice/group. Violin plots represent min, max, interquartile range and median, the dots represent mice. Source data are provided as a Source Data file.
Fig. 2
Fig. 2. Bacteroides fragilis downregulates microglia genes involved in plaque clearance.
Microglia were isolated from APP/PS1 (Alzheimer’s disease, AD) and wild type (WT) female mice treated with B. fragilis (Bf) between 2.6–5.0 months of age and analyzed by RNA sequencing. Data from two independent experiments were pooled in the analysis (cohort 1 and 2). Transcripts with an average count of 100 (scaled by size factors) across all samples were included in the analysis. P-values and fold changes were calculated with two-sided Wald test using the DESeq2 package in R. A Principal component (PC) plot. B Volcano plot showing p-value and fold change (FC) of genes in APP/PS1 mice treated with Bf vs. PBS (controls). C Table showing the number of up- and downregulated genes (p-value < 0.05) in microglia from APP/PS1 mice treated with Bf vs. PBS and in PBS treated mice of APP/PS1 vs. WT genotype. D Heatmap showing differentially expressed genes (DEGs, Bf vs. PBS in APP/PS1 mice) that are typically up- (MGnD) or downregulated (homeostatic) in microglia with a neurodegenerative phenotype compared to homeostatic microglia. Selected genes are also shown in boxplots representing the normalized counts. E Altered pathways identified by Ingenuity Pathway Analysis (IPA), for genes with FC > ±0.2 and a p-value < 0.05. Circles are shaded according to the z-score indicating activation (red) or inhibition (blue) or no presumed direction (gray). The size of the circle corresponds to the number of genes in the pathway, *p < 0.05, **p < 0.01, ***p < 0.001, ****p < 0.0001, p-values were generated by IPA. F Heatmap of the FC of genes in the Phagosome Maturation Pathway, * p < 0.05. WT-PBS: n = 9 mice/group, WT-Bf: n = 7, APP/PS1-PBS: n = 8, APP/PS1-Bf: n = 7. G Spearman correlation between genes from pathways related to phagocytosis and protein degradation and the percent area of amyloid plaques in the cortex. Violin plots represent min, max, interquartile range and median, the dots represent mice. Source data are provided as a Source Data file.
Fig. 3
Fig. 3. Bacteroides fragilis inhibits Aβ uptake by microglia.
A 8–12-month-old male (data pooled from two independent experiments) and female wildtype (WT) mice were given weekly gavages of B. fragilis (Bf) for 2 months. Fluorescently labeled Amyloid β (Aβ)−42 was injected into the hippocampus and microglia sorted 16 h later. Created with BioRender.com. B Gating strategy for isolation of microglia from the brain and assessment of Aβ uptake. C Microglial uptake of Aβ in mice treated with Bf. p-values were calculated using a two-sided Mann–Whitney U test. D Volcano plot of differentially expressed genes in microglia isolated from Bf treated mice cohort 3) and controls and analyzed by RNA sequencing. P-values and fold changes were calculated with two-sided Wald test using the DESeq2 package in R. E Pathways altered by Bf identified by Ingenuity Pathway Analysis (IPA), including genes with a FC > ±0.2 and a p-value < 0.05. Circles are shaded according to the z-score indicating activation (red) or inhibition (blue) or no presumed direction (gray). The size of the circle corresponds to the number of genes in the pathway, F Expression of microglial genes involved in phagocytosis and protein degradation pathways indicated by the colored circle: phagocytosis (green), macropinocytosis (light blue), clathrin-mediated endocytosis (pink), protein ubiquitination (yellow), autophagy (purple), and microautophagy (dark blue).  Individual replicates are shown, as well as fold change (FC) per group and significant diffferenced detected by DESeq2. Spearman R of amyloid uptake vs. normalised counts and significance p-values are shown in the right column. Male-PBS: n = 10 mice/group, Male-Bf: n = 10, Female-PBS: n = 5, Female-Bf: n = 7. Violin plots represent min, max, interquartile range and median, the dots represent mice. *p < 0.05, **p < 0.01, ***p < 0.001, ****p < 0.0001. Source data are provided as a Source Data file.
Fig. 4
Fig. 4. Metronidazole reduces amyloid plaques and modulates central and peripheral immunity.
Female 5xFAD and wild type (WT) mice were treated with metronidazole (MTZ) in their drinking water between 9 and 12 months of age. Amyloid plaques were assessed with histology, cortical gene expression with the NanoString neuropathology panel and microglia gene expression with RNA sequencing. A The amyloid-β (Aβ) plaque burden in cortex. Plaque burden was defined as the percent of the cortex area that were covered with plaques and the number of plaques per square millimeter in the cortex. The p-values were calculated with a two-sided Student’s t test, n = 5 mice/group. B Volcano plot of differentially expressed genes in the cortical tissue of 5xFAD-MTZ mice vs. 5xFAD-H20 mice and the normalized counts of Ide mRNA (coding for Insulin degrading enzyme), the p-value was generated with Nsolver Advanced Analysis (two-sided test), n = 3 mice/group. C Volcano plot showing the adjusted two-sided p-value and fold change (FC) of microglia genes modulated by MTZ in 5xFAD mice. D Heatmap of homeostatic microglia gene signature with an unadjusted two-sided p-value of <0.05 (5xFAD-H2O vs. 5xFAD-MTZ), n = 5 mice/group. E Microglia pathways altered by MTZ in 5xFAD mice identified by Ingenuity Pathway Analysis (IPA). Genes with a FC > ±0.2 and a two-sided unadjusted p-value < 0.05 were included in the analysis. Circles are shaded according to the z-score indicating activation (red) or inhibition (blue) or no presumed direction (gray). *p-value < 0.05, n = 5 mice/group. F Frequency of GM-CSF + T cells, the T cells were isolated from the spleen and stimulated for 3 h with PMA/ionomycin. One outlier was removed from the AD-MTZ group with the Grubb’s test in GraphPad Prism. The p-values were calculated with one-way ANOVA, n = 5 mice/group. Violin plots represent min, max, interquartile range and median, the dots represent individual mice. Source data are provided as a Source Data file.
Fig. 5
Fig. 5. Bacteroides impair microglial-mediated amyloid clearance.
Administering B. fragilis to mice reduces splenic GM-CSF, reduces expression of microglial genes involved in the response to Aβ, and decreases microglial phagocytic function resulting in impaired Aβ clearance and increased plaques. Created with BioRender.com.

References

    1. Harach T, et al. Reduction of Abeta amyloid pathology in APPPS1 transgenic mice in the absence of gut microbiota. Sci. Rep. 2017;7:41802–41802. doi: 10.1038/srep41802. - DOI - PMC - PubMed
    1. Minter MR, et al. Antibiotic-induced perturbations in gut microbial diversity influences neuro-inflammation and amyloidosis in a murine model of Alzheimer’s disease. Sci. Rep. 2016;6:30028. doi: 10.1038/srep30028. - DOI - PMC - PubMed
    1. Mezö C, et al. Different effects of constitutive and induced microbiota modulation on microglia in a mouse model of Alzheimer’s disease. Acta Neuropathol. Commun. 2020;8:119. doi: 10.1186/s40478-020-00988-5. - DOI - PMC - PubMed
    1. Kim N, et al. Transplantation of gut microbiota derived from Alzheimer’s disease mouse model impairs memory function and neurogenesis in C57BL/6 mice. Brain Behav. Immun. 2021;98:357–365. doi: 10.1016/j.bbi.2021.09.002. - DOI - PubMed
    1. Kim MS, et al. Transfer of a healthy microbiota reduces amyloid and tau pathology in an Alzheimer’s disease animal model. Gut. 2020;69:283–294. doi: 10.1136/gutjnl-2018-317431. - DOI - PubMed

Publication types

MeSH terms

Substances

LinkOut - more resources