. 2024 May 8;15(1):3880.
doi: 10.1038/s41467-024-47395-1.

MeCP2 binds to methylated DNA independently of phase separation and heterochromatin organisation

Affiliations

MeCP2 binds to methylated DNA independently of phase separation and heterochromatin organisation

Raphaël Pantier et al. Nat Commun. .

Abstract

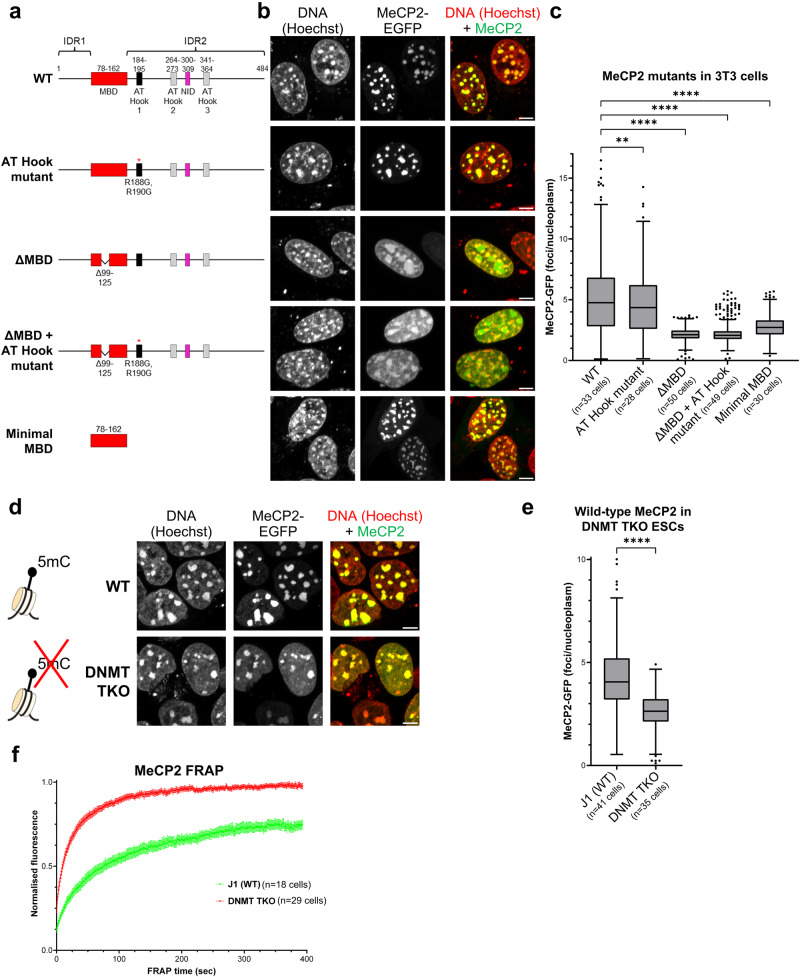
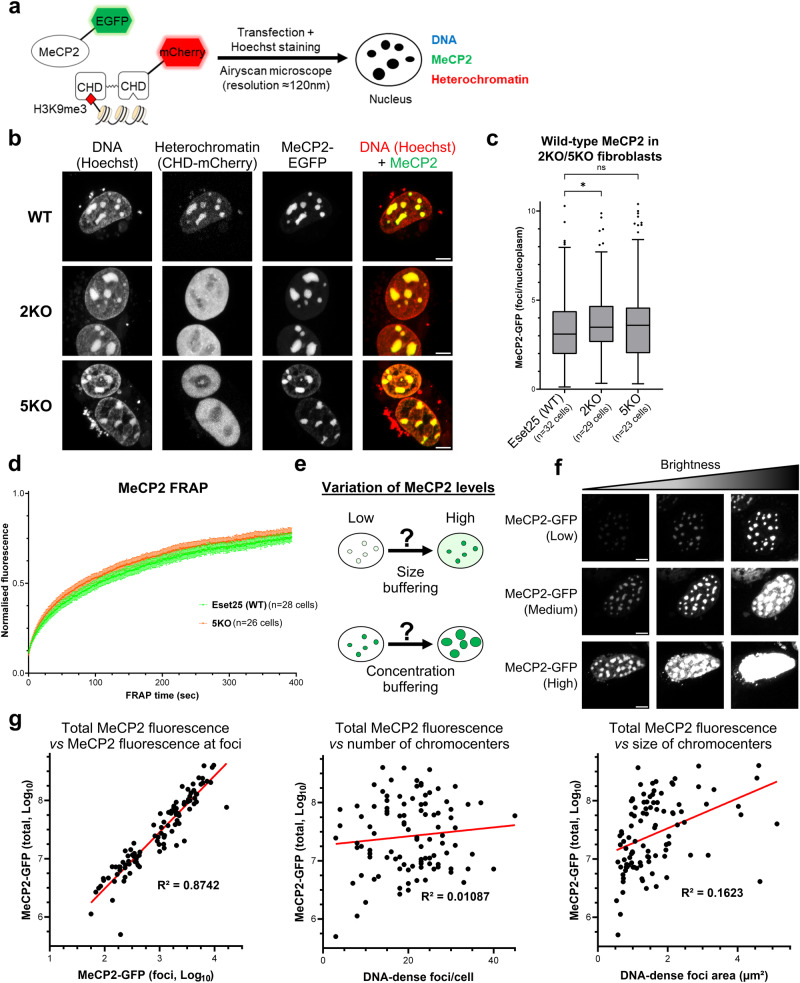
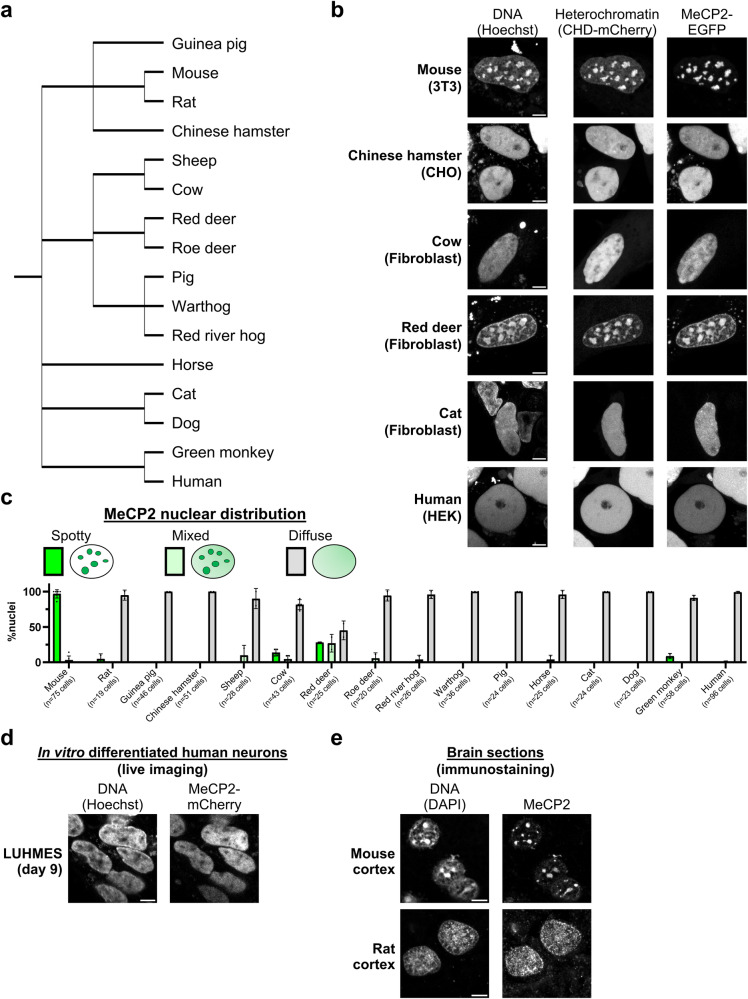
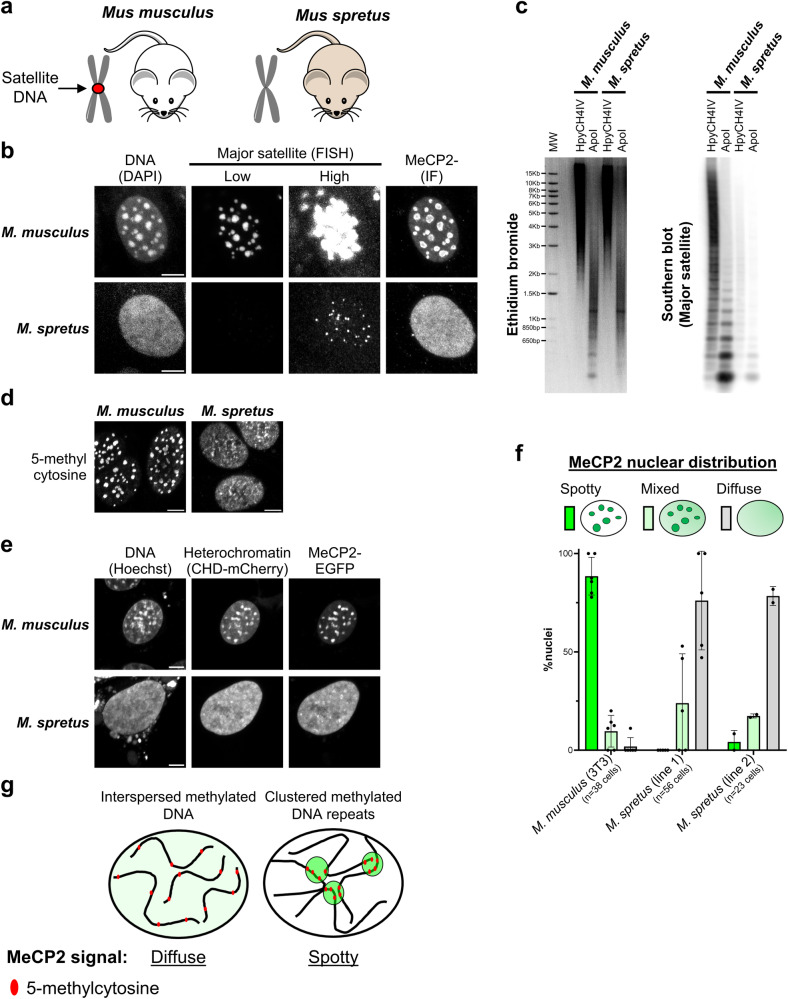
Correlative evidence has suggested that the methyl-CpG-binding protein MeCP2 contributes to the formation of heterochromatin condensates via liquid-liquid phase separation. This interpretation has been reinforced by the observation that heterochromatin, DNA methylation and MeCP2 co-localise within prominent foci in mouse cells. The findings presented here revise this view. MeCP2 localisation is independent of heterochromatin as MeCP2 foci persist even when heterochromatin organisation is disrupted. Additionally, MeCP2 foci fail to show hallmarks of phase separation in live cells. Importantly, we find that mouse cellular models are highly atypical as MeCP2 distribution is diffuse in most mammalian species, including humans. Notably, MeCP2 foci are absent in Mus spretus which is a mouse subspecies lacking methylated satellite DNA repeats. We conclude that MeCP2 has no intrinsic tendency to form condensates and its localisation is independent of heterochromatin. Instead, the distribution of MeCP2 in the nucleus is primarily determined by global DNA methylation patterns.


Conflict of interest statement

The authors declare no competing interests.

Figures

Fig. 1
Fig. 1. MeCP2 localises to DNA-dense foci in mouse cells via its Methyl-DNA Binding Domain (MBD).
a Diagram showing the structure of wild-type and mutant MeCP2 constructs (fused with EGFP) used for live-cell imaging with annotated domains. MBD methyl-CpG binding domain, NID NCoR-interaction domain, IDR intrinsically disordered region. b Live-cell imaging of 3T3 cells transfected with the EGFP-MeCP2 constructs indicated in (a). Hoechst staining was used to visualise DNA. Scale bars: 5 µm. c Box plot showing the quantification of MeCP2 wild-type and mutant fluorescence at DNA-dense foci (relative to nucleoplasm) in 3T3 cells, as described in (b). The box lower and upper limits correspond to the 25th and 75th percentiles, respectively, with the centre line corresponding to the median. Whiskers extend up to 1.5 times the interquartile distance according to Tukey’s method, and individual points are outliers. The number of analysed cells from two independent experiments are: WT n = 33 cells, AT-Hook mutant n = 28 cells, ΔMBD n = 50 cells, ΔMBD + AT-Hook mutant n = 49 cells, Minimal MBD n = 30 cells. Stars indicate statistical significance compared to wild-type MeCP2 (Brown-Forsythe and Welch ANOVA test). d Live-cell imaging of wild-type (J1) and DNMT TKO ESCs transfected with wild-type EGFP-MeCP2. Hoechst staining was used to visualise DNA. Scale bars: 5 µm. Diagram adapted from Lyst and Bird, Nat Rev Genet, 2015. e Box plot showing the quantification of MeCP2 fluorescence at DNA-dense foci (relative to nucleoplasm) in wild-type (J1) and DNMT TKO ESCs, as described in (d). The box lower and upper limits correspond to the 25th and 75th percentiles, respectively, with the centre line corresponding to the median. Whiskers extend up to 1.5 times the interquartile distance according to Tukey’s method, and individual points are outliers. The number of analysed cells from two independent experiments are: J1 (WT) n = 41 cells, DNMT TKO n = 35 cells. Stars indicate statistical significance compared to wild-type cells (two-tailed unpaired t test with Welch’s correction). f Graph showing the FRAP quantification of wild-type EGFP-MeCP2 in wild-type (J1, green) and DNMT TKO (red) ESCs. The number of analysed cells from two independent experiments are: J1 (WT) n = 18 cells, DNMT TKO n = 29 cells. Error bars: SEM.
Fig. 2
Fig. 2. Heterochromatin organisation does not determine MeCP2 localisation.
a Diagram adapted from Lyst and Bird, Nat Rev Genet, 2015 showing the strategy used to visualise MeCP2 (EGFP fusion protein), heterochromatin (HP1 chromodomain reporter) and DNA (Hoechst staining) in live cells by high-resolution confocal microscopy. b Live-cell imaging of wild-type (Eset25) and H3K9 lysine methyltransferases knockout fibroblasts (2KO/5KO) transfected with wild-type EGFP-MeCP2. Hoechst staining and a CHD-mCherry reporter were used to visualise DNA and heterochromatin, respectively. Scale bars: 5 µm. c Box plot showing the quantification of MeCP2 fluorescence at DNA-dense foci (relative to nucleoplasm) in wild-type (Eset25), 2KO and 5KO fibroblasts, as described in (b). The box lower and upper limits correspond to the 25th and 75th percentiles, respectively, with the centre line corresponding to the median. Whiskers extend up to 1.5 times the interquartile distance according to Tukey’s method, and individual points are outliers. The number of analysed cells from three independent experiments are: Eset25 (WT) n = 32 cells, 2KO n = 29 cells, 5KO n = 23 cells. Stars indicate statistical significance compared to wild-type cells (Brown–Forsythe and Welch ANOVA test). d Graph showing the FRAP quantification of wild-type EGFP-MeCP2 in wild-type (Eset25) and 5KO fibroblasts. The number of analysed cells from two independent experiments are: Eset25 (WT) n = 28 cells, 5KO n = 26 cells. Error bars: SEM. e Diagram showing two possible responses of MeCP2-containing foci to variations in expression levels. f Live-cell imaging of Mecp2 knockout fibroblasts transfected with varying levels of wild-type EGFP-MeCP2. Cells were divided into three expression categories (low, medium, high) and images are shown at three levels of brightness to enable comparison. Scale bars: 5 µm. g Scatterplots showing the relationship between total MeCP2 expression levels within cells (as described in (f)) and different parameters associated with MeCP2 foci. Values were plotted for individual cells (n = 101 cells) from two independent experiments. MeCP2 fluorescence (total and within foci) was expressed on a logarithmic scale to account for the broad distribution of the data. The calculated R2 values indicate a significant correlation only between total MeCP2 expression and MeCP2 concentration within foci.
Fig. 3
Fig. 3. MeCP2 displays a diffuse nuclear distribution in most mammalian species.
a Phylogenetic tree showing the mammalian species used in this study (from NCBI Taxonomy). b Live-cell imaging of the indicated mammalian cell lines transfected with wild-type EGFP-MeCP2. Hoechst staining and a CHD-mCherry reporter were used to visualise DNA and heterochromatin, respectively. Scale bars: 5 µm. c Graph showing quantification of MeCP2 nuclear distribution (spotty, mixed, diffuse) in all studied mammalian species, as described in (b) and Supplementary Fig. 6. The number of analysed cells from at least two independent experiments are: Mouse n = 75 cells, Rat n = 19 cells, Guinea pig n = 46 cells, Chinese hamster n = 51 cells, Sheep n = 28 cells, Cow n = 43 cells, Red deer n = 25 cells, Roe deer n = 20 cells, Red river hog n = 26 cells, Warthog n = 36 cells, Pig n = 24 cells, Horse n = 25 cells, Cat n = 24 cells, Dog n = 23 cells, Green monkey n = 58 cells, Human n = 96 cells. Data are presented as mean values ± SD. d Live-cell imaging of human postmitotic neurons (LUHMES cells) expressing endogenously tagged MeCP2-mCherry (representative images from two independent experiments). Hoechst staining was used to visualise DNA. Scale bar: 5 µm. e Immunofluorescence of endogenous MeCP2 in mouse and rat brain cortex (representative images from multiple sections in a single animal). DAPI staining was used to visualise DNA. Scale bars: 5 µm.
Fig. 4
Fig. 4. MeCP2 foci depend on the presence of abundant satellite DNA repeats.
a Diagram showing two closely related mouse strains used in this study. The Mus musculus genome contains abundant major satellite DNA repeats which cluster at pericentromeric regions, while Mus spretus lacks these repetitive elements. b Fluorescence in situ hybridisation of major satellite DNA (shown at two levels of brightness) combined with immunofluorescence of MeCP2 in Mus musculus (3T3) and Mus spretus cell lines (representative images from two independent experiments). DAPI staining was used to visualise DNA. Scale bars: 5 µm. FISH Fluorescence in situ hybridisation, IF Immunofluorescence. c Ethidium bromide staining (left) and Southern blot (right) using a probe for major satellite DNA with Mus musculus and Mus spretus genomic DNA digested with a methylation-sensitive (HpyCH4IV) or -insensitive (ApoI) restriction enzyme (representative images from two independent experiments). MW molecular weight marker. d Immunofluorescence of antibody stained 5-methylcytosine in Mus musculus (3T3) and Mus spretus cell lines (representative images from two independent experiments). Scale bars: 5 µm. e Live-cell imaging of Mus musculus (3T3) and Mus spretus cell lines transfected with wild-type EGFP-MeCP2. Hoechst staining and a CHD-mCherry reporter were used to visualise DNA and heterochromatin, respectively. Scale bars: 5 µm. f Graph showing the quantification of MeCP2 nuclear distribution (spotty, mixed, diffuse) in Mus musculus (3T3) and Mus spretus cell lines, as described in (e). The number of analysed cells from at least two independent experiments are: M. musculus (3T3) n = 38 cells, M. spretus (line 1) n = 56 cells, M. spretus (line 2) n = 23 cells. Data are presented as mean values ± SD. g Model for differential MeCP2 nuclear distribution in mammalian species. In most species, including humans, methylated DNA elements are interspersed along the genome leading to a diffuse MeCP2 nuclear pattern. In some cases, like Mus musculus, methylated DNA repeats cluster into 'chromocenters' leading to spotty MeCP2 signal.

References

    1. Lewis JD, et al. Purification, sequence, and cellular localization of a novel chromosomal protein that binds to Methylated DNA. Cell. 1992;69:905–914. doi: 10.1016/0092-8674(92)90610-O. - DOI - PubMed
    1. Guo JU, et al. Distribution, recognition and regulation of non-CpG methylation in the adult mammalian brain. Nat. Neurosci. 2014;17:215–222. doi: 10.1038/nn.3607. - DOI - PMC - PubMed
    1. Chen L, et al. MeCP2 binds to non-CG methylated DNA as neurons mature, influencing transcription and the timing of onset for Rett syndrome. Proc. Natl Acad. Sci. 2015;112:5509–5514. doi: 10.1073/pnas.1505909112. - DOI - PMC - PubMed
    1. Gabel HW, et al. Disruption of DNA-methylation-dependent long gene repression in Rett syndrome. Nature. 2015;522:89–93. doi: 10.1038/nature14319. - DOI - PMC - PubMed
    1. Kinde B, Wu DY, Greenberg ME, Gabel HW. DNA methylation in the gene body influences MeCP2-mediated gene repression. Proc. Natl Acad. Sci. 2016;113:15114–15119. doi: 10.1073/pnas.1618737114. - DOI - PMC - PubMed

Publication types