. 2024 May 8;10(1):221.
doi: 10.1038/s41420-024-01971-y.

Unique lipid composition maintained by extracellular blockade leads to prooncogenicity

Affiliations

Unique lipid composition maintained by extracellular blockade leads to prooncogenicity

Kai Kudo et al. Cell Death Discov. .

Abstract

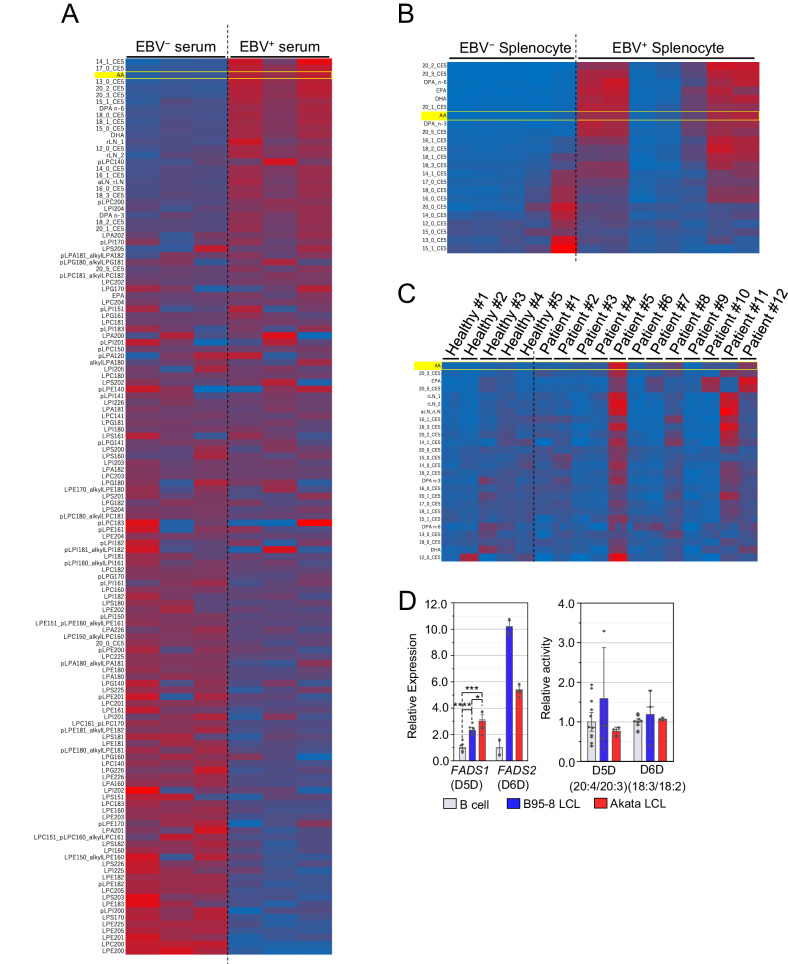
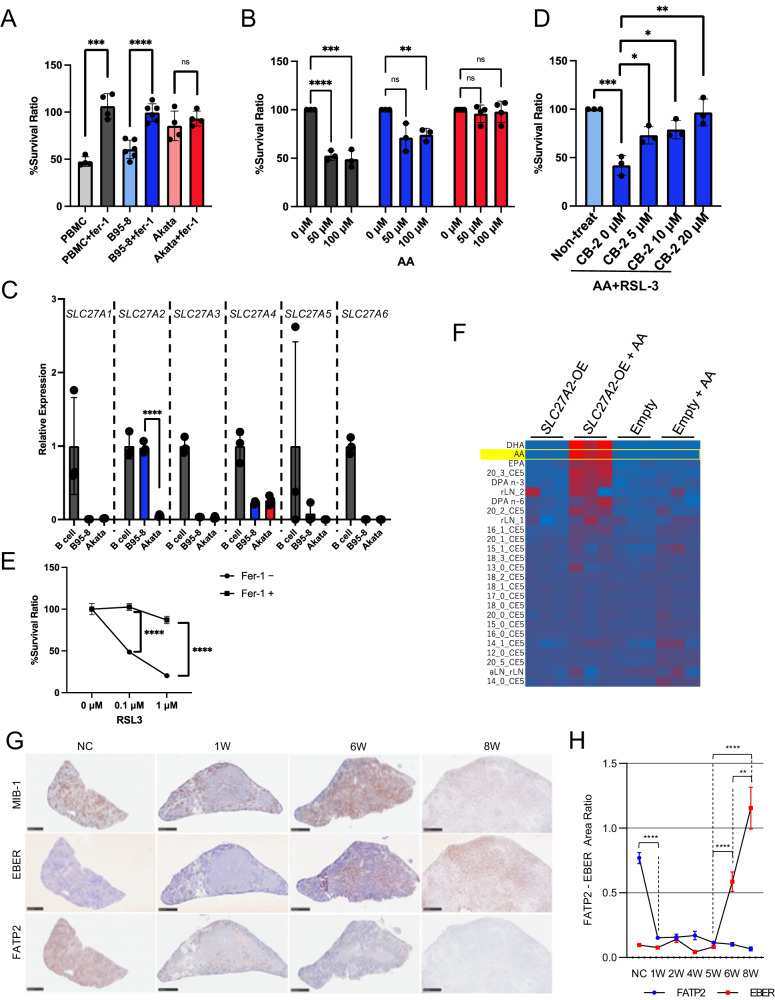
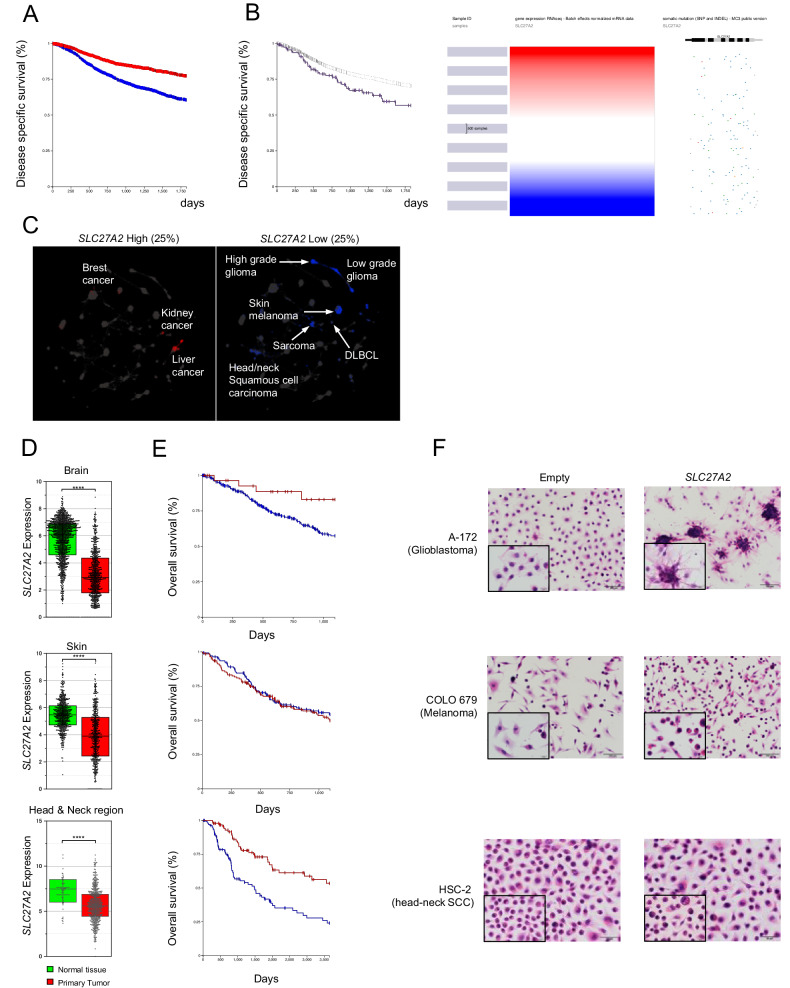
Lipid-mediated inflammation is involved in the development and malignancy of cancer. We previously demonstrated the existence of a novel oncogenic mechanism utilizing membrane lipids of extracellular vesicles in Epstein-Barr virus (EBV)-positive lymphomas and found that the lipid composition of lymphoma cells is skewed toward ω-3 fatty acids, which are anti-inflammatory lipids, suggesting an alteration in systemic lipid composition. The results showed that arachidonic acid (AA), an inflammatory lipid, was significantly reduced in the infected cells but detected at high levels in the sera of EBV-positive patients lead to the finding of the blockade of extracellular AA influx by downregulating FATP2, a long-chain fatty acid transporter that mainly transports AA in EBV-infected lymphoma cells. Low AA levels in tumor cells induced by downregulation of FATP2 expression confer resistance to ferroptosis and support tumor growth. TCGA data analysis and xenograft models have demonstrated that the axis plays a critical role in several types of cancers, especially poor prognostic cancers, such as glioblastoma and melanoma. Overall, our in vitro, in vivo, in silico, and clinical data suggest that several cancers exert oncogenic activity by maintaining their special lipid composition via extracellular blockade.


Conflict of interest statement

The authors declare no competing interests.

Figures

Fig. 1
Fig. 1. EBV-related disorders show accumulation of AA in serum.
Fatty acid composition of serum collections (A) or splenocytes (B) derived from human hematopoietically humanized mice (n = 3), and those with EBV (Akata-strain) infection (n = 3). C Fatty acid composition of human serum derived from healthy volunteers (n = 5), and patients of EBV-associated disorders (n = 12). All samples were independently measured three times. D mRNA expressions of FADS1 and FADS2 (left), and intracellular activity of D5D and D6D (right) in B cell derived from healthy donor (gray), B95-8 LCL (blue), and Akata LCL (red).
Fig. 2
Fig. 2. Blockade of serum AA influx due to SLC27A2 downregulation results in resistance against ferroptosis in Akata LCLs.
A PBMCs derived from healthy volunteers (n = 4), B95-8 LCLs (n = 6), and Akata LCLs (n = 4) were treated with 1 μM RSL-3 (a ferroptosis inducer) with or without 2 μM Fer-1 (a ferroptosis inhibitor), and each cell viability was detected as fluorescence intensity in Alamar blue assay and calculated relative to the value in RSL-3(−) cells. B Peripheral B cells derived from healthy volunteers (n = 3; gray), B95-8 LCLs (n = 3, blue), and Akata LCLs (n = 4, Red) were treated with 0.1 µM of RSL-3 and 0, 50, and 100 µM of AA. Each cell viability was detected as fluorescence intensity in Alamar blue assay and calculated relative to the value in AA-free group. C Relative expression SLC27A family mRNA in B95-8 LCLs (n = 3 in each) and Akata LCLs (n = 3 in each), relative to those in peripheral B cells derived from healthy volunteers (n = 3). D B95-8 LCLs (n = 3) were treated with CB-2 (a FATP2 inhibitor) at the indicated concentrations accompanied with 0.1 μM of RSL-3 and 100 μM of AA after 3 h of pre-incubation. Each cell viability was detected as fluorescence intensity in Alamar blue assay and calculated relative to the value in CB-2-free group. E SLC27A2-overexpressed Akata LCLs were treated with 0, 0.1, and 1 µM of RSL-3 and 100 µM of AA with or without 2 µM of Ferrostatin-1 (n = 3 in each). Survival ratio was calculated relative to the value of RSL-3-free group. F SLC27A2-overexpressed Akata LCLs (SLC27A2-OE) and empty vector-transfected Akata LCLs (Empty) were incubated with or without 100μM of AA for an hour and then cellular fatty acid compositions were measured (n = 3 in each). Representative in situ hybridization of EBER and immunohistochemical staining of MIB-1 (Ki-67) and FATP2 in the spleen of EBV-infected mice. Tissues were collected at the indicated periods after EBV infection (G). Scale bar, 500 nm. The ratios of positive area /total cells for EBER and FATP2 were measured (H).
Fig. 3
Fig. 3. SLC27A2 overexpression negatively regulates in vivo tumor growth of Akata LCLs.
A Development of a xenograft tumor model in NOG mice. SLC27A2-overexpressed Akata LCLs (SLC27A2) and control Akata LCLs (Empty) were injected subcutaneously into the left and right shoulder of the same individual (1 × 106 cells/50 µl/injection). Tumors were resected 5 weeks after injection (B), then measured tumor weight (C). D Microscopic appearance of injected tumors. Immunohistochemically (central), human CD19 (red), and mouse F4/80 (blue) were stained with fluorescent-conjugated antibodies. In Liperfluo staining (right), the red and blue signals indicate the presence of lipid peroxides and nuclei (DAPI), respectively. E Survival analyses of DLBCL patients: FATP2(+) (n = 7) and FATP2(−) (n = 6) cases in EBV-positive DLBCL and FATP2(+) (n = 47) and FATP2(−) (n = 39) cases in EBV-negative DLBCL.
Fig. 4
Fig. 4. The impact of downregulation of FATP2 in human cancers.
A Impact of SLC27A2 expression on prognosis in all cancers extracted from the TCGA database. Survival curves were generated using the top 25% (2318 cases) and bottom 25% (2327 cases) of SLC27A2 expression within the 9330 total extracted cases. Analysis was performed on UCSC Xena. B Impact of mutation with SLC27A2 expression on prognosis in all cancers extracted from the TCGA database. Survival curves were generated using the cases which have a mutation (117 cases) and no mutation (8670 cases) in SLC27A2. Analysis was performed on UCSC Xena. C Tumor map projection of all cancer patient data extracted from the TCGA database; only the top 25% and bottom 25% of SLC27A2 expression cases were extracted and projected onto the map. D Comparison of SLC27A2 expression levels in cancer patients and normal tissue at each of the three SLC27A2low histologic types (glioblastoma, melanoma, and HNSQ). E Relationship between SLC27A2 expression and prognosis in cancer cases extracted in (D). Analysis was performed on UCSC Xena. F Control vector-transfected cells (Empty) and SLC27A2-overexpressed cells (SLC27A2) were stained with hematoxylin and eosin. Values in (D) are presented as mean ± SEM. Student’s t-test: ****p < 0.0001.
Fig. 5
Fig. 5. Anti-tumor effects mediated by AA influx and ferroptosis in SLC27A2low tumors.
A Ferroptosis induction and Liperfluo staining in SLC27A2-overexpressed A172 cells. RSL-3 and fer-1 were added at 0.1 and 2 μM, respectively. B Representative Ki-67 immunostaining of A172 cell administered brain tissue. The percentages of Ki-67-positive and negative cells were calculated by observation of 20 high-power fields of view in the administrated hemisphere. C Macrograph of subcutaneous tumor tissue with COLO679 cells. Tumor tissue was resected 28 days after tumor cell administration. D The weight of COLO679 subcutaneous tumor tissue (n = 4). E Representative micrographs of COLO679 subcutaneous tumor tissue. The upper panel shows the HE-stained image and the lower panel shows the MelanA immunostained images. F MelanA positivity in COLO679 subcutaneous tumor tissue. MelanA-positive regions were extracted from the whole area of tumor tissue and quantified by ImageJ (n = 4). Values in (B, D, F) represent the mean ± SD. Student’s t-test: *p < 0.05, ****p < 0.0001.

References

    1. Fu Y, Zou T, Shen X, Nelson PJ, Li J, Wu C, et al. Lipid metabolism in cancer progression and therapeutic strategies. MedComm. 2021;2:27–59. doi: 10.1002/mco2.27. - DOI - PMC - PubMed
    1. Snaebjornsson MT, Janaki-Raman S, Schulze A. Greasing the wheels of the cancer machine: the role of lipid metabolism in cancer. Cell Metab. 2020;31:62–76. doi: 10.1016/j.cmet.2019.11.010. - DOI - PubMed
    1. Liu X, Zhang P, Xu J, Lv G, Li Y. Lipid metabolism in tumor microenvironment: novel therapeutic targets. Cancer Cell Int. 2022;22:224. doi: 10.1186/s12935-022-02645-4. - DOI - PMC - PubMed
    1. Cheng C, Geng F, Cheng X, Guo D. Lipid metabolism reprogramming and its potential targets in cancer. Cancer Commun. 2018;38:27. doi: 10.1186/s40880-018-0301-4. - DOI - PMC - PubMed
    1. Wang D, Dubois RN. Eicosanoids and cancer. Nat Rev Cancer. 2010;10:181–93. doi: 10.1038/nrc2809. - DOI - PMC - PubMed