. 2024 May 8;15(1):3873.
doi: 10.1038/s41467-024-48118-2.

Repression of developmental transcription factor networks triggers aging-associated gene expression in human glial progenitor cells

Affiliations

Repression of developmental transcription factor networks triggers aging-associated gene expression in human glial progenitor cells

John N Mariani et al. Nat Commun. .

Abstract

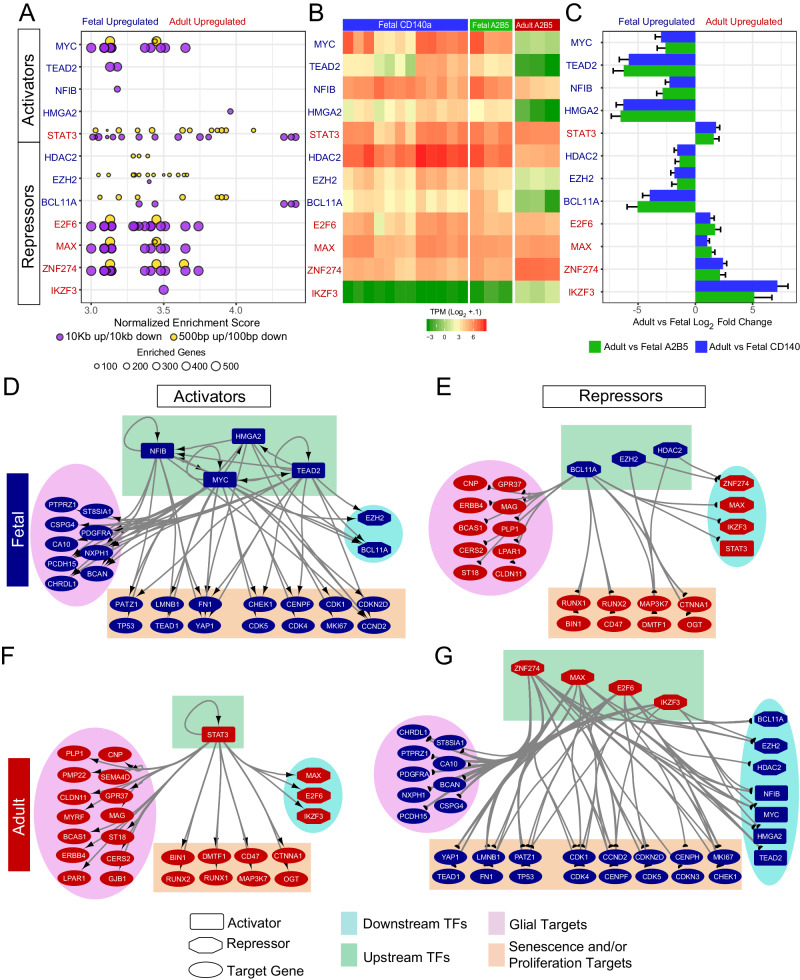
Human glial progenitor cells (hGPCs) exhibit diminished expansion competence with age, as well as after recurrent demyelination. Using RNA-sequencing to compare the gene expression of fetal and adult hGPCs, we identify age-related changes in transcription consistent with the repression of genes enabling mitotic expansion, concurrent with the onset of aging-associated transcriptional programs. Adult hGPCs develop a repressive transcription factor network centered on MYC, and regulated by ZNF274, MAX, IKZF3, and E2F6. Individual over-expression of these factors in iPSC-derived hGPCs lead to a loss of proliferative gene expression and an induction of mitotic senescence, replicating the transcriptional changes incurred during glial aging. miRNA profiling identifies the appearance of an adult-selective miRNA signature, imposing further constraints on the expansion competence of aged GPCs. hGPC aging is thus associated with acquisition of a MYC-repressive environment, suggesting that suppression of these repressors of glial expansion may permit the rejuvenation of aged hGPCs.


Conflict of interest statement

Dr. Goldman is also a part-time employee and stockholder of Sana Biotechnology (Seattle, WA), and his lab receives sponsored research support for projects unrelated to the present work from Sana. Dr. Goldman is also a stockholder and SAB member of CNS2, Inc.; his lab also receives research support from CNS2. N.P.T.H is now a Sana employee, and D.C.M. is a consultant to Sana, in both cases for unrelated work. None of the other authors have any known potential conflicts of interest with regards to this work.

Figures

Fig. 1
Fig. 1. Transcriptomic characterization of FACS-isolated human fetal GPCs.
A Workflow of bulk and scRNA-Sequencing of CD140a+, CD140a-, and A2B5+/PSA-NCAM--selected 2nd trimester human fetal brain isolates. B Principal component analysis of all samples across two batches. Numbers indicate pairing of samples (fetal CD140+ n = 8; CD140a-, n = 5; A2B5+/PSA-NCAM-, n = 3; biologically independent samples). C Venn diagram of CD140a+ vs CD140a- and CD140+ vs A2B5+/PSA-NCAM- differentially-expressed gene sets (FDR < 0.01 and absolute log2-fold change > 1, calculated with DESeq2). D Log2-fold changes of significant curated genes for each geneset. Missing bars were not significant. E UMAP plot of the primary cell types identified during scRNA-Seq analysis of all FACS-isolated hGPCs derived from 20 week gestational age human fetal VZ/SVZ. F-G UMAPs of PSA-NCAM-/A2B5+ (F) vs. CD140a+ (G) human fetal cells. H Violin plots of cell type-selective marker genes. I Select feature plots of transcription factor regulons (calculated in SCENIC), predicted to be significantly activated in fetal hGPCs (FDR < 0.01, Wilcoxon rank-sum test). Source data are provided as a Source Data file. Error bars ± SEM.
Fig. 2
Fig. 2. Adult human GPCs are transcriptionally and functionally distinct from fetal hGPCs.
A Workflow of bulk RNA-Seq analysis of human adult and fetal GPCs. B Principal component analysis of all samples across three batches (fetal CD140a+, n = 12; fetal A2B5+/PSA-NCAM-, n = 3; adult A2B5+, n = 3; biologically independent samples). C Venn Diagram of Adult vs Fetal differentially expressed gene sets. (FDR < 0.01, Log2FC > 1, calculated with DESeq2). D IPA network of curated significant terms and genes (FDR < 0.001). Node size is proportionate to node degree. Color corresponds to enrichment in either adult (red) or fetal (blue) populations. E Bar plots of significant IPA terms by module. Z-Scores indicate predicted activation in fetal (blue) or adult (red) hGPCs. F Log2-fold changes and heatmap of network gene TPMs. Source data are provided as a Source Data file. Error bars ± SEM.
Fig. 3
Fig. 3. Inference of transcription factor activity implicates a set of transcriptional repressors in the establishment of adult hGPC identity.
A Normalized enrichment score plots of significantly enriched transcription factors predicted to be active in fetal and adult GPCs. Each dot is a motif whose size indicates how many genes in which that motif is predicted to be active; color represents the window around the promoter at which that motif was enriched. B Heatmap of enriched TF TPMs, and (C) log-fold changes for both fetal hGPC isolates vs adult GPCs (fetal CD140a+, n = 12; fetal A2B5+/PSA-NCAM-, n = 3; adult A2B5+, n = 3; biologically independent samples). DG Predicted direct transcription factor activity of curated genes split into (D) fetal activators; (E) fetal repressors; (F) adult activators; and (G) adult repressors. Color indicates differential expression in adult (red) or fetal (blue) hGPCs; shape dictates type of node (octagon, repressor; rectangle, activator; oval, other target gene). Boxed and circled genes indicate functionally-related genes contributing to either glial progenitor/oligodendrocyte identity, senescence/proliferation targets, or upstream or downstream TFs that were also deemed activated. Source data are provided as a Source Data file. Error bars ± SEM.
Fig. 4
Fig. 4. Induction of features of aging via adult hGPC-enriched repressors.
A Schematic outlining the structure of four distinct doxycycline (Dox)-inducible EGFP lentiviral expression vectors, each encoding one of the transcriptional repressors: E2F6, IKZF3, MAX, or ZNF274. B Induced pluripotent stem cell (iPSC)-derived hGPC cultures (line C27,) were transduced with a single lentivirus or vehicle for 1 day, and then treated with Dox for the remainder of the experiment. At 3, 7 and 10 days following initiation of Dox-induced transgene expression, hGPCs were isolated via FACS for qPCR. C qPCRs of Dox-treated cells showing expression of each transcription factor, vs matched timepoint controls (n = 3–5 independent experiments/condition) D qPCR fold-change heatmap of select aging related genes. Within timepoint comparisons to controls were calculated via post hoc estimated marginal means tests of linear models following regression of a cell batch effect. E Immunocytochemistry for p16 (left) and p21 (right) in EGFP+ cells at 7 days post infection (n = 3 biologically independent samples). Post hoc pairwise comparisons of each overexpression condition to control in (CE) were calculated via estimated marginal means tests of linear models, following regression of a cell batch effect. FDR adjusted p-values: *<0.05, ** <0.01, *** <0.001. Source data are provided as a Source Data file; exact p values are listed there. Error bars ± SEM.
Fig. 5
Fig. 5. E2F6 and ZNF274 overexpression each induce an aged transcriptome in hGPCs.
scRNA-sequencing of E2F6 and ZNF274 overexpression (OE) with a GFP lentivirus used as control, 7 days following doxycycline (Dox) treatment. A UMAPS of isolated GPC populations showing PDGFRA expression in addition to E2F6 and ZNF274 for demonstration of overexpression (EGFP CTR: 921 GPCs; E2F6 OE: 1085 GPCs, ZNF274 OE—906 GPCs). B Venn diagram of both differentially expressed genesets (FDR < 0.05, Log2FC > 0.25). C, D Upset plots indicating repressed genes shared between fetal vs adult hGPCs and E2F6 I or ZNF274 (D) OE cells, and their respective targets, as determined via rCisTarget from these scRNA-seq OE experiments and the fetal vs adult bulk RNA-seq experiments. E Scoring via AUCell of the rCisTarget determined regulons of either E2F6 or ZNF274. Black lines indicate median expression. F, G Heatmaps indicating Log2 fold changes and significances of adult vs. fetal GPCs (F) and E2F6 or ZNF274 vs EGFP CTR (G). H Significant direct targets of E2F6 or ZNF274 OE. I qPCR validation of select direct targets (indicated in blue in F; n = 4 biologically independent samples). Central lines indicate the median, boxes show the interquartile range, and the whiskers indicate 1.5 times the interquartile range. Outliers are plotted beyond the whiskers. J Dot plot of curated IPA terms (FDR < 0.05). K KI67 staining of EGFP+ cells (Dox Ctr is of DAPI+, n = 3 biologically independent samples). L. β-Galactosidase+ staining of DAPI+ cells (n = 3 biologically independent samples). Statistics for I, K, and L were calculated via estimated marginal means tests of linear models, following regression of cell batch effect. FDR adjusted p-values: *<0.05, **<0.01, ***<0.001, ****<0.0001. Source data are provided as a Source Data file; exact p values are listed there. Error bars ± SEM.
Fig. 6
Fig. 6. MicroRNAs drive hGPC transcriptional maturation in tandem with transcription factor activity.
A. Principal component analysis of miRNA microarray samples from human A2B5+ adult and CD140a+ fetal GPCs (n = 4 biologically independent samples). B. Log2 fold change bar plots and heatmap of all differentially expressed miRNAs (FDR < 0.01, calculated in limma). C Characterization bubble plot of enrichment of miRNAs, versus the average log2 FC of its predicted gene targets. D, E Curated signaling networks of (D) fetal (top) and (E) adult (bottom) enriched miRNAs and their predicted targets. Source data are provided as a Source Data file. Error bars ± SEM.

References

    1. Raff MC, Miller RH, Noble M. A glial progenitor cell that develops in vitro into an astrocyte or an oligodendrocyte depending on culture medium. Nature. 1983;303:390–396. doi: 10.1038/303390a0. - DOI - PubMed
    1. Ffrench-Constant C, Raff MC. Proliferating bipotential glial progenitor cells in adult rat optic nerve. Nature. 1986;319:499–502. doi: 10.1038/319499a0. - DOI - PubMed
    1. Wolswijk G, Noble M. Identification of an adult-specific glial progenitor cell. Development. 1989;105:387–400. doi: 10.1242/dev.105.2.387. - DOI - PubMed
    1. Wren D, Wolswijk G, Noble M. In vitro analysis of the origin and maintenance of O-2aadult progenitor cells. J. Cell Biol. 1992;116:167–176. doi: 10.1083/jcb.116.1.167. - DOI - PMC - PubMed
    1. Gao FB, Raff M. Cell size control and a cell-intrinsic maturation program in proliferating oligodendrocyte precursor cells. J. Cell Biol. 1997;138:1367–1377. doi: 10.1083/jcb.138.6.1367. - DOI - PMC - PubMed

Publication types

MeSH terms