. 2024 May 8;14(1):10555.
doi: 10.1038/s41598-024-60664-9.

Periodic heat waves-induced neuronal etiology in the elderly is mediated by gut-liver-brain axis: a transcriptome profiling approach

Affiliations

Periodic heat waves-induced neuronal etiology in the elderly is mediated by gut-liver-brain axis: a transcriptome profiling approach

Subhajit Roy et al. Sci Rep. .

Abstract

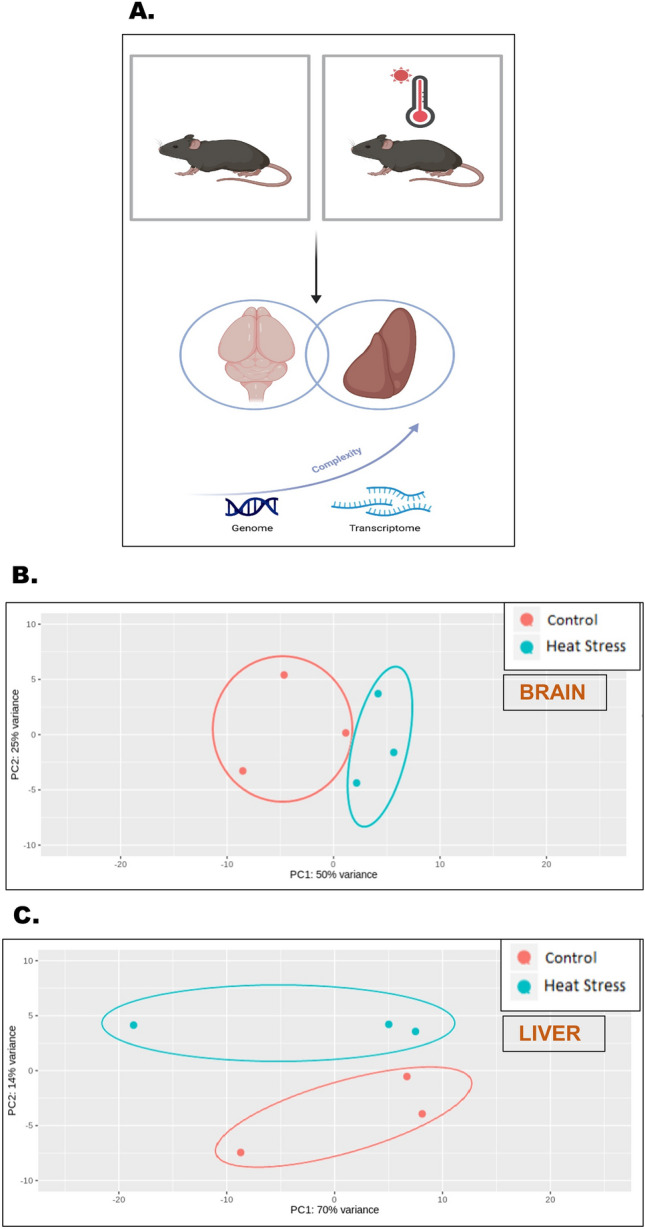
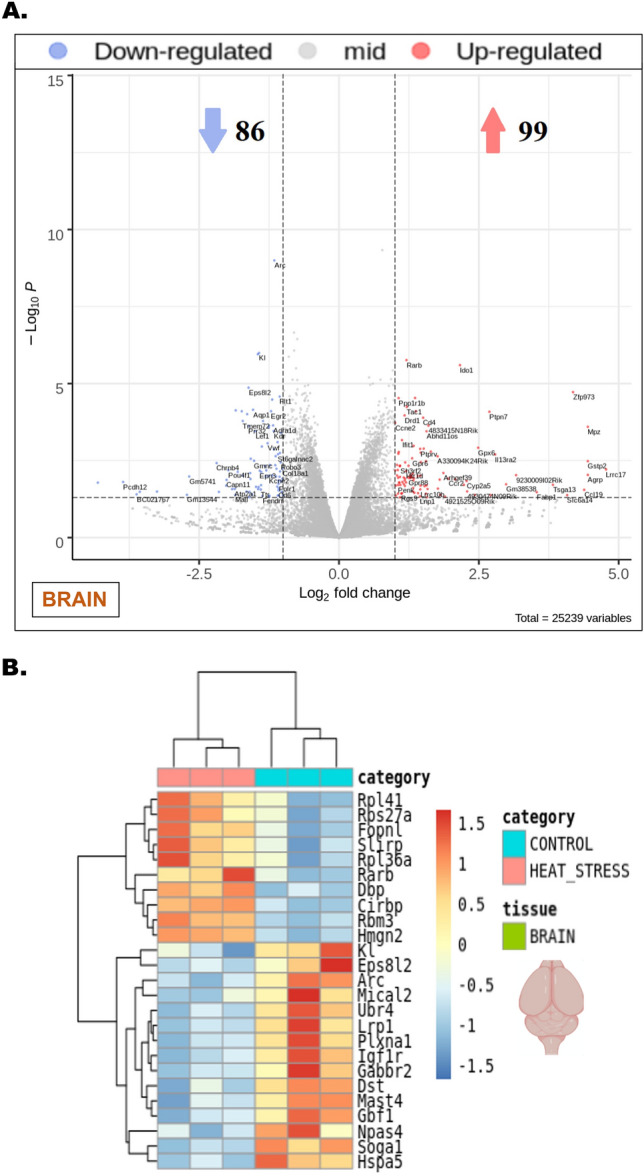
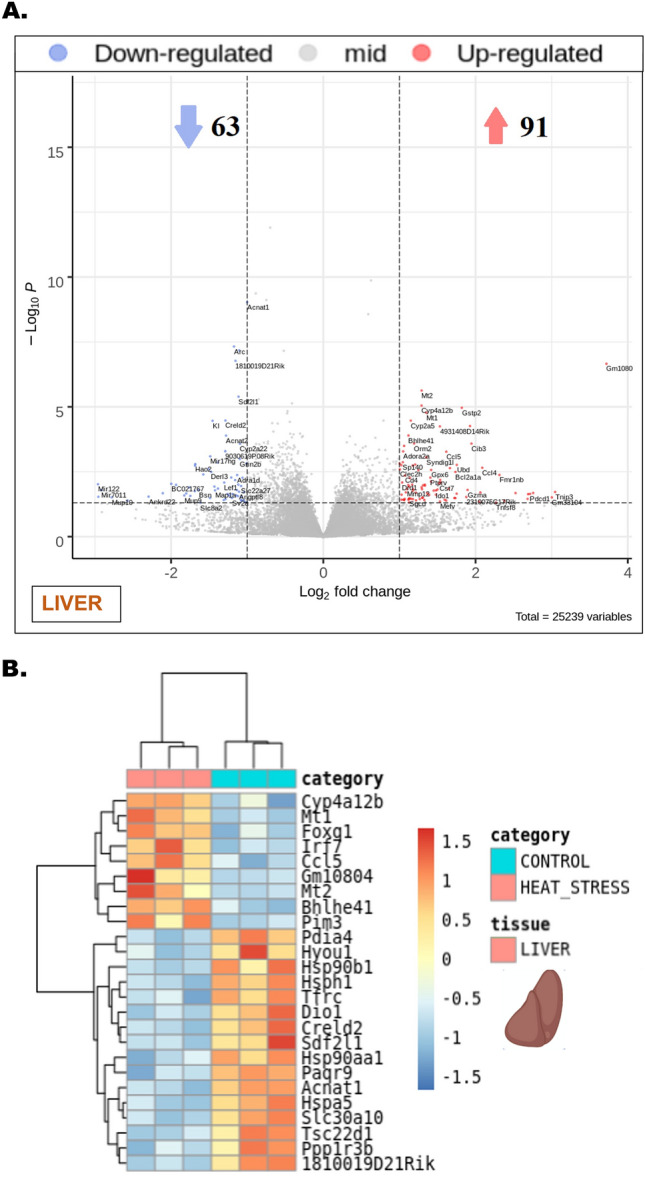
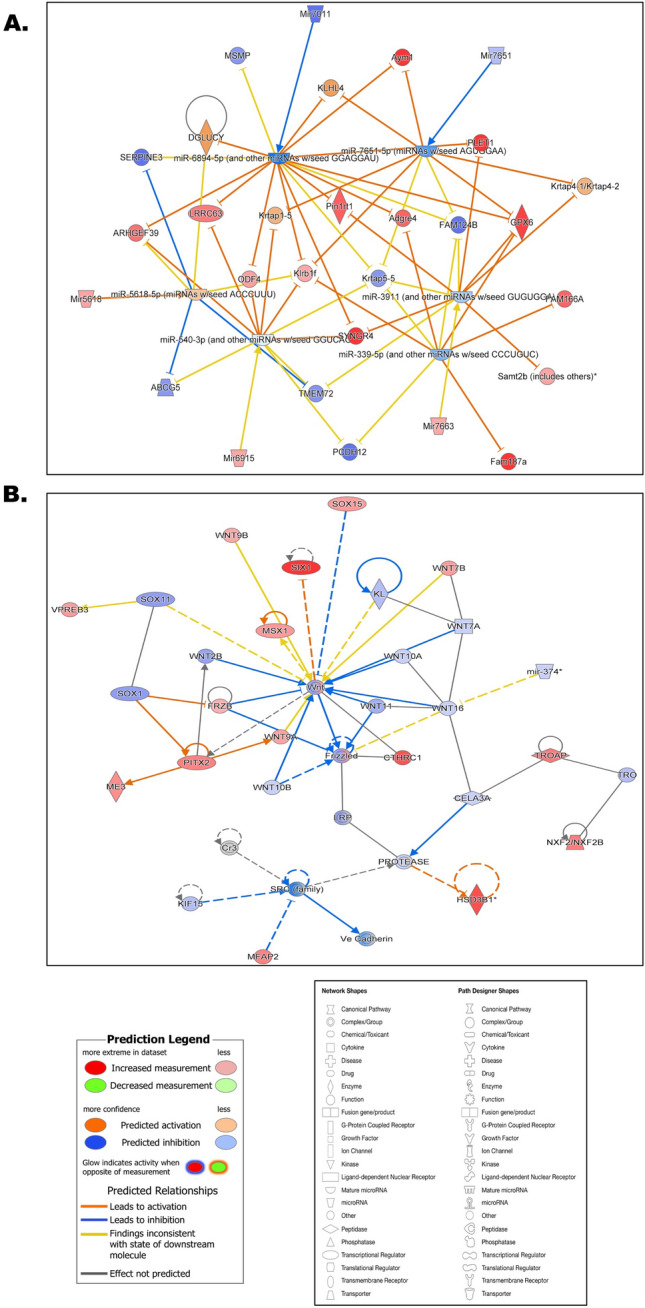
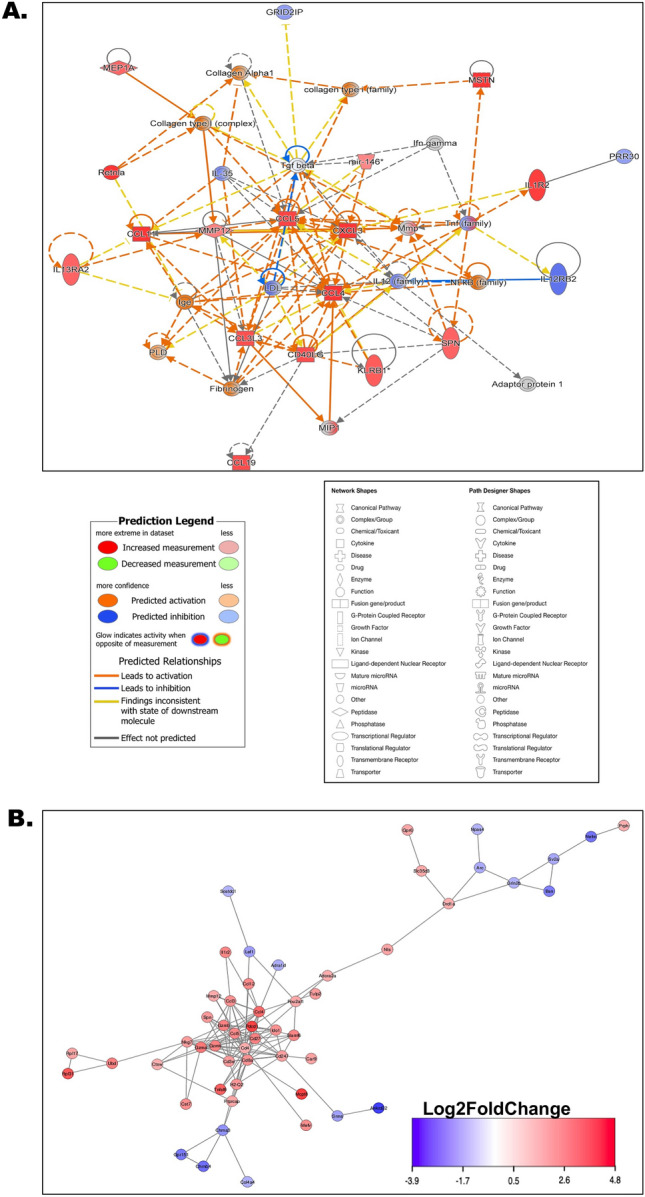
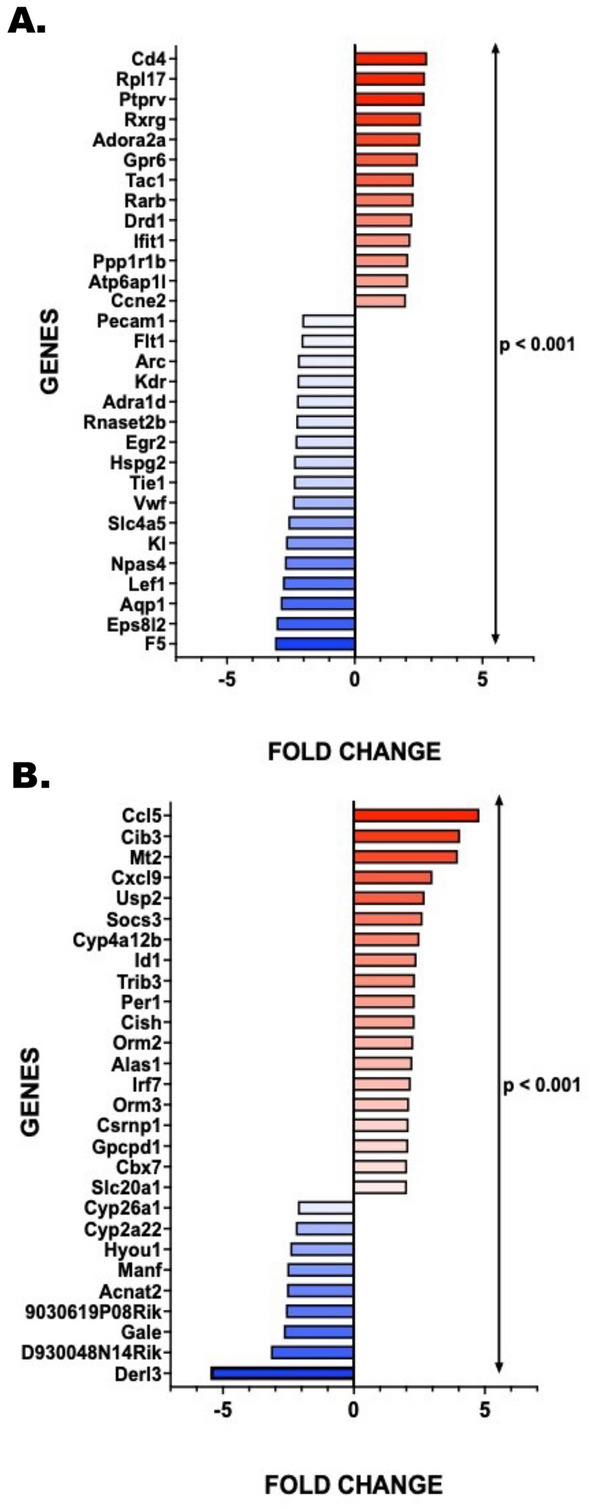
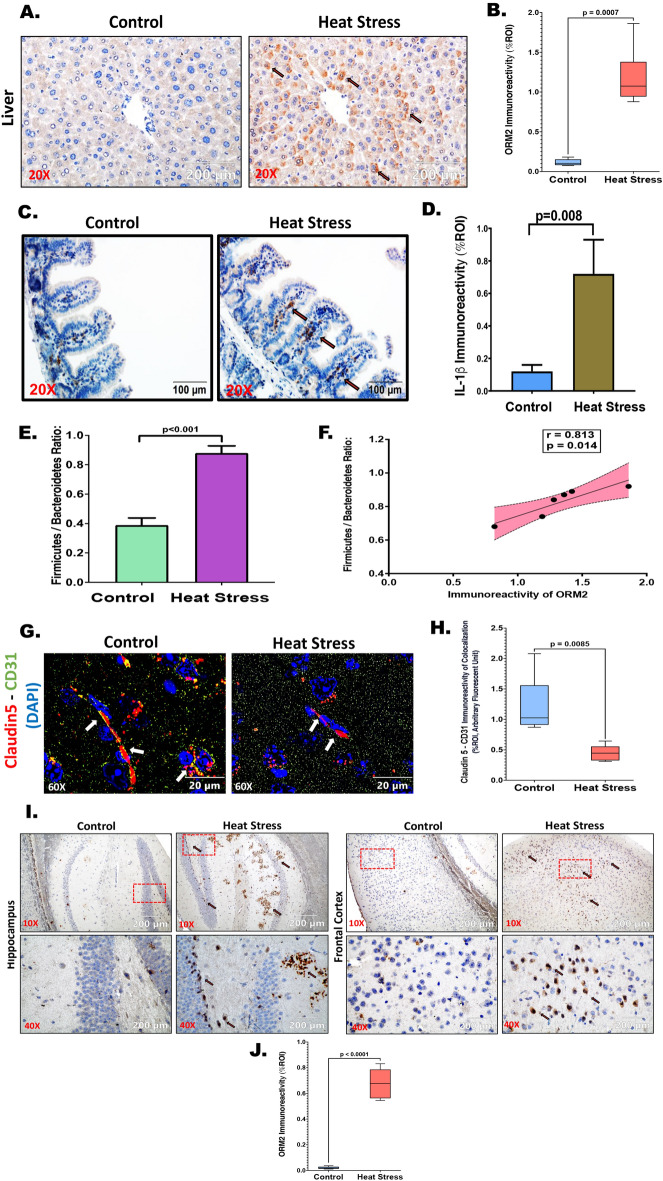
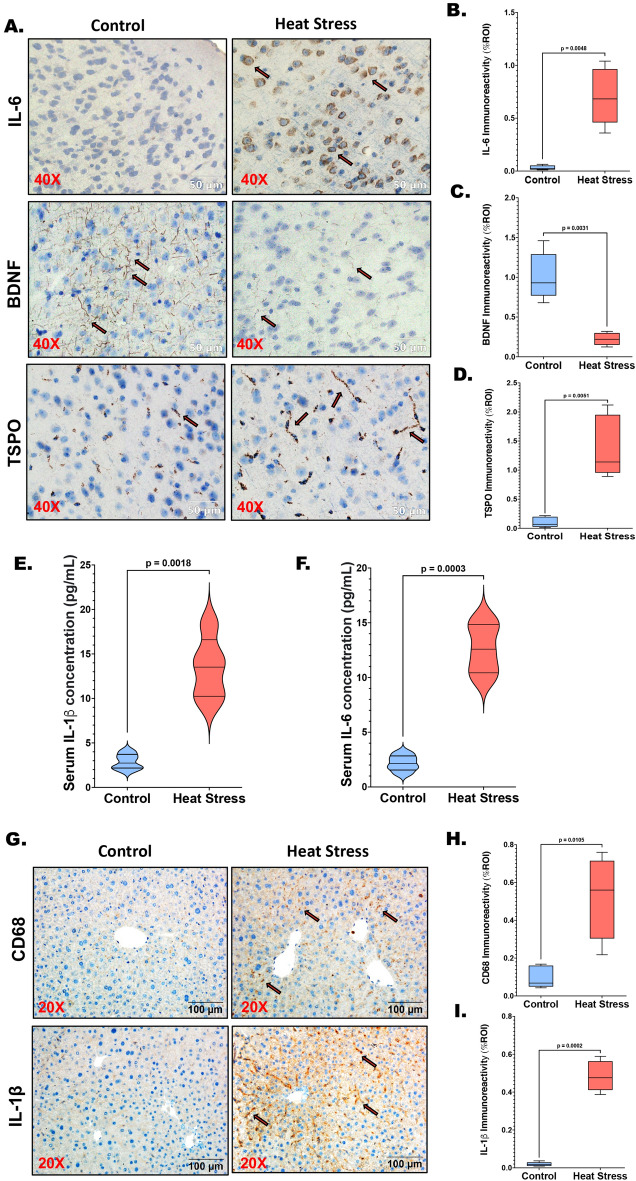
Heat stress exposure in intermittent heat waves and subsequent exposure during war theaters pose a clinical challenge that can lead to multi-organ dysfunction and long-term complications in the elderly. Using an aged mouse model and high-throughput sequencing, this study investigated the molecular dynamics of the liver-brain connection during heat stress exposure. Distinctive gene expression patterns induced by periodic heat stress emerged in both brain and liver tissues. An altered transcriptome profile showed heat stress-induced altered acute phase response pathways, causing neural, hepatic, and systemic inflammation and impaired synaptic plasticity. Results also demonstrated that proinflammatory molecules such as S100B, IL-17, IL-33, and neurological disease signaling pathways were upregulated, while protective pathways like aryl hydrocarbon receptor signaling were downregulated. In parallel, Rantes, IRF7, NOD1/2, TREM1, and hepatic injury signaling pathways were upregulated. Furthermore, current research identified Orosomucoid 2 (ORM2) in the liver as one of the mediators of the liver-brain axis due to heat exposure. In conclusion, the transcriptome profiling in elderly heat-stressed mice revealed a coordinated network of liver-brain axis pathways with increased hepatic ORM2 secretion, possibly due to gut inflammation and dysbiosis. The above secretion of ORM2 may impact the brain through a leaky blood-brain barrier, thus emphasizing intricate multi-organ crosstalk.

Keywords: Climate change; Gut-liver-brain axis; Human health; Hyperthermia; ORM2; RANTES.


Conflict of interest statement

The authors declare no competing interests.

Figures

Figure 1
Figure 1
Periodic heat stress showed distinctive gene expression patterns in brain and liver tissues of aging mice. (A) Schematic representation of the basic experimental design. (B) Principal component analysis plot of brain tissues comparing the differential gene expressions between the control (red) and heat stress (blue) groups, Principal component 1 (PC1) and 2 (PC2) plotted along abscissa and ordinate respectively (PC1 at 25% and PC2 at 50% variance). (C) Principal component analysis plot of brain tissues comparing the differential gene expressions between the control (red) and heat stress (blue) groups, Principal component 1 (PC1) and 2 (PC2) plotted along abscissa and ordinate respectively (significance was set conventionally with PC1 at 25% and PC2 at 50% variance).
Figure 2
Figure 2
Heat stress-induced transcriptional alterations in the brain. (A) Volcano plot obtained from comparing the brain tissues of control and heat stress groups that were analyzed for differential gene expression changes through transcriptomic profiling, -Log10 P (PFDR) and Log2fold changes were plotted respectively along the ordinate and abscissa with a significance cut off set at PFDR < 0.05, Log2 fold change > 1. The blue dots represented downregulated, and the red dots represented the upregulated genes. Genes represented in gray dots were laid in the zone of no significance. The total number of upregulated and downregulated genes was indicated with similar color arrowheads. (B) The heatmap generated from the brain tissue volcano plot was delineated with a Log2 fold change gradient between 1.5 and − 1.5 where the extremities of red and blue signified up- and downregulations respectively. The same blue and red color code was set to represent the intensity of gene expression falling within the given gradient reflecting the Log2 fold change of individual genes named parallel.
Figure 3
Figure 3
Heat stress-induced transcriptional alterations in the liver. (A) Volcano plot obtained from comparing the liver tissues of control and heat stress groups that were analyzed for differential gene expression changes through transcriptomic profiling, -Log10 P (PFDR) and Log2fold changes were plotted respectively along the ordinate and abscissa with a significance cut off set at PFDR < 0.05, Log2 fold change > 1. The blue dots represented downregulated, and the red dots represented the upregulated genes. Genes represented in gray dots were laid in the zone of no significance. The total number of upregulated and downregulated genes was indicated with similar color arrowheads. (B) The heatmap generated from the liver tissue volcano plot was delineated with a Log2 fold change gradient between 1.5 and − 1.5 where the extremities of red and blue signified up- and downregulations respectively. The same blue and red color code was set to represent the intensity of gene expression falling within the given gradient reflecting the Log2 fold change of individual genes named parallel.
Figure 4
Figure 4
Heat stress-mediated gene expression changes were extrapolated in contributing pathways integral to organ-level pathological manifestations. (A) Biological pathways were predicted based on the differentially expressed gene list obtained by comparing the brain tissues from control and heat stress groups. Significance level set at PFDR < 0.05, threshold at -log(p value) ~ 1.3, Log2 fold change > 1. The gradients of blue and red colors represented the up- and downregulations of the pathways’ respectively. (B) Biological pathways were predicted based on the differentially expressed gene list obtained by comparing the liver tissues from control and heat stress groups. Significance level set at PFDR < 0.05, threshold at -log(p value) ~ 1.3, Log2 fold change > 1. The gradients of blue and red colors represented the up- and downregulations of the pathways’ respectively. (C) Biological pathways were predicted based on the commonly differentially expressed gene list obtained by comparing both the brain and liver tissues from control and heat stress groups. Significance level set at PFDR < 0.05, threshold at -log(p value) ~ 1.3, Log2 fold change > 1. The gradients of blue and red colors represented the up- and downregulations of the pathways’ respectively.
Figure 5
Figure 5
Predicted pathway circuits unveiled a neurological disease network within the brain and an inflammatory control network within the liver tissues following exposure to heat stress. (A) Pathway circuit predicted based on the projected pathways obtained by comparing the brain tissues from control and heat stress groups. Each shape represented different biological kinds of molecules and pathway components and each line connector style represented activation/inhibition status. Detailed legends of prediction, network, and path designer shapes were included in the figure. (B) Pathway circuit predicted based on the projected pathways obtained by comparing the liver tissues from control and heat stress groups. Each shape represented different biological kinds of molecules and pathway components and each line connector style represented activation/inhibition status. Detailed legends of prediction, network, and path designer shapes were included in the figure.
Figure 6
Figure 6
Altered functional interactome emerged in both brain and liver tissues upon exposure to heat stress. (A) Interactome was predicted based on the differentially expressed genes obtained from transcriptomic profiling and then by comparing the brain tissues from control and heat stress groups. Interaction intensities were signified by possible upregulations and downregulations of the respective gene clusters with a Log2 fold change gradient between − 3.9 and − 4.8 where the extremities of red and blue indicated up- and downregulations respectively. The same blue and red color code was set to mark the genes in clusters falling within the given gradient, gene names were provided in each representing shape. The connector line indicated the possible biological strength and interconnections of the interacting gene products. (B) Interactome was predicted based on the differentially expressed genes obtained from transcriptomic profiling and then by comparing the liver tissues from control and heat stress groups. Interaction intensities were signified by possible upregulations and downregulations of the respective gene clusters with a Log2 fold change gradient between − 3.9 and − 4.8 where the extremities of red and blue indicated up- and downregulations respectively. The same blue and red color code was set to mark the genes in clusters falling within the given gradient, gene names were provided in each representing shape. The connector line indicated the possible biological strength and interconnections of the interacting gene products.
Figure 7
Figure 7
The liver-brain connection in heat stress pathologies was projected through a shared predictive pathway circuit and interactome. (A) Pathway circuit predicted based on the projected pathways obtained by comparing both brain and liver tissues from control and heat stress groups. Each shape represented different biological kinds of molecules and pathway components and each line connector style represented activation/inhibition status. Detailed legends of prediction, network, and path designer shapes were included in the figure. (B) Interactome was predicted based on the differentially expressed genes obtained from transcriptomic profiling and then by comparing both brain and liver tissues from control and heat stress groups. Interaction intensities were signified by possible upregulations and downregulations of the respective gene clusters with a Log2 fold change gradient between − 3.9 and − 4.8 where the extremities of red and blue indicated up- and downregulations respectively. The same blue and red color code was set to mark the genes in clusters falling within the given gradient, gene names were provided in each representing shape. The connector line indicated the possible biological strength and interconnections of the interacting gene products.
Figure 8
Figure 8
Expression fold changes of the top genes observed in the brain and liver unveiled potential validatory mediators of the liver-brain axis upon exposure to heat stress. (A) Heat Stress-induced relative mRNA expression changes (18S rRNA normalized) of the top genes in brain samples were converted from log2 fold changes based on the transcriptomic data plotted in bar graphs representing each gene (Control representing the baseline, 0). Negative fold changes were indicated in the blue color gradient whereas positive fold changes were indicated in the red gradient. All p values were derived through an unpaired t-test, with the significance level set at p < 0.05. (B) Heat Stress-induced relative mRNA expression changes (18S rRNA normalized) of the top genes in liver samples were converted from log2 fold changes based on the transcriptomic data plotted in bar graphs representing each gene (Control representing the baseline, 0). Negative fold changes were indicated in a blue color gradient whereas positive fold changes were indicated in a red color gradient. All p values were derived through an unpaired t-test, with the significance level set at p < 0.05.
Figure 9
Figure 9
Heat stress augmented the secretion of hepatic ORM2 and its abundance in the hippocampus along with the frontal cortex, traversing through leaky Blood–Brain-Barrier (BBB). (A) ORM2 immunoreactivity was shown by immunohistochemistry in liver sections from Control and Heat Stress mouse groups; Images were taken at 20X magnification and displayed with a scale of 200 μm. (B) ORM2 immunoreactivity in both groups was measured as arbitrary light units from six separate microscopic fields and plotted along the ordinate. All p values were derived through an unpaired t-test, with the significance level set at p < 0.05. (C) IL-1β immunoreactivity was shown by immunohistochemistry in small intestinal sections from Control and Heat Stress mouse groups; Images were taken at 20X magnification and displayed with a scale of 100 μm. (D) IL-1β immunoreactivity in both groups was measured as arbitrary light units from six separate microscopic fields and plotted along the ordinate. All p values were derived through an unpaired t-test, with the significance level set at p < 0.05. (E) The bar graph was plotted as the difference in ratio value of the relative abundance of the gut microbial phyla Firmicutes and Bacteroidetes compared between control and heat stress groups. The p value was derived through an unpaired t-test, with the significance level set at p < 0.05. (F) A correlation analysis was conducted between the gut dysbiosis marker Firmicutes/Bacteroidetes ratio and the abundance of ORM2 in liver tissues. The correlation plot includes Pearson's linear regression depicted in red, along with a 95% confidence interval. (G) Claudin5 (red) and CD31 (green) were dual labeled through immunofluorescence staining with colocalization (yellow) observed at 60X (oil) magnification. The images were presented with a scale of 20 μm in the brain sections from both the Control and Heat Stress mouse groups. (H) Claudin5-CD31 colocalization (yellow) events in both groups were quantified as arbitrary fluorescent units from six distinct microscopic fields and plotted along the ordinate. All p values were derived through an unpaired t-test, with the significance level set at p < 0.05. (I) ORM2 immunoreactivity was shown by immunohistochemistry in brain sections (hippocampus and frontal cortex) from Control and Heat Stress mouse groups; Images were taken at 10X, 40X magnification displayed with the scale of 200 μm. (J) ORM2 immunoreactivity in both groups was measured as arbitrary light units from six separate microscopic fields and plotted along the ordinate. All p values were derived through an unpaired t-test, with the significance level set at p < 0.05.
Figure 10
Figure 10
Heat stress-induced transcriptomic alterations together with acute phase response ensued in neural, hepatic, and systemic inflammation debilitating synaptic plasticity. (A) IL-6, BDNF, and TSPO immunoreactivities were shown by immunohistochemistry in the brain (frontal cortex) sections from Control and Heat Stress mouse groups; Images were taken at 40X magnification displayed with the scale of 50 μm. (B) IL-6 immunoreactivity in both groups was measured as arbitrary light units from six separate microscopic fields and plotted along the ordinate. All p values were derived through an unpaired t-test, with the significance level set at p < 0.05. (C) BDNF immunoreactivity in both groups was measured as arbitrary light units from six separate microscopic fields and plotted along the ordinate. All p values were derived through an unpaired t-test, with the significance level set at p < 0.05. (D) TSPO immunoreactivity in both groups was measured as arbitrary light units from six separate microscopic fields and plotted along the ordinate. All p values were derived through an unpaired t-test, with the significance level set at p < 0.05. (E) Serum IL-1β level in pg/mL was graphed in violin plots from Control and Heat Stress mouse serum samples (n = 3). All p values were derived through an unpaired t-test, with the significance level set at p < 0.05. (F) Serum IL-6 level in pg/mL was graphed in violin plots from Control and Heat Stress mouse serum samples (n = 3). All p values were derived through an unpaired t-test, with the significance level set at p < 0.05. (G) CD68 and IL-1β immunoreactivities were shown by immunohistochemistry in liver sections from Control and Heat Stress mouse groups; Images were taken at 20X magnification and displayed with a scale of 100 μm. (H) CD68 immunoreactivity in both groups was measured as arbitrary light units from six separate microscopic fields and plotted along the ordinate. All p values were derived through an unpaired t-test, with the significance level set at p < 0.05. (I) IL-1β immunoreactivity in both groups was measured as arbitrary light units from six separate microscopic fields and plotted along the ordinate. All p values were derived through an unpaired t-test, with the significance level set at p < 0.05.

Similar articles

References

    1. Perkins-Kirkpatrick SE, Lewis SC. Increasing trends in regional heatwaves. Nat. Commun. 2020;11:3357. doi: 10.1038/s41467-020-16970-7. - DOI - PMC - PubMed
    1. National Academies, Sciences, and Engineering; Health and Medicine Division; Board on Population Health and Public Health Practice; Committee on the Respiratory Health Effects of Airborne Hazards Exposures in the Southwest Asia Theater of Military Operations. Respiratory Health Effects of Airborne Hazards Exposures in the Southwest Asia Theater of Military Operations. 10.17226/25837 (National Academies Press, Washington, DC, US, 2020). - PubMed
    1. Lugo-Amador, N. M., Rothenhaus, T. & Moyer, P. Heat-related illness. Emerg. Med. Clin. North Am.22, 315–327, viii (2004). 10.1016/j.emc.2004.01.004 - PubMed
    1. Ebi KL, et al. Hot weather and heat extremes: health risks. Lancet. 2021;398:698–708. doi: 10.1016/S0140-6736(21)01208-3. - DOI - PubMed
    1. QuickStats: Percentage Distribution of Heat-Related Deaths,* by Age Group - National Vital Statistics System, United States, 2018–2020. MMWR Morb. Mortal Wkly. Rep.71, 808 (2022). 10.15585/mmwr.mm7124a6 - PubMed

Publication types