. 2024 May 8;14(1):10573.
doi: 10.1038/s41598-024-61369-9.

Discovery of a brain penetrant small molecule antagonist targeting LPA1 receptors to reduce neuroinflammation and promote remyelination in multiple sclerosis

Affiliations

Discovery of a brain penetrant small molecule antagonist targeting LPA1 receptors to reduce neuroinflammation and promote remyelination in multiple sclerosis

Michael M Poon et al. Sci Rep. .

Abstract

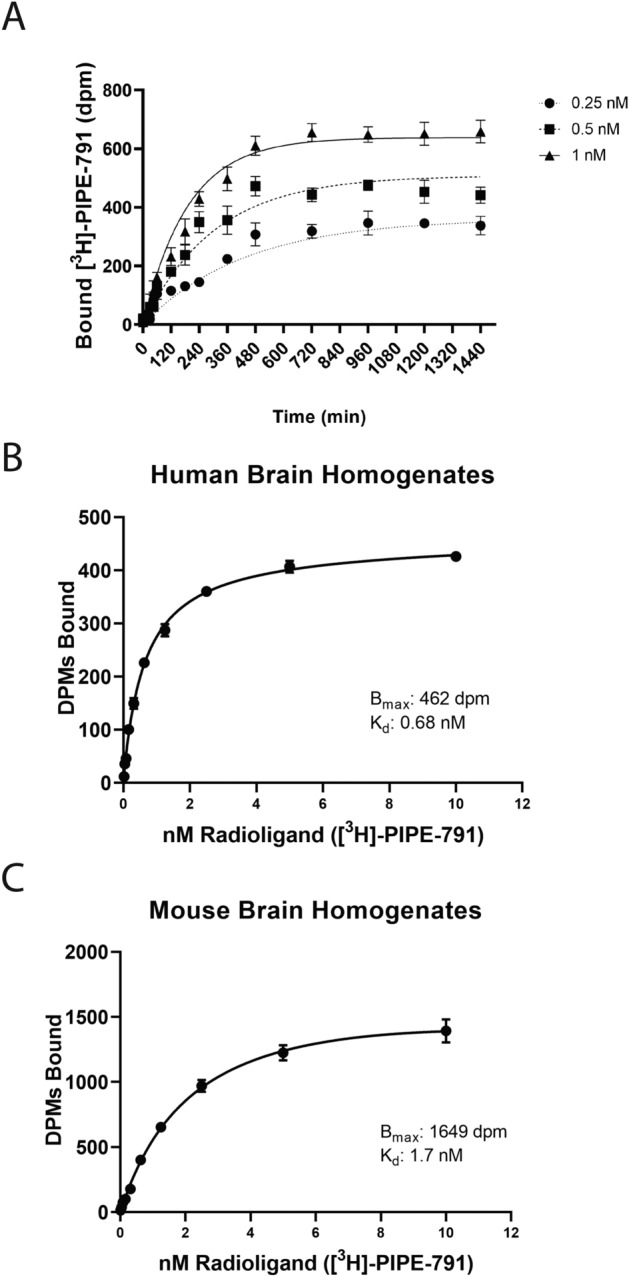
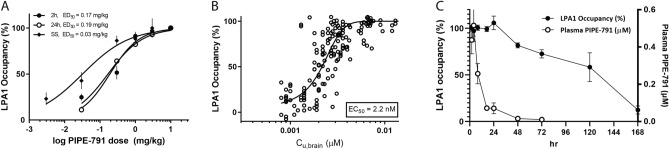
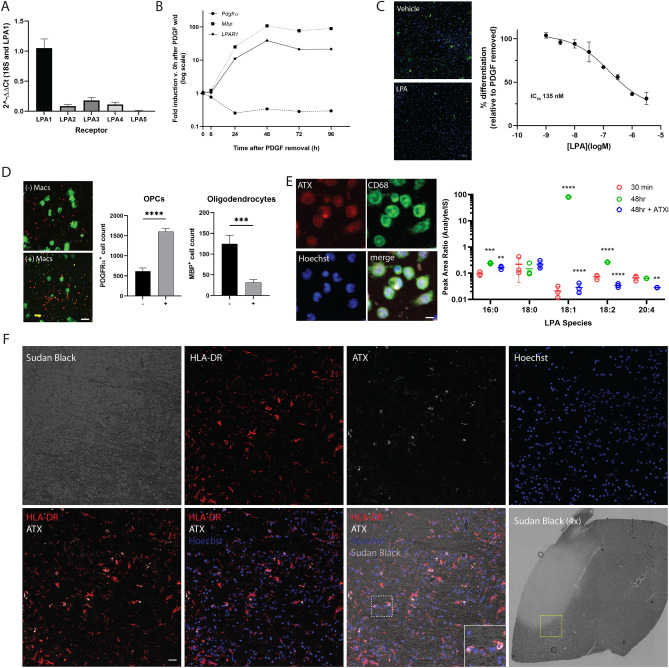
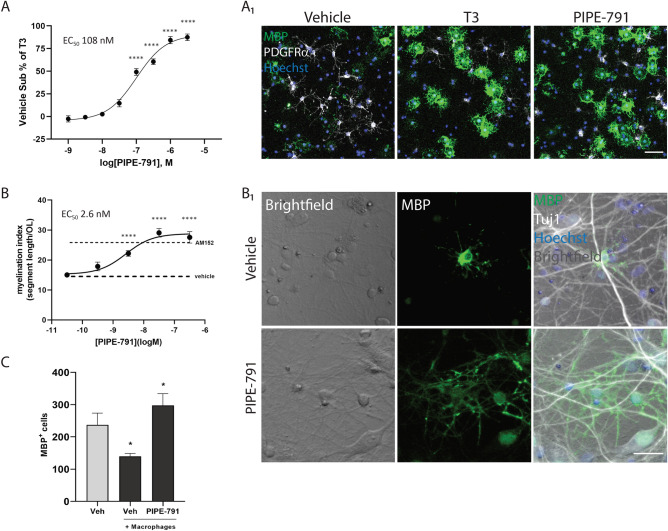
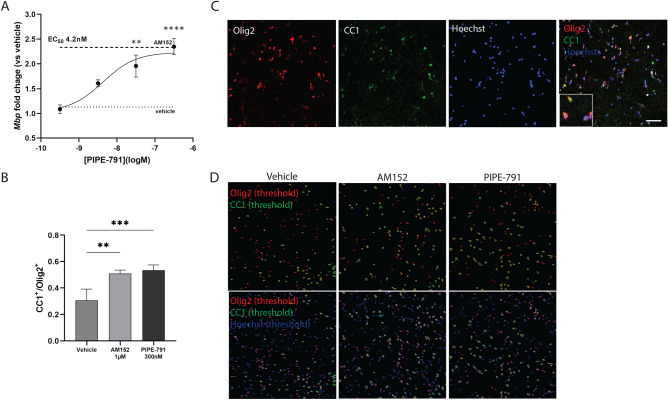
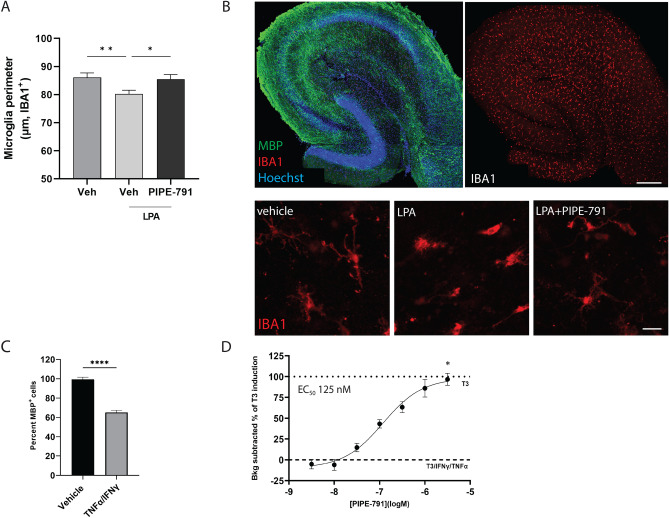
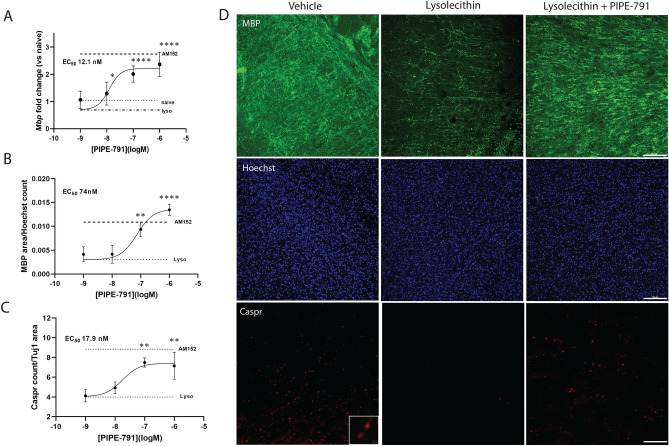
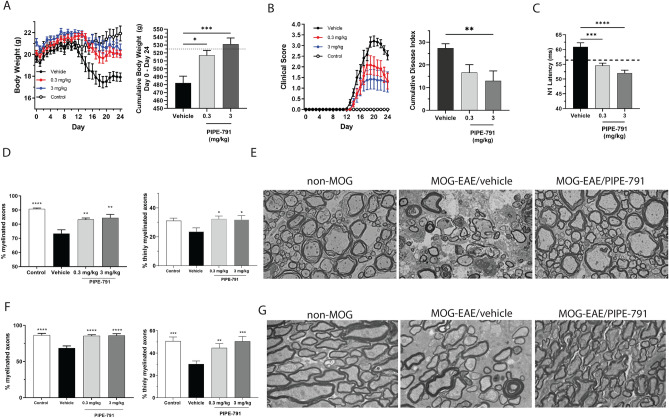
Multiple sclerosis (MS) is a chronic neurological disease characterized by inflammatory demyelination that disrupts neuronal transmission resulting in neurodegeneration progressive disability. While current treatments focus on immunosuppression to limit inflammation and further myelin loss, no approved therapies effectively promote remyelination to mitigate the progressive disability associated with chronic demyelination. Lysophosphatidic acid (LPA) is a pro-inflammatory lipid that is upregulated in MS patient plasma and cerebrospinal fluid (CSF). LPA activates the LPA1 receptor, resulting in elevated CNS cytokine and chemokine levels, infiltration of immune cells, and microglial/astrocyte activation. This results in a neuroinflammatory response leading to demyelination and suppressed remyelination. A medicinal chemistry effort identified PIPE-791, an oral, brain-penetrant, LPA1 antagonist. PIPE-791 was characterized in vitro and in vivo and was found to be a potent, selective LPA1 antagonist with slow receptor off-rate kinetics. In vitro, PIPE-791 induced OPC differentiation and promoted remyelination following a demyelinating insult. PIPE-791 further mitigated the macrophage-mediated inhibition of OPC differentiation and inhibited microglial and fibroblast activation. In vivo, the compound readily crossed the blood-brain barrier and blocked LPA1 in the CNS after oral dosing. Direct dosing of PIPE-791 in vivo increased oligodendrocyte number, and in the mouse experimental autoimmune encephalomyelitis (EAE) model of MS, we observed that PIPE-791 promoted myelination, reduced neuroinflammation, and restored visual evoked potential latencies (VEP). These findings support targeting LPA1 for remyelination and encourage development of PIPE-791 for treating MS patients with advantages not seen with current immunosuppressive disease modifying therapies.


Conflict of interest statement

All authors, while engaged in the research pertaining to this paper, were employees of Contineum Therapeutics. Contineum Therapeutics has filed patent applications related to the subject matter of this paper.

Figures

Figure 1
Figure 1
Pharmacological profile of PIPE-791. (A) Binding kinetics of PIPE-791 in recombinant membranes. Three concentrations of 3H-PIPE-791 (0.25, 0.5 and 1 nM) were incubated with 1 µM PIPE-791 then added to membranes at different time points, resulting in a calculated t1/2 of 519 min (graphs are mean ± SD, n = 4). (B,C) Saturation binding was performed using increasing concentrations of [3H]-PIPE-791 in mouse or human brain homogenate (mean ± SD, n = 4).
Figure 2
Figure 2
PIPE-791 has distinct in vivo brain occupancy kinetics. (A) Dose-occupancy was assessed 2 h or 24 h after administration of PIPE-791. For the steady state condition, mice were dosed once daily for 4 days then occupancy assessed 2 h after the fourth dose (mean ± SEM, n = 6). (B) Pooled analysis of unbound brain concentration (Cu, brain) plotted versus occupancy. (C) Time course of 3 mg/kg PIPE-791 plotted against brain receptor occupancy (left y-axis) and plasma concentration (right y-axis) highlighting its extended brain receptor occupancy and disconnect with plasma concentration (mean ± SEM, n = 6).
Figure 3
Figure 3
LPA1 is expressed on OPCs. (A) Quantitative PCR using primers against the Lpar1 through 5 in rat O4+ OPCs. Error bars are SEM, n = 3. (B) LPA1 expression over the course of differentiation in response to PDGF withdrawal. (C) Exogenous addition of LPA suppresses rat OPC differentiation upon PDGF withdrawal. Left, representative images of OPC cultures after PDGF withdrawal in the presence of LPA; top: no LPA, bottom LPA (1 µM), MBP (green) counterstained with Hoechst (blue). Scale bar 50 µm. Right, graph of LPA dose responsive suppression of OPC differentiation by LPA, IC50 135 nM. (D) Macrophages express autotaxin and release LPA. OPCs were plated in the upper compartment of a Transwell culture plate in the presence (+) or absence (−) of physically separated macrophages (bottom compartment). After PDGF withdrawal, fewer MBP+ oligodendrocytes (and more PDGFRα+ OPCs) were observed in the macrophage co-culture condition, (MBP p = 0.0008; PDGFRα p < 0.0001, mean ± SEM, n = 8, t-test). Representative images (left) of oligodendrocytes (MBP, green) and OPCs (PDGFRα, red) in the absence (− Macs) or presence of macrophages (+ Macs). Scale bar 50 µm. (E) Left, representative images of macrophages immunostained using antibodies against the LPA synthetic enzyme, autotaxin ATX (red), the macrophage marker CD68 (green). Cells were counterstained with Hoechst (blue). Scale bar: 5 µm. Right, quantification of LPA species in macrophage-conditioned media. Media LPA levels increase from 30 m to 48 h after plating. 1 µM PF-8380 (ATX inhibitor) prevents the induction of several LPA species at 48 h, including 18:1 (one way ANOVA, Tukey’s posthoc, significance against 48 h/no inhibitor group, **p < 0.01, *** < 0.001, ****p < 0.0001). (F) Tissue from an MS patient was stained with antibodies against HLA-DR (red), autotaxin (white) and counterstained with Hoechst (blue) and the myelin dye, Sudan Black. Scale bar: 25 µm. Inset (white box) is a magnified view showing HLA-DR+/ATX+/Hoechst+ cells. Bottom right is 4 × Sudan black image of section from where images were acquired. Magnified region of interest is highlighted in yellow. Myelin-poor lesion is lighter area where little staining is observed.
Figure 4
Figure 4
PIPE-791 induces OPC differentiation. (A) Dissociated rat oligodendrocyte precursor cells were treated with PIPE-791 and immunostained with an antibody against MBP (green) and the OPC marker PDGFRα (white). A dose dependent increase in MBP+ oligodendrocytes was observed. Graphs plotted as vehicle subtracted percent of T3 induced differentiation (EC50 108 nM, mean ± SEM, n = 6). Values were compared by ANOVA with Dunnet’s vs vehicle: ****p < 0.0001; T3 was p < 0.0001 by t-test to vehicle). A1, representative image at 1 µM PIPE-791. Scale bar: 50 µm. (B) PIPE-791 induces oligodendrocytes that can myelinate axons in a rat cortical myelination assay. Cells were immunostained against MBP (green), Tuj1 (white), and counterstained with Hoechst (blue). Linear myelin segments were measured to obtain a myelination index, resulting in an EC50 of 2.6 nM. 1 µM AM152 was used as a positive control, mean ± SEM, n = 4. Values were compared by ANOVA with Dunnett’s vs vehicle, ****p < 0.0001; AM152 was p < 0.0001. B1, representative image at 300 nM PIPE-791. Scale bar: 25 µm. (C) PIPE-791 (300 nM) increases MBP+ rat oligodendrocytes despite the presence of inhibitory macrophages (mean ± SEM, t-test vs vehicle no macrophages, n = 8).
Figure 5
Figure 5
PIPE-791 induces oligodendrocytes in human cortical slice culture. (A) Cortical slices from fresh donor human brain were generated and treated with various concentrations of PIPE-791. Mbp transcript was quantified by qPCR resulting in an EC50 of 4.2 nM (mean ± SEM, n = 8; values were compared using ANOVA and Dunnett’s versus vehicle, **p < 0.01, ****p < 0.0001). (B) Human cortical slices treated with vehicle, 1 µM AM152, or 100 nM PIPE-791 were also processed by immunohistochemistry using antibodies against the mature oligodendrocyte marker, CC1 and the oligodendroglial marker Olig2. A significant increase in CC1+ cells was observed, comparable to the positive control, AM152 (**p = 0.0016, ***P = 0.0007, mean ± SEM, n = 4 for each group, ANOVA with Tukey’s). (C) Representative image of slice stained with, Olig2 (red), CC1 (green), Hoechst (blue). Scale bar 50 µm). Inset is a magnified image of cells co-expressing Olig2, CC1 and Hoechst. (D) Thresholded images used for analysis. Olig2+ cells are represented as red outlines, CC1 as green, and Hoechst as blue. Only CC1+/Olig2+/Hoechst+ were counted as oligodendrocytes.
Figure 6
Figure 6
PIPE-791 inhibits microglial activation. (A) Mouse hippocampal slices (postnatal day 21) were generated and treated with PIPE-791. LPA was then added to the slices to induce microglial activation. Slices were fixed and stained with an antibody against IBA1 and counterstained with Hoechst. Treatment with LPA converts microglia from a branched, ramified morphology to round and activated and is prevented in the presence of 3 µM PIPE-791. Activation was quantified using cell perimeter length of IBA1+/Hoechst+ cells (mean ± SEM, n = 4 slices, 3 animals) ANOVA with Tukey’s). Scale bar: 100 µm. (B) Example image from slices treated with 10 µM LPA and LPA with PIPE-791. Scale bar: 25 µm. (C) Rat OPCs were differentiated with T3 into oligodendrocytes then treated with TNFα/IFNγ resulting a 35% decrease in viability (mean ± SEM, n = 2, 6 wells/n). (D) Addition of PIPE-791 prevented oligodendrocyte death in a dose-responsive manner (EC50 125 nM, mean ± SEM, 6 wells/n, graphs are background subtracted to TNFα/IFNγ and plotted as % of T3/vehicle. Values were compared by ANOVA with Dunnett’s vs vehicle, * p < 0.05).
Figure 7
Figure 7
(A) Mouse cortical slice cultures were collected at postnatal day 17, cultured for 72 h then treated with lysolecithin for 18 h. Following insult, lysolecithin was removed and treatments added for 3 days. PIPE-791 induced Mbp transcript with an EC50 of 14.7 nM with efficacy comparable to 1 µM AM152 (mean ± SD, n = 4). (B) Mouse slices were prepared as in (A) but treated with PIPE-791 for 5 days. Slices were immunostained for MBP (green), Caspr (red), and Hoechst (blue). Images were from regions adjacent to the superior edge of the corpus callosum. A dose dependent increase in the amount of MBP (B, EC50 74 nM, naïve value 0.013) and the number of Caspr puncta (C, EC50 17.9 nM, naïve value = 12.33) were observed (mean ± SD, n = 4, values were compared using ANOVA and Dunnett’s versus lysolecithin, **p < 0.01, ****p < 0.0001). (D) Representative images of MBP (green), Hoechst (blue) and Caspr (red) across vehicle, lysolecithin + vehicle, and lysolecithin + 100 nM PIPE-791. Scale bar 100 µm. Inset is zoomed Caspr staining from vehicle treated sample.
Figure 8
Figure 8
PIPE-791 is efficacious in the MOG-EAE mouse model of multiple sclerosis. (A) On Day 0, mice received MOG antigen. Dosing began on day 1 with mice dosed orally, once a day with 0.3 or 3 mg/kg PIPE-791 or vehicle. Left, body weights were measured daily and graphed across time. Error bars are mean ± SEM. Right, Total body weights from day 0 to 24 were summed to generate a cumulative body weight. Significant increases in body weight were observed in both 0.3 and 3 mg/kg PIPE-791 groups (*p = 0.0126, ***p = 0.0003, n = 12, ANOVA with Dunnett’s). (B) Left, graph of clinical scores (error bars are mean ± SEM), Right, graph of cumulative disease index (sum of clinical scores from day 0 to 24) with significant improvement observed at 3 mg/kg (mean ± SEM **p = 0.0092, n = 12, ANOVA with Dunnett’s). 0.3 mg/kg had an improved CDI, but did not achieve significance (p = 0.0575, ANOVA with Dunnett’s). (C) VEP latencies were measured from non-MOG (dotted line) and MOG-EAE mice treated with vehicle, 0.3 or 3 mg/kg PIPE-791 (***p = 0.0003, ****p < 0.0001, mean ± SEM, n = 12 animals, ANOVA with Tukey’s), (D) Left, Graph of myelinated axons in the lumbar spinal cord (g-ratio < 1) of non-MOG mice (****p < 0.0001, n > 8 for all groups) or MOG-EAE mice treated with vehicle, 0.3 mg/kg PIPE-791 (p = 0.0041), or 3 mg/kg PIPE-791 (**p = 0.0013; mean ± SEM). Right, bar graph of % thinly myelinated axons, a surrogate measure of remyelination (1 ≥ g-ratio ≥ 0.8, means ± SEM, *p < 0.05, ANOVA with Dunnett’s, n > 8 for all groups). (E) Representative electron micrographs from spinal cord of non-MOG or MOG-EAE with vehicle or PIPE-791 (3 mg/kg). (F) Left, graph of myelinated axons in the optic nerve (g-ratio < 1) of non-MOG mice or MOG-EAE mice treated with vehicle, 0.3 mg/kg PIPE-791, or 3 mg/kg PIPE-791 (****p < 0.0001, mean ± SEM, n > 8 for all groups). Right, graph of thinly myelinated axons (1 ≥ g-ratio ≥ 0.8, **p < 0.01, ***p < 0.01, ANOVA with Dunnett’s, n > 8 for all groups). (G) Representative electron micrographs of optic nerve from non-MOG or MOG-EAE with vehicle or PIPE-791 (3 mg/kg).

Similar articles

Cited by

References

    1. Balood M, Zahednasab H, Siroos B, Mesbah-Namin SA, Torbati S, Harirchian MH. Elevated serum levels of lysophosphatidic acid in patients with multiple sclerosis. Hum. Immunol. 2014;75(5):411–413. doi: 10.1016/j.humimm.2014.02.021. - DOI - PubMed
    1. Jiang D, Ju W, Wu X, Zhan X. Elevated lysophosphatidic acid levels in the serum and cerebrospinal fluid in patients with multiple sclerosis: Therapeutic response and clinical implication. Neurol. Res. 2018;40(5):335–339. doi: 10.1080/01616412.2018.1446256. - DOI - PubMed
    1. Schmitz K, Brunkhorst R, de Bruin N, Mayer CA, Haussler A, Ferreiros N, Schiffmann S, Parnham MJ, Tunaru S, Chun J, Offermanns S, Foerch C, Scholich K, Vogt J, Wicker S, Lotsch J, Geisslinger G, Tegeder I. Dysregulation of lysophosphatidic acids in multiple sclerosis and autoimmune encephalomyelitis. Acta Neuropathol. Commun. 2017;5(1):42. doi: 10.1186/s40478-017-0446-4. - DOI - PMC - PubMed
    1. Zahednasab H, Balood M, Harirchian MH, Mesbah-Namin SA, Rahimian N, Siroos B. Increased autotaxin activity in multiple sclerosis. J. Neuroimmunol. 2014;273(1–2):120–123. doi: 10.1016/j.jneuroim.2014.06.006. - DOI - PubMed
    1. Lorrain, K. I., Poon, M. M., Baccei, J., Broadhead, A. Dearie, A., Green, A., Chan, J. R., Lorrain, D. L. LPA Receptors Modulate Oligodendrocyte Differentiation and Maturation (Society for Neuroscience, 2017).

Publication types

MeSH terms

Substances