. 2024 Sep;43(17):3553-3586.
doi: 10.1038/s44318-024-00103-7. Epub 2024 May 8.

Recycled melanoma-secreted melanosomes regulate tumor-associated macrophage diversification

Affiliations

Recycled melanoma-secreted melanosomes regulate tumor-associated macrophage diversification

Roma Parikh et al. EMBO J. 2024 Sep.

Abstract

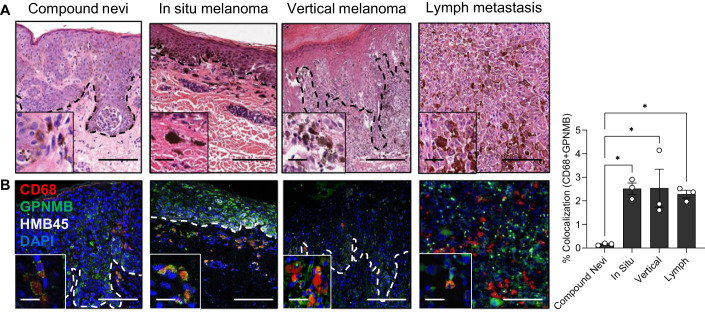
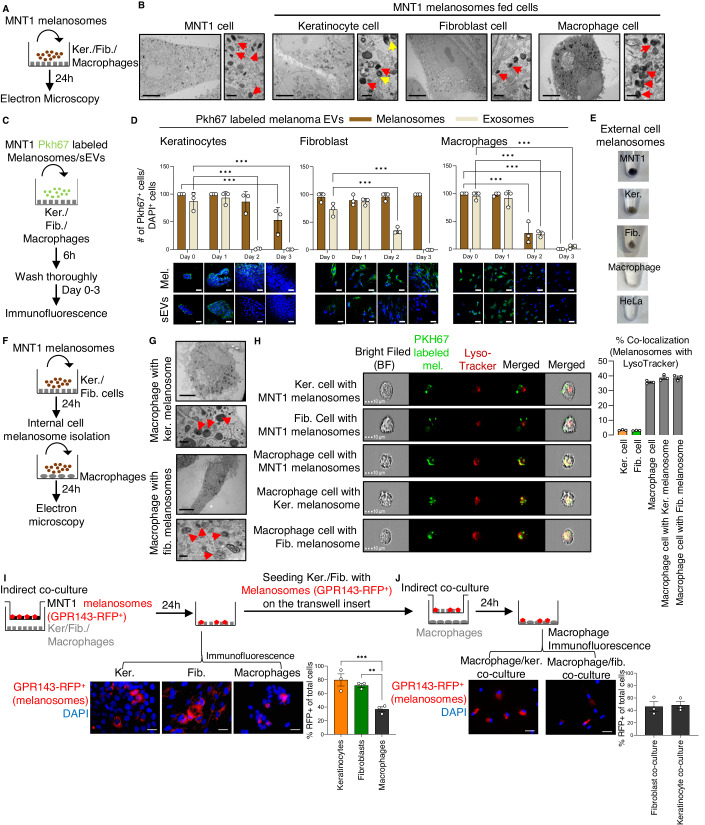
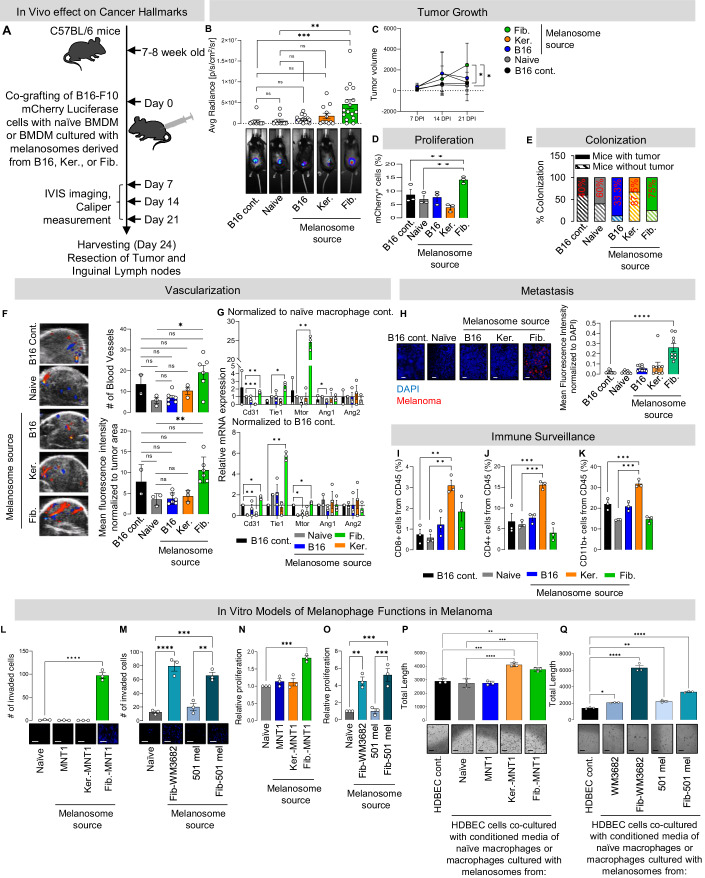
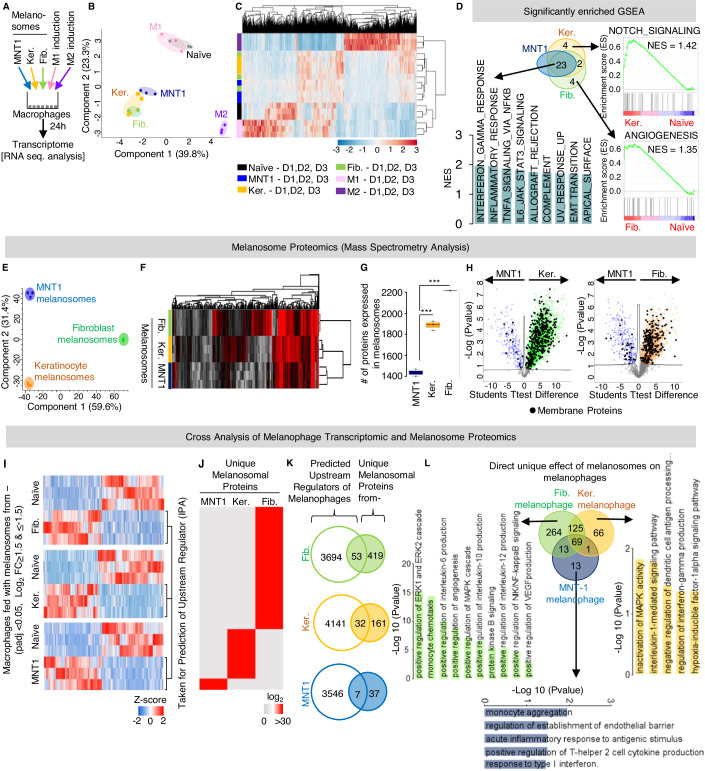
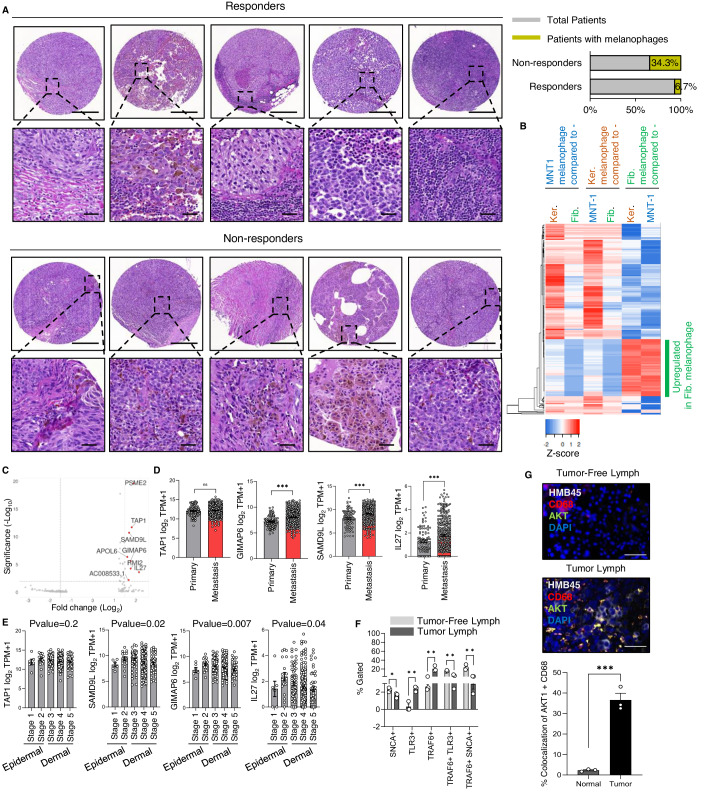
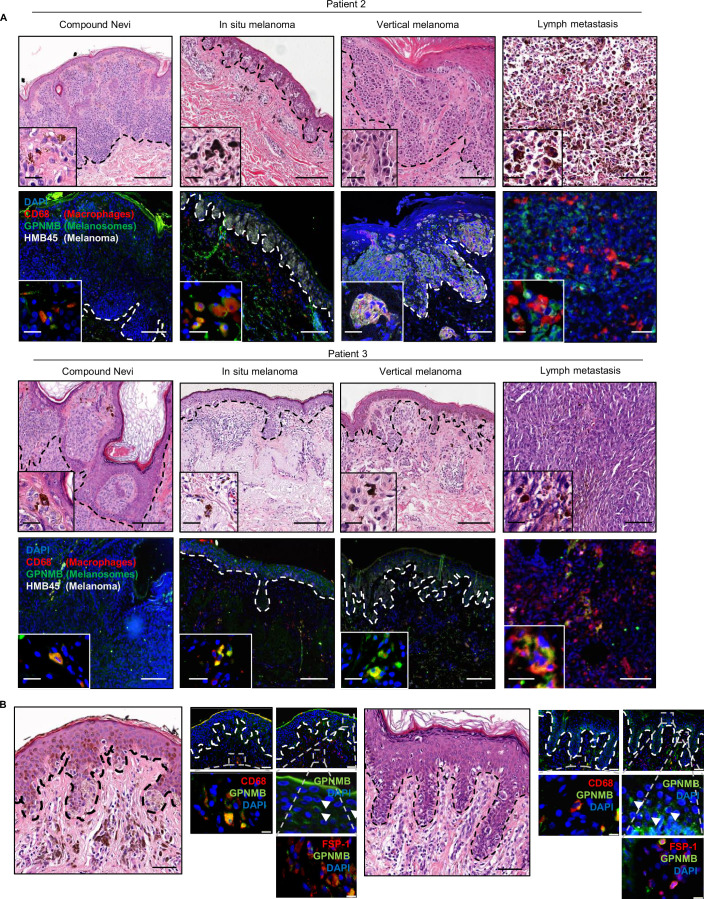
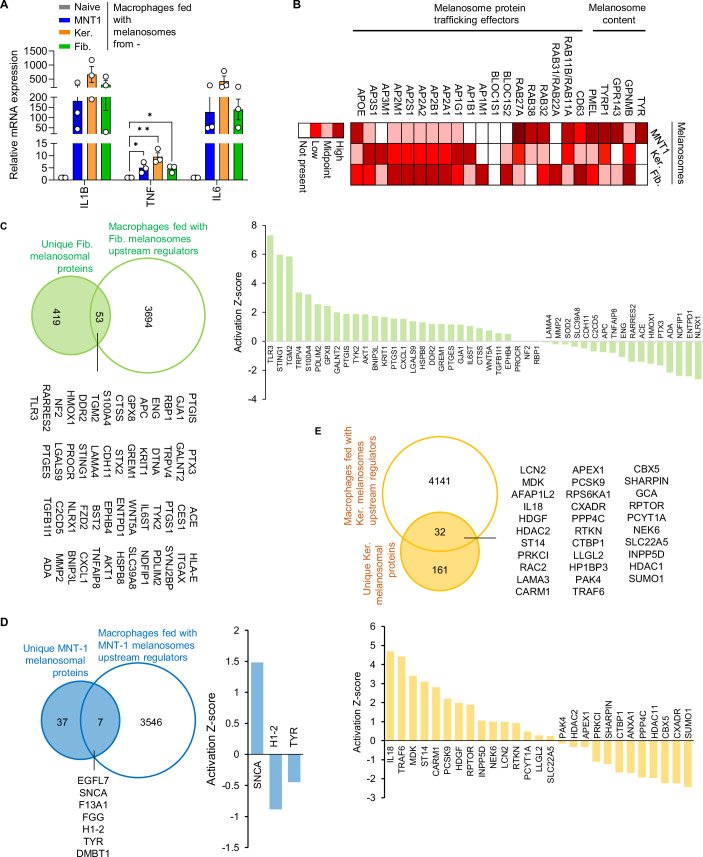
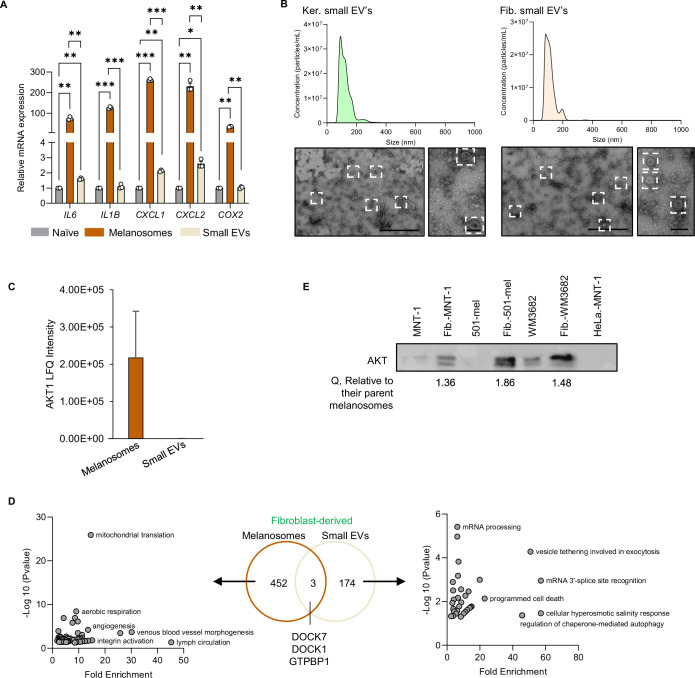
Extracellular vesicles (EVs) are important mediators of communication between cells. Here, we reveal a new mode of intercellular communication by melanosomes, large EVs secreted by melanocytes for melanin transport. Unlike small EVs, which are disintegrated within the receiver cell, melanosomes stay intact within them, gain a unique protein signature, and can then be further transferred to another cell as "second-hand" EVs. We show that melanoma-secreted melanosomes passaged through epidermal keratinocytes or dermal fibroblasts can be further engulfed by resident macrophages. This process leads to macrophage polarization into pro-tumor or pro-immune cell infiltration phenotypes. Melanosomes that are transferred through fibroblasts can carry AKT1, which induces VEGF secretion from macrophages in an mTOR-dependent manner, promoting angiogenesis and metastasis in vivo. In melanoma patients, macrophages that are co-localized with AKT1 are correlated with disease aggressiveness, and immunotherapy non-responders are enriched in macrophages containing melanosome markers. Our findings suggest that interactions mediated by second-hand extracellular vesicles contribute to the formation of the metastatic niche, and that blocking the melanosome cues of macrophage diversification could be helpful in halting melanoma progression.

Keywords: Angiogenesis; Cell-to-Cell-Transfer; Heterogeneity; Melanosomes; Tumor Associated Macrophages.


Conflict of interest statement

The authors declare no competing interests.

Figures

Figure 1
Figure 1. Melanosomes are detected in non-cancerous cells in the tumor microenvironment.
(A) Representative images of cross-sections of compound nevi, melanoma in situ, vertical melanoma, and lymph metastasis stained with hematoxylin and eosin (H&E). Black dashed lines demarcate the epidermal from the dermal regions. Scale bars, 200 µm. Inset images show macrophages containing pigmented vesicles. Scale bars, 50 µm. (B) Consecutive slices of specimens shown in panel A immunostained for HMB45 (white), melanosomal marker GPNMB (green), and macrophage marker CD68 (red). Nuclei are stained with DAPI (blue). White dashed lines demarcate the epidermal from the dermal regions. Scale bars, 200 µm. Inset images show the co-localization of macrophages with melanosomes. Scale bars, 50 µm. The graph depicts the percentage co-localization of macrophages (CD68) with melanosomes (GPNMB) in melanoma cross-sections as analyzed using ImageJ. n = 3 patients from each stage of melanoma cross-sections. Data information: In (B), error bars represent ±SEM. One-way ANOVA was performed for statistical analysis; *P ≤ 0.05 was considered significant. Source data are available online for this figure.
Figure 2
Figure 2. Cell-to-cell transfer of melanoma cell-derived melanosomes occurs in the tumor microenvironment.
(A) Workflow for the culture of melanosomes secreted by MNT1 cells with keratinocytes (Ker.), fibroblasts (Fib.), or naïve macrophages. (B) TEM images of keratinocytes, fibroblasts, and macrophages cultured with melanosomes secreted by MNT1 cells for 24 h. Scale bars, 10 µm. Enlarged images show melanosomes (indicated by red arrowheads) within the cytoplasm of the cells. Yellow arrowheads indicate lysosomes. Scale bars, 0.5 µm. (C) Workflow for labeling of melanosomes (Mel.) and small EVs (sEVs) from MNT1 melanoma cells with Pkh67 dye and subsequent culture of keratinocytes, fibroblasts, or naïve macrophages with EVs followed by a thorough washing of the cells. (D) Upper: Percentage of PKH67-labeled cells of all DAPI-labeled cells in cultures of keratinocytes (left panel), fibroblasts (middle panel), and macrophages (right panel) cultured with Pkh67-labeled melanosomes or small EVs. n = 4 independent experiments. Lower: Representative immunofluorescence images of indicated cells cultured with Pkh67-labeled melanoma EVs (green). DAPI-stained nuclei appear blue. Scale bars, 100 µm. (E) Representative photographs of melanosomal pellets from conditioned media of cells cultured for 3 days with Pkh67-labeled melanoma EVs. MNT1 and HeLa cells were used as positive and negative controls, respectively. (F) Workflow for isolation of melanosomes internalized by keratinocytes or fibroblasts and subsequent culture with macrophages. Cells were cultured with MNT1 melanosomes for 24 h and homogenized. Extracts were separated by sucrose gradient centrifugation, and the melanosome fraction was collected. Naïve macrophages were cultured with the isolated melanosomes for 24 h and then analyzed using TEM. (G) TEM images of macrophages cultured with melanosomes isolated from keratinocytes (upper panel) and from fibroblasts (lower panel). Scale bars, 10 µm. Enlarged images show broken melanosomes (indicated by red arrowheads) within the cytoplasm of the cells. Scale bars, 0.5 µm. (H) Representative ImageStream cytometry showing images of single keratinocytes, fibroblasts, and macrophages that have taken up PKH67-labeled melanosomes. Cells were stained with the LysoTraker Deep red dye. Scale bar = 10 µm. The graph depicts the percentage co-localization of the melanosomes with the LysoTracker dye in each condition. n = 3 independent experiments. (I) Upper: Workflow of co-culture assay in which MNT1 cells stably expressing GPR143-RFP were co-cultured in a transwell system with keratinocytes, fibroblasts, or naïve macrophages for 24 h. Lower left: Representative images of indicated cells cultured with MNT1 cells stably expressing GPR143-RFP (red). DAPI-stained nuclei appear blue. Scale bars, 20 µm. Lower right: Percentage of cells positive for the RFP normalized to the number of DAPI-positive cells. n = 3. (J) Upper: Workflow for co-culture of keratinocytes or fibroblasts, which had been previously co-cultured with melanoma cells with RFP-labeled melanosomes, with naïve macrophages. Lower left: Representative images of macrophages cultured with keratinocytes or fibroblasts previously co-cultured with melanoma cells expressing GPR143-RFP (red). DAPI-stained nuclei appear blue. Scale bar, 20 µm. Lower right: Percentage of cells positive for the RFP normalized to the number of DAPI-positive cells. n = 3. Data information: In panel (D, HJ), error bars represent ±SEM. One-way ANOVA was used for statistical analysis; *P ≤ 0.05, **P ≤ 0.01, ***P ≤ 0.001 was considered significant. Source data are available online for this figure.
Figure 3
Figure 3. The effect of macrophages cultured with melanosomes on cancer hallmarks depends on the melanosome source.
(A) Schematic workflow of the in vivo experiment. BMDMs were cultured with melanosomes from different sources. B16-F10 mouse melanoma cells that stably express mCherry and luciferase were grafted alone or co-grafted with naïve BMDMs or BMDMs cultured with melanosomes into C57BL/6 mice at a ratio of 1:5 (B) Upper: Average bioluminescence of each mouse on 7, 14, and 21 days post injection (DPI). Bars plot means of each group. n ≥ 5 mice per group. Lower: Representative IVIS images of mice at 21 DPI. Note: The representative images shown here are re-used in Fig. EV3A as part of all the raw images. (C) Tumor volumes on 7, 14, and 21 DPI for mice from indicated groups. n ≥ 5 mice per group. (D) Percent expression of mCherry-positive cells of total DAPI-labeled cells as determined by flow cytometry. n = 3 mice per group. (E) Percent of mice with tumors at 21 DPI. (F) Left: Representative color Doppler images highlighting vasculature in red and blue at 21 DPI. Upper right: Number of blood vessels per tumor. Lower right: Mean fluorescence intensity normalized to the area of the tumor. n = ≥2. (G) Cd31, Tie1, Mtor, Ang1, and Ang2 mRNA levels in tumors from indicated groups relative to naïve BMDM control (upper panel) and relative to B16-F10 control (lower panel) at 24 DPI. n = 3 mice per group. (H) Left: Images of inguinal lymph nodes stained for melanoma cells (red) and nuclei (blue). Right: Mean fluorescence intensity of staining for melanoma marker normalized to DAPI. n = 3 mice per group and 3 images per mouse. (I) Percent CD8+ T cells of total CD45+ cells as analyzed using flow cytometry. n = 3 mice per group. (J) Percent CD4+ T cells of total CD45+ cells. n = 3 mice per group. (K) Percent CD11b+ cells of total CD45+ cells. n = 3 mice per group. (L) Upper: Numbers of invaded WM3682 melanoma cells. Melanoma cells were treated with conditioned media from naïve macrophages or macrophages cultured with melanosomes from indicated sources for 24 h. n = 3 independent experiments. Lower: Representative images of invasion assay. Scale bar, 50 µm. (M) Same as L but conditioned media from macrophages cultured with melanosomes from indicated sources. (N) Proliferation of WM3682 human melanoma cells treated with the conditioned media from naïve macrophages or macrophages cultured with melanosomes from indicated sources for 24 h. n = 3 independent experiments. (O) Same as N but conditioned media from macrophages cultured with melanosomes from indicated sources. (P) Total tube lengths in cultures of HDBECs incubated with conditioned media from naïve macrophages or macrophages cultured with melanosomes from indicated sources for 24 h. n = 3 independent experiments with cells from independent donors. (Q) Same as P but conditioned media from macrophages cultured with melanosomes from indicated sources. Note: The representative image of the HDBEC control (cont.) has been re-used in Fig. 5G as part of the same experiment. Data information: In panel (BD, FQ), error bars represent ±SEM. One-way ANOVA used for statistical analysis; *P ≤ 0.05, **P ≤ 0.01, ***P ≤ 0.001, ****P ≤ 0.0001 was considered significant. Source data are available online for this figure.
Figure 4
Figure 4. Macrophages incubated with melanosomes isolated from different cell types are phenotypically and functionally diverse.
(A) Workflow of transcriptomic analyses of macrophages cultured with melanosomes isolated from MNT1 cells, keratinocytes, or fibroblasts. M1-like and M2-like macrophages were used as controls. (B) Principal component analysis of transcriptomes of macrophages cultured with melanosomes isolated from MNT1 melanoma cells, keratinocytes, or fibroblasts and of naïve, M1-like, and M2-like macrophages as controls. n = 3 donors for each condition. (C) Heatmap of expression and clustering of transcriptomes of indicated macrophages. n = 3 donors for each condition. (D) Upper left: Venn diagram showing the overlap between the GSEA terms enriched in macrophages cultured with melanosomes isolated from MNT1 melanoma cells, keratinocytes, or fibroblasts. Lower left: Normalized enrichment scores for the top nine most significantly enriched Hallmark gene sets from the overlap of transcriptomes. Right: Angiogenesis Hallmark gene set unique to macrophages cultured with fibroblast melanosomes and NOTCH signaling Hallmark gene set unique to macrophages cultured with keratinocyte melanosomes compared to naïve macrophages. (E) Principal component analysis of proteomes of MNT1-, fibroblast-, and keratinocyte-derived melanosomes. n = 3 independent experiments. (F) Heatmap of total proteomes of indicated melanosomes showing clusters discriminating between the fibroblast-derived melanosomes (Clusters 1, 3) and keratinocyte-derived melanosomes (Cluster 2). n = 3 independent experiments. (G) Numbers of proteins expressed in indicated melanosomes. n = 3 independent experiments. (H) Volcano plots of the results of Student’s t-tests comparing MNT1- and keratinocyte-derived melanosome proteomes (left panel) and MNT1- and fibroblast-derived melanosomes (right panel). FDR q value <0.1. Blue dots are the MNT1 melanosomal proteins, orange dots are the keratinocyte melanosomal proteins, green dots are the fibroblast melanosomal proteins and black dots are the membrane proteins. An FDR q value ≤0.05 was considered significant. (I) Heatmap showing the Log2 fold difference in expression of genes in macrophages cultured with fibroblast-derived melanosomes (top panel), keratinocyte-derived melanosomes (middle panel), and MNT1 melanoma cell-derived melanosomes as compared to the naïve macrophages. n = 3 individual donors (D1, D2, and D3) for each condition. (J) Heatmap showing the LFQ expression values of proteins unique to MNT1-, keratinocyte-, and fibroblast-derived melanosomes. n = 3 independent experiments. (K) Overlap between the upstream regulators predicted by IPA of melanophage genes and unique melanosomal proteins. n = 3 individual donors for melanophages and n = 3 independent experiments for melanosome isolation. (L) Center: Overlap of the genes downstream to the direct effector proteins as found in (K). Graphs depict significantly enriched GO biological processes for genes unique to melanophages resulting from a culture with melanosomes from melanoma cells, fibroblasts, and keratinocytes. Data information: In panel (G), error bars represent ±SEM. An unpaired Student’s t-test was used for statistical analysis, ***P ≤ 0.001 was considered significant. The centerline on the boxplot shows the medians, the box limits indicate the 25th and the 75th percentiles, and the whiskers extend to the minimum and maximum. In panel (I), an adjusted P value of ≤0.05 was used as a cutoff. Log2-transformed expression of the genes were z-score normalized and visualized in hierarchical clustering with Euclidean distance method analysis (dendrograms omitted). Source data are available online for this figure.
Figure 5
Figure 5. Fibroblast melanosomes contain AKT1, which induces angiogenesis via the AKT1/mTOR pathway in macrophages.
(A) Protein–protein interaction network was identified using STRING for the direct effector proteins with positive Z-scores (Fig. EV4C). Green indicates angiogenesis-associated proteins. (B) Venn diagram of overlap between the direct fibroblast melanosomal effector proteins (Fig. 3K, found in the overlap) and proteins highly expressed in CAFs (top 5%) identified by Dror et al (2016). (C) Western blot analysis for AKT protein in MNT1- and fibroblast-derived melanosomes. (D) Western blot analysis for AKT and GPNMB protein levels in non-trypsinized or trypsinized melanosomes isolated from MNT1 cells and fibroblasts. AKT and GPNMB protein levels in each condition were normalized to the non-trypsinized melanosome protein levels. (E) Upper: Western blot analysis for phosphorylated mTOR in naïve macrophages and macrophages cultured with non-trypsinized or trypsinized melanosomes. Total mTOR was used as a loading control. Phospho-mTOR protein levels in each condition were normalized to total mTOR. Lower: Amounts of phosphorylated mTOR normalized to total mTOR. (F) Total tube lengths in cultures of HDBECs treated with conditioned media from naïve macrophages and macrophages incubated with non-trypsinized and trypsinized melanosomes. HDBEC cells and naïve macrophages were used as controls. n = 3 donors for conditioned media of macrophages and 3 independent angiogenesis assays. (G) Tube lengths for the HDBEC cells treated with conditioned media of naïve macrophages and macrophages cultured with fibroblast-derived melanosomes treated with vehicle or with capivasertib (AKTi). n = 3 donors and 3 independent experiments. Note: The representative image of the HDBEC control (cont.) has been re-used in Fig. 3Q as part of the same experiment. (H) Total tube length for the HDBEC cells treated with conditioned media of naïve macrophages and macrophages cultured with fibroblast-derived melanosomes treated with vehicle or rapamycin. HDBECs and naïve macrophages were used as controls. n = 3 donors and 3 independent experiments. (I) VEGF quantity in the secretome of the conditioned media of naïve macrophages and of macrophages cultured with MNT1 melanosomes or trypsinized or non-trypsinized fibroblast melanosomes and treated with vehicle or rapamycin. Monoculture of HDBECs and naïve macrophages were used as controls. n = 3 donors and 3 independent experiments. (J) Upper: Numbers of invaded WM3682 melanoma cells treated with conditioned media from naïve macrophages, macrophages cultured with melanoma-derived melanosomes, and macrophages cultured with fibroblast-derived melanosomes treated with vehicle or with AKTi (capivasertib). n = 3 independent experiments. Lower: Representative images of invasion assay. Scale bar, 50 µm. (K) Proliferation of WM3682 human melanoma cells treated with the conditioned media from naïve macrophages, macrophages cultured with melanoma-derived melanosomes, and macrophages cultured with fibroblast-derived melanosomes treated with vehicle or with AKTi. n = 3 independent experiments. Data information: In panels (FK), error bars represent ±SEM. Significance was determined by one-way ANOVA. *P ≤ 0.05, **P ≤ 0.01, ***P ≤ 0.001 was considered significant. Source data are available online for this figure.
Figure 6
Figure 6. The melanosome-induced macrophage polarization signature is detected in human melanoma specimens.
(A) Left: Representative images of H&E-stained specimens from melanoma tissue array stained with H&E of immunotherapy responders’ and non-responder’s cross-section. Scale bars, 400 µm. Enlarged images show the areas containing macrophages. Scale bars, 80 µm. Right: Percentages of patient samples with melanophages. n = 15 responders and n = 35 non-responders. An unpaired Student’s t-test was used to determine significance. (B) Heatmap of Log2 fold difference in gene expression (≥1.2 fold change) in macrophages incubated with fibroblast-derived melanosomes compared to ≤1 fold change in MNT1 and keratinocyte melanophage. n = 3 donors per condition. (C) Volcano plot of top ten genes are significantly different in macrophages treated with fibroblast-derived melanosomes compared to all other treatments (naïve macrophage, MNT1, and keratinocyte melanophage). n = 3 donors per condition. (D) Log2 transcripts per million (TPM) + 1 for TAP1, SAMD9L, GIMAP6, and IL-27 in primary and metastatic lesions based on data from TCGA. Each dot represents an individual patient. n = 104 primary and n = 369 metastatic samples. (E) Log2 TPM + 1 for TAP1, SAMD9L, GIMAP6, and IL-27 in samples from patients in the TCGA cohort at different Clark stages of melanoma. n = 6 Stage1, n = 17 Stage 2, n = 78 Stage 3, n = 168 Stage 4, and n = 53 Stage 5. (F) Flow cytometry analysis showing the percentage of gated macrophage cells expressing TLR3, TRAF6, and SNCA, markers for fibroblast, keratinocyte, and melanoma-derived melanosomes, respectively, in fresh lymph node biopsies from the same patient that do and do not contain melanoma cells. n = 1 patient with 3 technical replicates. (G) Upper panel: Images of tumor-free and tumor-containing melanoma lymph node biopsies stained for HMB45 (white), AKT1 (green), macrophage marker CD68 (red), and DAPI for nuclei (blue). Scale bar, 20 µm. Lower panel: Percentage co-localization of AKT1 with the CD68. An unpaired Student’s t-test was used to determine significance. Data information: In panel (D, G) an unpaired Student’s t-test was used to determine the significance. In panel (E, F) one-way ANOVA was used to determine the significance. Error bars represent ±SEM. **P ≤ 0.01, ***P ≤ 0.001 was considered significant. Source data are available online for this figure.
Figure EV1
Figure EV1. Associated with Fig. 1: Melanosomes are detected in non-cancerous cells in the tumor microenvironment.
(A) Images of compound nevi, in situ and vertical melanoma and lymph metastasis samples from two patients. Upper panels: Images of H&E-stained sections of compound nevi, in situ, and vertical melanoma and lymph metastasis samples from two patients. Black dashed lines demarcate the epidermal and dermal borders. Scale bars, 200 µm. Inset images show macrophages containing pigmented vesicles. Scale bars, 50 µm. Lower panels: Images of consecutive specimens stained for HMB45 (white), melanosomal marker GPNMB (green), and macrophage marker CD68 (red) and with DAPI for nuclei (blue). White dashed lines demarcate the epidermal and dermal borders. Scale bars, 200 µm. Inset images show the co-localization of macrophages with melanosomes. Scale bars, 50 µm. (B) Left: Images of H&E-stained sections of in situ melanoma specimens from two patients. Black dashed lines demarcate the epidermal and dermal borders. Scale bars, 200 µm. Right: Immunofluorescence images of consecutive samples stained for CD68 (red) and GPNMB (green) or FSP1 (red) and GPNMB (green). White dashed lines demarcate the epidermal and dermal borders. Scale bars, 200 µm. Inset images show keratinocytes within the epidermis containing melanosomes marked with white arrowheads. Scale bars, 50 µm.
Figure EV2
Figure EV2. Associated with Fig. 2: Cell-to-cell transfer of melanoma cell-derived melanosomes occurs in the tumor microenvironment.
(A) NanoSight analysis (upper) and TEM analysis (lower) of melanosomes secreted from melanoma cells. Scale bars, 0.5 µm. (B) Immunofluorescence images of control keratinocytes, fibroblasts, and naïve macrophages and of cells cultured with melanosomes for 24 h. DAPI-stained nuclei appear blue. Scale bars, 10 µm. (C) NanoSight analysis (upper) and TEM analysis (lower) of small EVs secreted from melanoma cells. Scale bars, 0.5 µm left image and 0.2 µm for right image. Small EVs are highlighted with white dashed boxes. (D) Top: Photograph of peripheral blood mononuclear cell sample after Ficoll gradient centrifugation. Bottom: Flow cytometry analysis of monocytes isolated using a CD14+ cell isolation kit; 71% of isolated cells were CD14+. (E) TEM images of melanosomes from inside cells (right) and from conditioned media (left) of indicated samples. Scale bars, 0.2 µm. (F) Workflow of isolation of melanosomes from inside cells and from conditioned media after 3 days of culture. (G) NanoSight analysis (right) and TEM images (left) of melanosomes isolated from the keratinocyte and fibroblast cells cultured with MNT1 melanoma cell melanosomes. Scale bars, 0.5 µm. (H) Quantification of melanin concentration in samples isolated by differential centrifugation, gradient centrifugation, and ultra-centrifugation for secreted melanosomes, internalized melanosomes, and small EVs, respectively, from melanoma cells, keratinocytes, and fibroblasts; n = 2 independent experiments. (I) Western blot analysis for signature melanosomal proteins TYR, GPR143, GPNMB, and DCT in the melanosome fraction from indicated cells. (J) Western blot analysis for signature small EV proteins CD9, Syntenin, and CD63 in small EV fractions from indicated cells.
Figure EV3
Figure EV3. Associated with Fig. 3: Macrophages cultured with melanosomes from different cell sources have heterogenous effects on cancer hallmarks.
(A) In vivo bioluminescent images of C57BL6 mice injected with B16-F10 mCherry cells expressing firefly luciferase reporter co-inoculated with BMDMs incubated with melanosomes derived from B16-F10 melanoma cells, fibroblasts, or primary keratinocytes. Images were taken on days 7, 14, and 21 post injection. Mice inoculated with B16-F10 cells and naïve macrophages were used as controls. Note: The representative images shown in Fig. 3B haven been taken as a representative of each group from the raw images shown here. (B) Upper: Numbers of invaded 501mel melanoma cells treated with conditioned media from macrophages cultured with melanosomes from indicated source cells for 24 h. n = 3 independent experiments. Lower: Representative images of invasion assay. Scale bar, 50 µm. (C) The proliferation of 501mel melanoma cells treated with the conditioned media of macrophages that had been cultured with melanosomes from indicated cells for 24 h relative to culture with conditioned media from naïve macrophages (control). n = 3 independent experiments. (D) Upper: Numbers of invaded MNT1 melanoma cells treated with conditioned media from macrophages cultured with melanosomes from indicated source cells for 24 h. n = 3 independent experiments. Lower: Representative images of invasion assay. Scale bar, 50 µm. (E) The proliferation of MNT1 melanoma cells treated with the conditioned media of macrophages that had been cultured with melanosomes from indicated cells for 24 h relative to culture with conditioned media from naïve macrophages (control). n = 3 independent experiments. Data information: In panel (BE), error bars represent ±SEM and one-way ANOVA was performed for statistical analysis, *P ≤ 0.05, **P ≤ 0.01, ***P ≤ 0.001 was considered significant.
Figure EV4
Figure EV4. Associated with Fig. 4: Macrophages incubated with melanosomes from different cell types are phenotypically and functionally diverse.
(A) Relative mRNA expression of pro-inflammatory genes IL1B, TNF, and IL6 in macrophages cultured with melanosomes from MNT1 melanoma cells, keratinocytes, and fibroblast cells normalized to expression in naïve macrophages; n = 3. (B) Heatmap of LFQ intensity of melanosomal proteins and trafficking effector proteins in melanosomes from indicated cell sources. n = 3 independent experiments. (CE) Overlap between the upstream regulators predicted by IPA and unique melanosomal proteins and graphs depicting the activation Z-scores of the upstream regulators found in the overlap from (C) fibroblasts, (D) MNT1 melanoma cells, and (E) keratinocyte as identified in Fig. 4I,J. n = 3 individual donors for each melanophage and n = 3 independent experiments for melanosome isolation. Data information: In panel (A), error bars represent ±SEM. One-way ANOVA was performed for statistical analysis, *P ≤ 0.05, **P ≤ 0.01 was considered significant.
Figure EV5
Figure EV5. Associated with Fig. 5: Fibroblasts melanosomes loaded with AKT1 induce angiogenesis in macrophages via the AKT1/mTOR pathway.
(A) mRNA levels of CAF-associated genes in dermal fibroblast cells upon culturing with small EVs or melanosomes. n = 3 independent experiments. (B) NanoSight analysis (upper) and TEM analysis (lower) of small EVs secreted from keratinocytes (Ker., left panel) and fibroblasts (Fib., right panel). Scale bars, 0.5 µm and 0.2 µm. Small EVs are highlighted with white dashed boxes. (C) LFQ intensity scores of the AKT1 protein levels in fibroblast-derived small EVs and melanosomes. n = 2 independent experiments of isolation of each EVs. (D) Center: Overlap between the uniquely expressed proteins in each fibroblast-derived small EVs or melanosomes compared to the MNT1 or keratinocyte-derived small EVs or melanosomes, by proteomics analysis. MNT1 and keratinocyte EVs were used as controls to identify specific proteins expressed by the EVs of the fibroblast cells. Left and right: Dot plots showing the significantly enriched biological processes of the genes further uniquely expressed by each EV. n = 2 independent experiments of isolation for each EVs. (E) Western blot analysis for AKT protein levels in melanosomal fractions isolated from the melanoma cells or fibroblast cells that were cultured with indicated melanoma melanosomes. Data information: In panel (A, C), error bars represent ± S.E.M. In panel (A), one-way ANOVA was performed for statistical analysis, *P ≤ 0.05, **P ≤ 0.01, ***P ≤ 0.001 was considered significant.

References

    1. Adelmann CH, Traunbauer AK, Chen B, Condon KJ, Chan SH, Kunchok T, Lewis CA, Sabatini DM (2020) MFSD12 mediates the import of cysteine into melanosomes and lysosomes. Nature 588:699–704 10.1038/s41586-020-2937-x - DOI - PMC - PubMed
    1. Ando H, Niki Y, Ito M, Akiyama K, Matsui MS, Yarosh DB, Ichihashi M (2012) Melanosomes are transferred from melanocytes to keratinocytes through the processes of packaging, release, uptake, and dispersion. J Invest Dermatol 132:1222–1229 10.1038/jid.2011.413 - DOI - PubMed
    1. Ando H, Yoshimoto S, Yoshida M, Shimoda N, Tadokoro R, Kohda H, Ishikawa M, Nishikata T, Katayama B, Ozawa T et al (2020) Dermal fibroblasts internalize phosphatidylserine-exposed secretory melanosome clusters and apoptotic melanocytes. Int J Mol Sci 21:5789 10.3390/ijms21165789 - DOI - PMC - PubMed
    1. Andrikopoulou A, Chatzinikolaou S, Panourgias E, Kaparelou M, Liontos M, Dimopoulos M-A, Zagouri F (2022) “The emerging role of capivasertib in breast cancer”. Breast 63:157–167 10.1016/j.breast.2022.03.018 - DOI - PMC - PubMed
    1. Basrur V, Yang F, Kushimoto T, Higashimoto Y, Yasumoto K, Valencia J, Muller J, Vieira WD, Watabe H, Shabanowitz J et al (2003) Proteomic analysis of early melanosomes: identification of novel melanosomal proteins. J Proteome Res 2:69–79 10.1021/pr025562r - DOI - PubMed

MeSH terms

Substances