. 2024 May;629(8014):1149-1157.
doi: 10.1038/s41586-024-07388-y. Epub 2024 May 8.

Mapping genotypes to chromatin accessibility profiles in single cells

Affiliations

Mapping genotypes to chromatin accessibility profiles in single cells

Franco Izzo et al. Nature. 2024 May.

Abstract

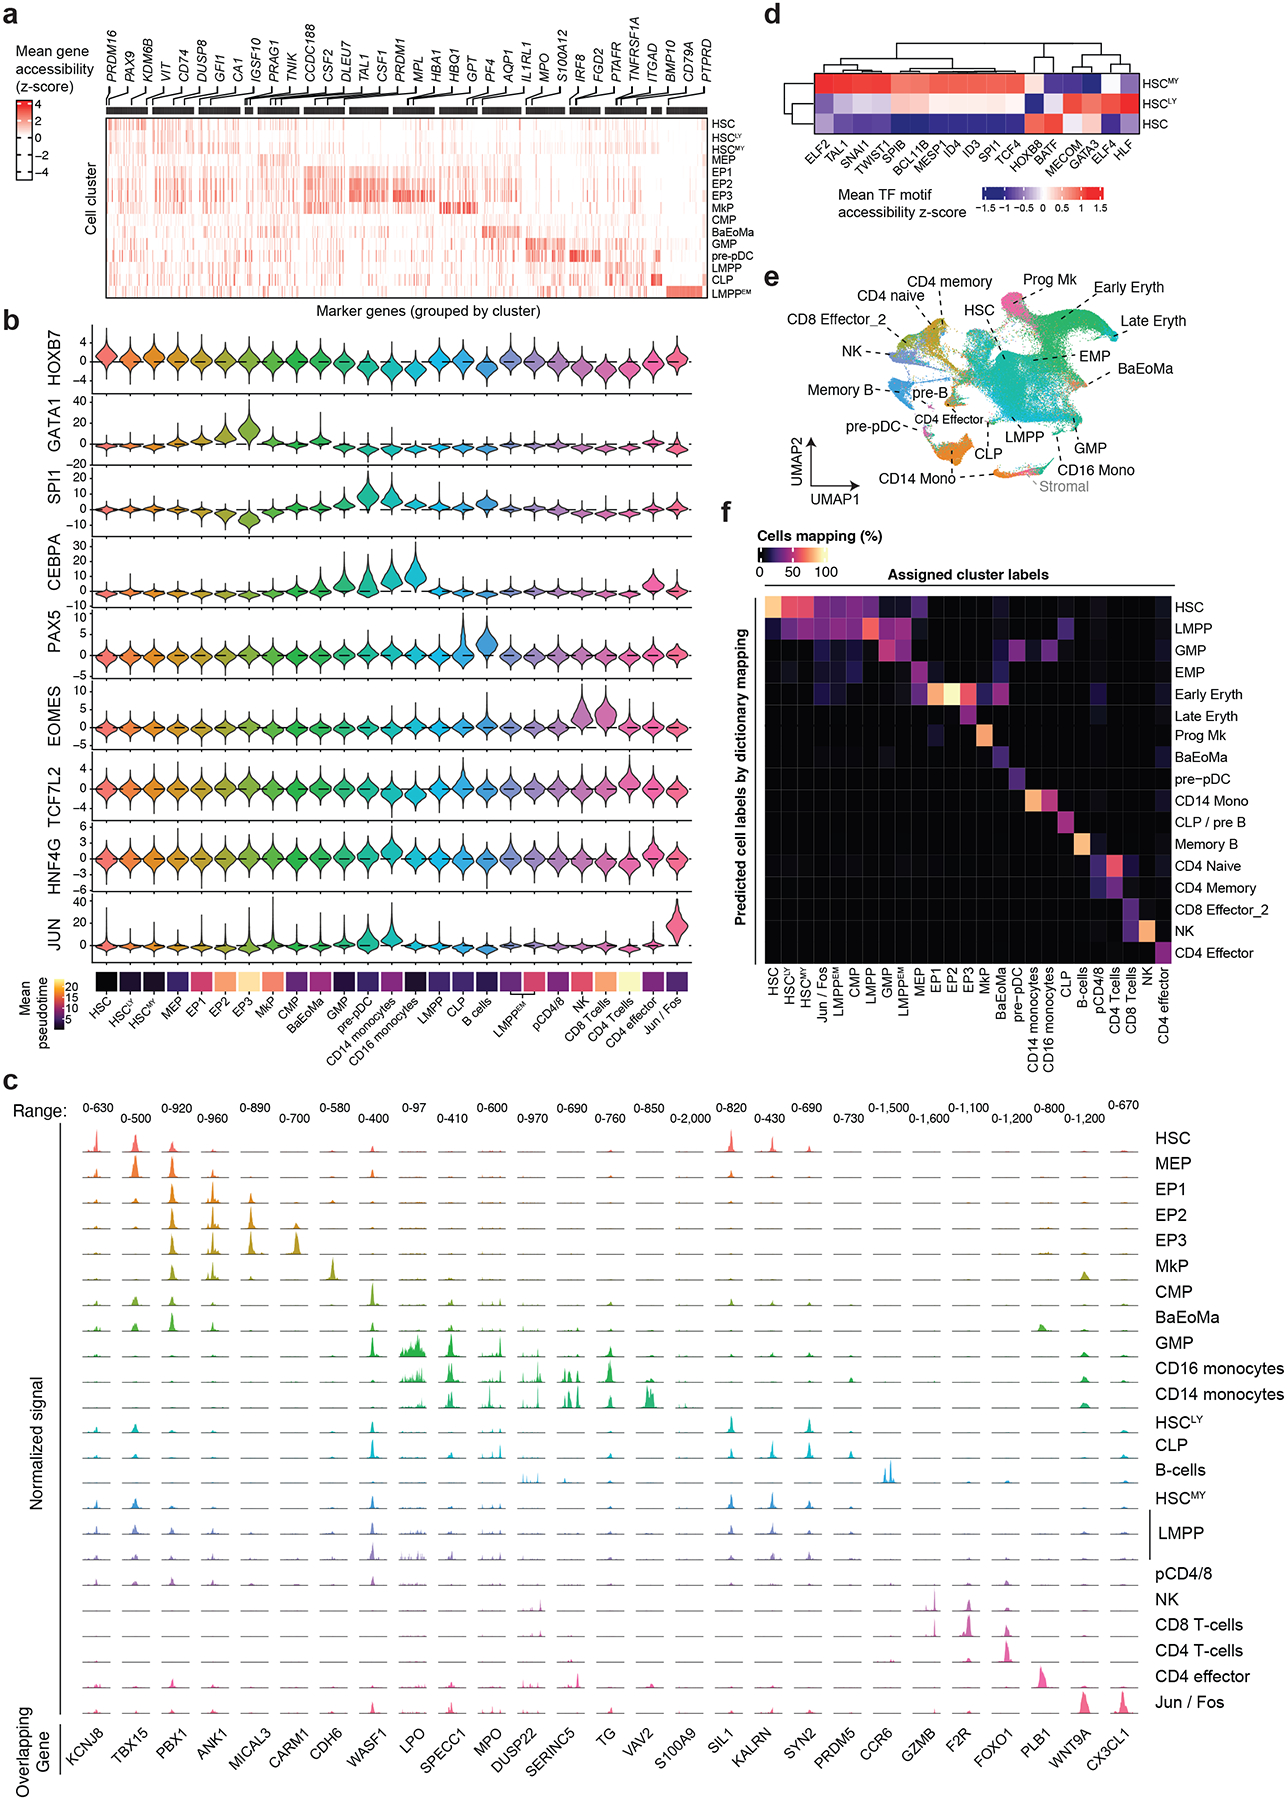
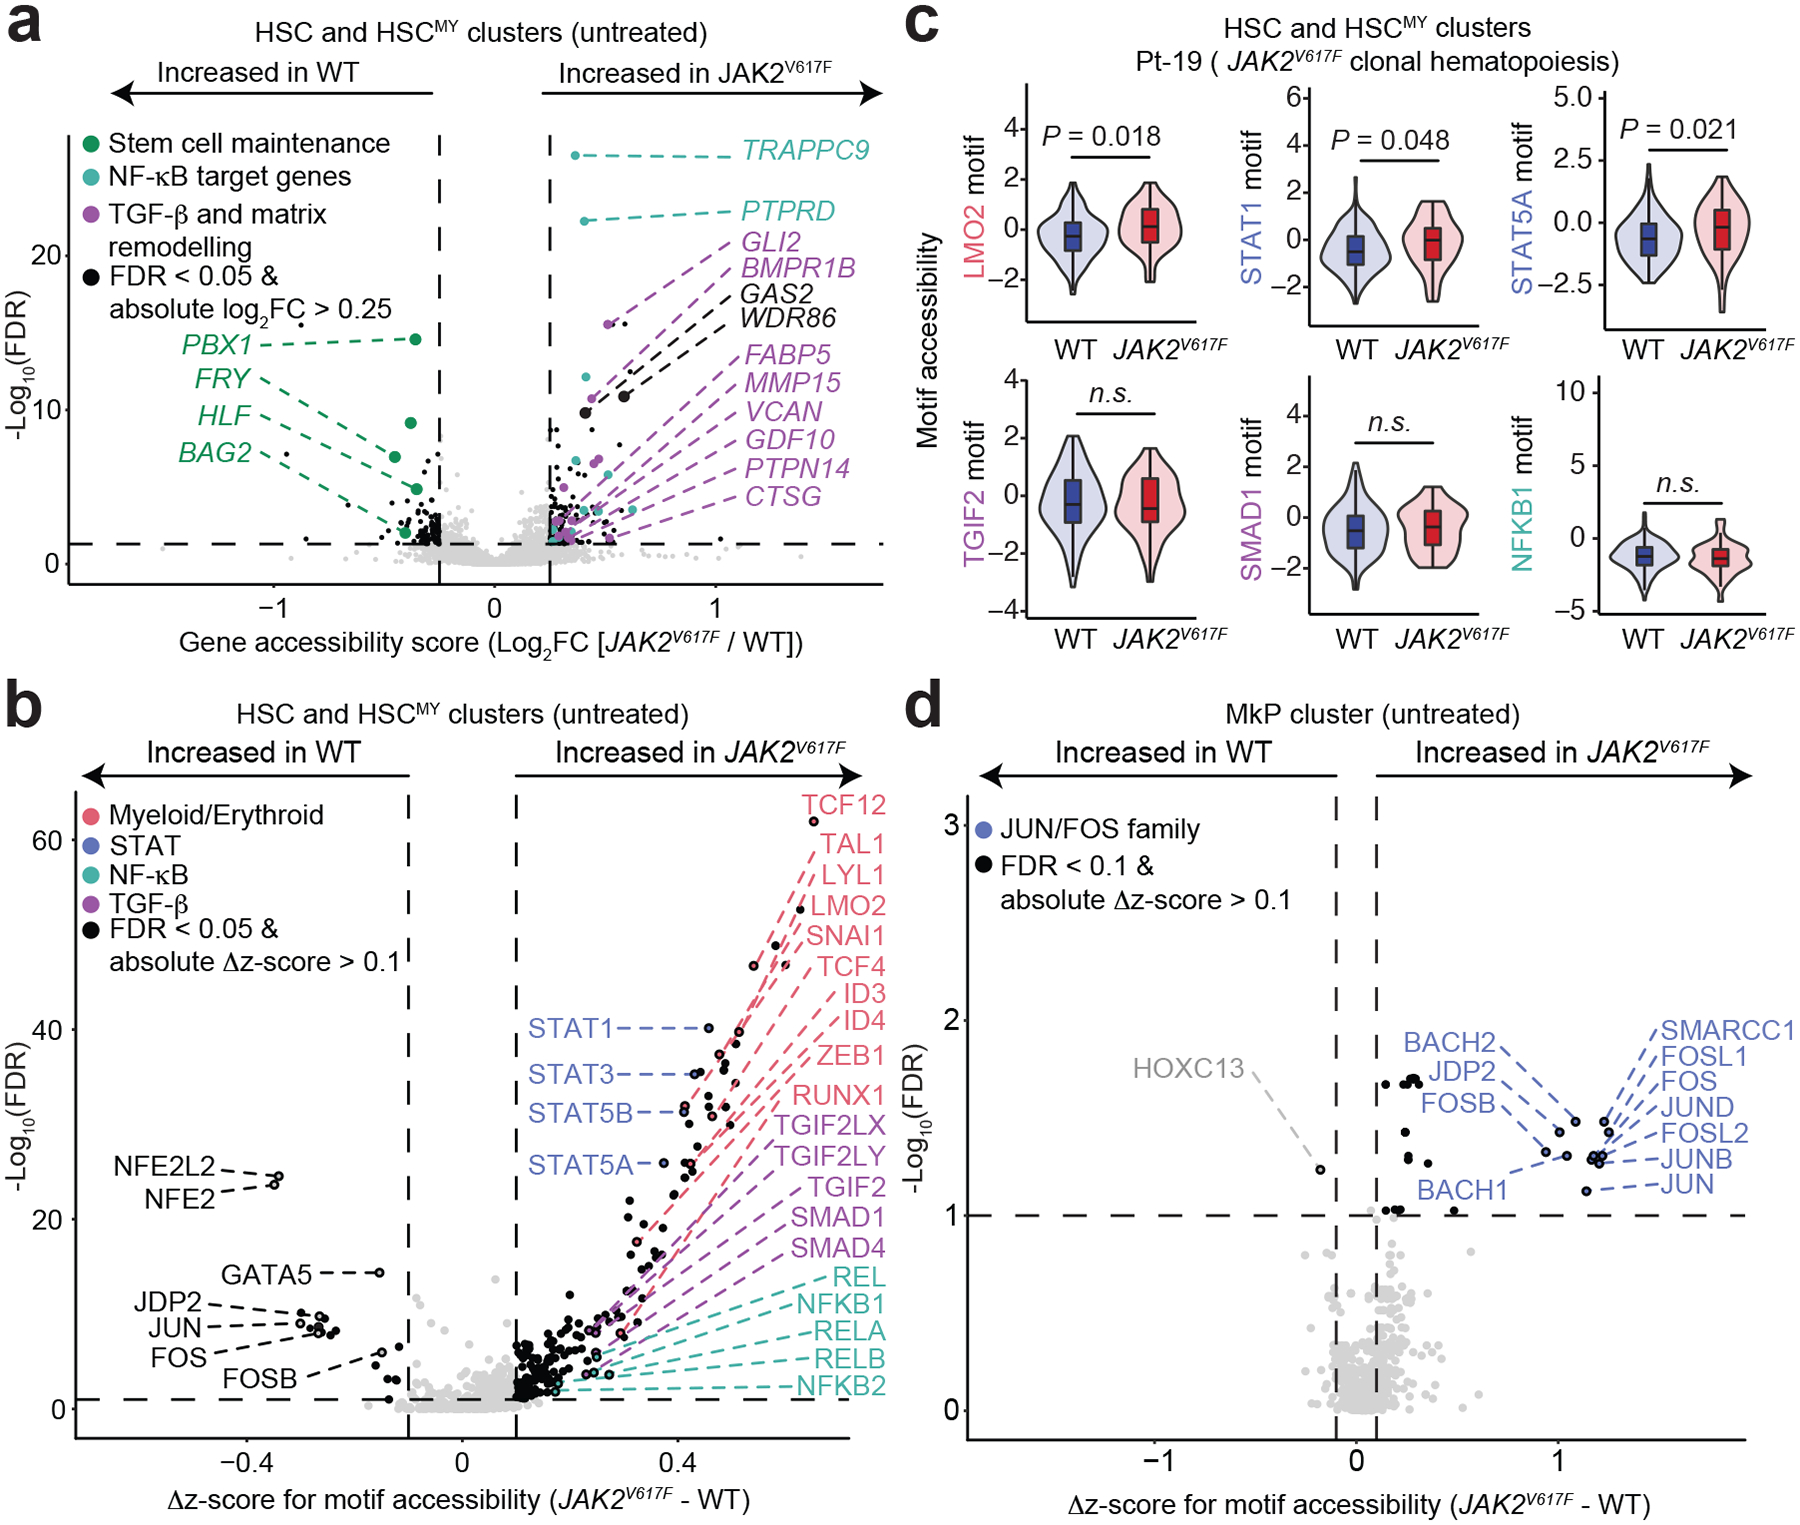
In somatic tissue differentiation, chromatin accessibility changes govern priming and precursor commitment towards cellular fates1-3. Therefore, somatic mutations are likely to alter chromatin accessibility patterns, as they disrupt differentiation topologies leading to abnormal clonal outgrowth. However, defining the impact of somatic mutations on the epigenome in human samples is challenging due to admixed mutated and wild-type cells. Here, to chart how somatic mutations disrupt epigenetic landscapes in human clonal outgrowths, we developed genotyping of targeted loci with single-cell chromatin accessibility (GoT-ChA). This high-throughput platform links genotypes to chromatin accessibility at single-cell resolution across thousands of cells within a single assay. We applied GoT-ChA to CD34+ cells from patients with myeloproliferative neoplasms with JAK2V617F-mutated haematopoiesis. Differential accessibility analysis between wild-type and JAK2V617F-mutant progenitors revealed both cell-intrinsic and cell-state-specific shifts within mutant haematopoietic precursors, including cell-intrinsic pro-inflammatory signatures in haematopoietic stem cells, and a distinct profibrotic inflammatory chromatin landscape in megakaryocytic progenitors. Integration of mitochondrial genome profiling and cell-surface protein expression measurement allowed expansion of genotyping onto DOGMA-seq through imputation, enabling single-cell capture of genotypes, chromatin accessibility, RNA expression and cell-surface protein expression. Collectively, we show that the JAK2V617F mutation leads to epigenetic rewiring in a cell-intrinsic and cell type-specific manner, influencing inflammation states and differentiation trajectories. We envision that GoT-ChA will empower broad future investigations of the critical link between somatic mutations and epigenetic alterations across clonal populations in malignant and non-malignant contexts.


Conflict of interest statement

M.S. served on the advisory board for Novartis, Kymera, Sierra Oncology, GSK, Rigel, BMS and Taiho; consulted for Boston Consulting and Dedham group and participated in GME activity for Novartis, Curis Oncology, Haymarket Media and Clinical care options. R.H. has served as a consultant for Protagonist Therapeutics, Inc., received research funding from Kartos Therapeutics, Inc., Novartis, and AbbVie Inc, and is on the Data Safety Monitoring Board of Novartis and AbbVie Inc. O.A.-W. has served as a consultant for H3B Biomedicine, Foundation Medicine Inc, Merck, Pfizer, Codify Therapeutics and Janssen, and is on the Scientific Advisory Board of Envisagenics Inc, AIChemy, and Codify Therapeutics. O.A.-W. has received prior research funding from H3B Biomedicine, LOXO Oncology, Nurix Therapeutics, Codify Therapeutics, and Minovia unrelated to the current manuscript. O.A.-W. is a scientific co-founder of Codify Therapeutics. P.S. and E.P.M. are current employees of 10x Genomics and Immunai, respectively. R.L.L. is on the supervisory board of Qiagen and is a scientific advisor to Imago, Mission Bio, Bakx, Zentalis, Ajax, Auron, Prelude, C4 Therapeutics and Isoplexis. R.L.L. has received research support from Abbvie, Constellation, Ajax, Zentalis and Prelude. R.L.L. has received research support from and consulted for Celgene and Roche and has consulted for Syndax, Incyte, Janssen, Astellas, Morphosys, and Novartis. R.L.L. has received honoraria from Astra Zeneca and Novartis for invited lectures and from Gilead and Novartis for grant reviews. D.A.L. has served as a consultant for Abbvie and Illumina and is on the Scientific Advisory Board of Mission Bio and C2i Genomics. D.A.L. has received prior research funding from BMS, 10x Genomics and Illumina unrelated to the current manuscript. R.M.M., F.I., E.P.M., R.C., P.S., and D.A.L. have filed a patent for GoT-ChA (#63/288,874). No other authors report competing interests.

Figures

Extended Data Fig. 1 |
Extended Data Fig. 1 |. GoT-ChA primers, genotyping and quality control metrics.
a, Primer design schematic for GoT-ChA. b, Primer binding sites (blue) for TP53R248 and JAK2V617 genotyping, with custom primer handles from a. c, Schematic showing GoT-ChA library construction, composed of a biotinylated hemi-nested PCR, a streptavidin-biotin pull-down, and an on-bead sample indexing PCR, resulting in genotyping libraries compatible with Illumina sequencing. d, Representative image of electrophoresis gel for GoT-ChA for two out of 21 total samples. Full length gel can be found in Supplementary Fig. 1. e, Representative bioanalyzer traces of GoT-ChA genotyping (top) and GoT-ChA scATAC (bottom) libraries for two samples. FU, fluorescent units. f, Sanger sequencing confirming known homozygosity of TP53R248 WT HEL cells and TP53R248Q mutant CA46 cells. g, Differential gene accessibility score heat map showing distinct HEL and CA46 cells in the TP53R248 mixing study (FDR < 0.05 and log2FC > 1.25; Wilcoxon rank sum test followed by Benjamini-Hochberg correction). h, Chromatin accessibility coverage of marker genes (EBF1 and GATA1; FDR < 0.05, log2FC > 1.25; Wilcoxon rank sum test followed by Benjamini-Hochberg correction), agnostic to genotyping information, used for cell line identity assignments (Methods). i, Heatmap showing heteroplasmy for mutually exclusive mitochondrial variants detected in the scATAC-seq data for HEL or CA46 cells (Methods). j, scATAC-seq library fragment size distribution for the TP53R248 mixing study, showing expected nucleosomal periodicity. k, Number of unique nuclear fragments per cell for each cell line in the TP53R248 mixing study, indicating adequate complexity of the scATAC-seq libraries (HEL n = 2,540 cells; CA46 n = 2,117 cells). l, Transcription start site (TSS) enrichment scores per cell in the TP53R248 mixing study, showing high signal-to-background ratio in the scATAC-seq data (HEL n = 2,540 cells; CA46 n = 2,117 cells). m, Histograms of WT (left) and MUT (right) number of reads per cell from the TP53R248 mixing study. Kernel density estimation (KDE) lines for overall data (red), background (yellow), and signal (pink) are shown for each genotype. n, Scatter plots comparing GoT-ChA assigned genotypes (top) compared to the true genotypes as determined by cell line identity (bottom). Dotted lines show the detected threshold for the distinction between background and signal before updated cluster assignments for both WT and MUT data. For all boxplots, error bars represent the range, boxes represent the interquartile range and lines represent the median.
Extended Data Fig. 2 |
Extended Data Fig. 2 |. Genotyping accuracy, quality control metrics, and GoT-ChA data processing for JAK2V617F locus.
a, Sanger sequencing confirmation of known genotypes for the JAK2V617 mixing study: CCRF-CEM WT cells, SET-2 heterozygous cells, and HEL homozygous mutant cells. SET-2 data confirm the known allelic ratio of 3:1 for mutated:WT alleles in this cell line. b, Heat map of differential gene accessibility score (FDR < 0.05, log2FC > 1.25; Wilcoxon rank sum test followed by Benjamini-Hochberg correction) distinguishing the CCRF-CEM, SET-2, and HEL cells used in the JAK2V617 mixing study. c, Chromatin accessibility coverage of marker genes (FDR < 0.05, log2FC > 1.25), agnostic to genotyping information used for cell line identity assignments. Wilcoxon rank sum test followed by Benjamini-Hochberg correction. d, Heatmap showing heteroplasmy of mutually exclusive mitochondrial variants detected in the scATAC-seq data for HEL, CCRF-CEM and SET-2 cells (Methods) e, Fragment size distribution for the JAK2V617 mixing study scATAC-seq library, showing expected nucleosomal periodicity. f, Scatter plots showing the number of unique nuclear fragments per cell vs. the transcriptional start site (TSS) enrichment. Dotted lines indicate the selected thresholds based on the distribution. g, Histograms of WT (left) and MUT (right) read distributions from the JAK2V617 mixing study. KDE lines for overall data (red), background (yellow), and signal (pink) are shown for each genotype. h, Scatter plots comparing GoT-ChA-assigned genotypes (left) to the true genotypes (right) as determined by cell line identity. Dotted lines indicate the initial thresholds identified between background noise and signal for either WT (vertical line) or MUT (horizontal line) data before final genotype assignment after clustering (Methods). i, JAK2V617 locus coverage (Methods). j, same as Fig. 1e for JAK2V617-mutant HEL cells (with known chromosome 9 amplification) vs healthy control (Methods). k,l, Fraction of cells genotyped by GoT-ChA (k) or GoT-ChA genotyping accuracy (l) per targeted locus copy number. Grey area, 95% confidence interval. m, Sanger sequencing confirmation of known genotypes for the FOXO1S22 (c.65C>G) mixing study: SUM159 WT cells and HEPG2 homozygous mutant cells. n, UMAP colored by GoT-ChA FOXO1S22 genotype classifications of HEPG2 (n = 8,111 cells) and SUM159 (n = 2,841 cells) assigned as wild-type (WT, blue), mutant (MUT, red), or not assignable (NA, grey) cells.
Extended Data Fig. 3 |
Extended Data Fig. 3 |. Multiplexed GoT-ChA protocol for simultaneous capture of multiple targeted loci.
a, Sanger sequencing traces showing the expected genotypes of OCI-AML3, CA46, HEL, and SET-2 cell lines for NRASQ61, TP53M133, TP53R248 and JAK2V617 utilized in the multiplexed-adapted GoT-ChA cell mixing experiment. Extended Data Fig. 2a has JAK2V617 sequencing traces for HEL and SET-2 cells. b, Accessibility-based UMAP for original GoT-ChA protocol for CA46 (grey), HEL (gold), OCI-AML3 (violet) and SET-2 (green) cells. c, Accessibility-based UMAP for multiplexing-adapted GoT-ChA protocol (Methods) for cell lines from b. d, Differential gene accessibility markers (FDR < 0.05, Log2FC > 1.25; Wilcoxon rank sum test followed by Benjamini-Hochberg correction) used for cell line identification. e, UMAP colored by GoT-ChA JAK2V617 genotypes of each cell as wild type (WT, blue), mutant (MUT, red), or not assignable (NA, grey) for original GoT-ChA (left) and multiplexed-adapted GoT-ChA (right). f-i, Same as panel e, but for NRASQ61, TP53M133, TP53R248_1 and TP53R248_2, respectively. j, Percentage of cells genotyped for targeted loci (JAKV617, NRASQ61, TP53M133, TP53R248_1 and TP53R248_2) for either GoT-ChA original or GoT-ChA adapted protocols (Methods). k, Accuracy for targeted loci and protocols as in j (Methods). l, Distribution of percentage of cells for which a given number of targeted loci were captured, for either the GoT-ChA original or multiplex adapted GoT-ChA protocols (Methods). m, Fraction of cells genotyped according to targeted gene accessibility quantile across targeted loci. Accessibility was assessed as normalized scATAC fragments mapping to the gene body; cells with zero scATAC fragments mapped to the targeted gene were assigned to the first quantile.
Extended Data Fig. 4 |
Extended Data Fig. 4 |. Quality control, data integration and doublet filtering of primary samples processed with GoT-ChA.
a, scATAC-seq library fragment size distribution for primary samples, showing expected nucleosomal periodicity. b, Distribution of the number of ATAC fragments per cell for each processed primary sample. Cells with fragment counts below 1,000 or above 50,000 were filtered out. Cell numbers are in Supplementary Table 3. c, Distribution of nucleosome signal per cell for each of the processed primary samples. Cells with nucleosome signal above 4 were filtered out. Cell numbers are in Supplementary Table 3. d, Accessibility-based UMAP for primary samples. e, Accessibility-based UMAP split according to the technology used to generate the scATAC profiles (GoT-ChA [n = 72,318 cells], GoT-ChA-ASAP [n = 62,860 cells] or DOGMA-seq [n = 15,465 cells], Methods). f, UMAP colored according to multiplet calling (Methods), either cells (n = 163,964; grey) or multiplet (n = 9,899; red) are shown. Multiplet detection rate corresponds to 5.7% of total barcodes. g, Percentage of detected multiplets according to initial Seurat clusters. Cell clusters with multiplet detection above 25% (red) were filtered out. h, Percentage of detected multiplets per primary sample before filtering. i, Count of ATAC fragments per single cell according to multiplet calling as cell (grey) or multiplet (red) for each primary sample. j, Count of detected ATAC features according to multiplet calling as cell (grey) or multiplet (red) for each primary sample. For all boxplots, error bars represent the range, boxes represent the interquartile range and lines represent the median.
Extended Data Fig. 5 |
Extended Data Fig. 5 |. Marker features for cell cluster identity assignment in primary samples.
a, Differential gene accessibility score (FDR < 0.05, log2FC > 1.25; Wilcoxon rank sum test followed by Benjamini-Hochberg correction) heatmap for each identified cell cluster. Mean gene accessibility and proportion of cells with detected accessibility is shown. b, Representative TF motif accessibility across cell clusters for primary samples (n = 21 samples). c, Genomic track examples of differentially accessible peaks (FDR < 0.05, log2FC > 1; Wilcoxon rank sum test followed by Benjamini-Hochberg correction) across cell clusters. d, Differential TF motif accessibility score (FDR < 0.05, log2FC > 0; Wilcoxon rank sum test followed by Benjamini-Hochberg correction) between HSC, HSCMY and HSCLY clusters. e, Accessibility-based UMAP colored by the predicted cell type label obtained via bridge integration mapping (Methods). f, Confusion matrix between manually annotated cluster labels and predicted labels based on scRNA-seq reference via bridge integration mapping (Methods).
Extended Data Fig. 6 |
Extended Data Fig. 6 |. Genotype assignment based on GoT-ChA read distribution for primary samples.
a, Accessibility-based UMAP colored by GoT-ChA genotype assignment (blue = WT; red = homozygous mutant; gold = heterozygous; grey = NA) for each primary sample (n = 21 samples). b, Correlation between JAK2V617F variant allele fraction (VAF) as measured by bulk DNA sequencing (Bulk DNA VAF) and pseudobulk JAK2V617F VAF as estimated from GoT-ChA genotype calls (Spearman’s ρ = 0.64; R2 = 0.51; P = 1.2 × 10⁻³; Two-sided F-test). Grey area represents the 95% confidence interval c, Genotype frequency for Pt-10 JAK2V617 locus as measured by GoT-ChA (n = 8,682 cells) or Mission Bio Tapestri (n = 2,223 cells). HET = JAK2V617F heterozygous; MUT = homozygous JAK2V617F mutant; WT = wild-type. d, Accessibility tracks of normalized ATAC signal across all genotyped cells in the dataset (n = 45,167 cells) for the JAK2 promoter region (± 2kb from transcriptional start site) for WT (n = 14,878 cells), homozygous MUT (n = 22,842 cells) and HET (n = 7,647 cells). e, Accessibility tracks of normalized ATAC signal across HSCs (n = 7,627 cells), EP1 (n = 11,816 cells), GMP (n = 10,310 cells) or MkP (n = 7,154 cells) clusters for the JAK2 promoter region (± 2kb from transcriptional start site). f, Percentage of genotyped cells according to JAK2 gene accessibility quantile. Each quantile comprises 100 randomly sampled cells. Quantiles were defined by normalized accessibility score (as reads mapping the gene for every 10,000 reads per cell, Methods), with ranges corresponding to: 0.01 – 10.84 (Quantile 1), 10.85 – 21.67 (Quantile 2), 21.68 – 32.51 (Quantile 3), 32.52 – 43.33 (Quantile 4) and 43.34 – 108.33 (Quantile 5). g, Percentage of genotyped cells and mean JAK2 gene accessibility per cell cluster (Spearman’s ρ = −0.003; R2 = 0.015; P = 0.55; Two-sided F-test). Grey area represents the 95% confidence interval. h, Accessibility tracks across the JAK2 gene body (± 2kb) for each cell cluster. The genomic coordinates corresponding to the JAK2V617F (c.1849G>T) mutation are highlighted in pink.
Extended Data Fig. 7 |
Extended Data Fig. 7 |. JAK2V617F-mutated cells are enriched in erythroid, megakaryocyte and granulocyte-monocyte progenitor cells in untreated or patients with no clinical response to ruxolitinib.
a, JAK2V617 genotyping efficiency across studies applying single-cell droplet-based genotyping, plotted as mean ± s.d. of biologically independent samples (points). b, Heatmap showing the normalized mutant fraction across indicated HSCs, MEPs, MkPs and erythroid progenitor (EP[1–3]) clusters (>20 cells genotyped) for untreated (green) or ruxolitinib-treated (yellow) clonal hematopoiesis (CH), polycythemia vera (PV) and myelofibrosis (MF) patient samples with >20 cells genotyped per cluster. c, Normalized fraction of mutated cells in HSCs (n = 1,365 cells), MEP (n = 2,565 cells), erythroid progenitors (EP1, n = 2,315 cells; EP2–3, n = 3,610 cells) and MkP (n = 1,784 cells) in untreated MF patients (each dot represents a single patient; Two-sided Wilcoxon rank sum test; error bars show standard error). d, Normalized fraction of mutated cells in HSCs (n = 1,365 cells), HSCMY (n = 2,970 cells) and GMP (n = 2,209 cells) in untreated MF patients (each dot represents a single patient; Two-sided Wilcoxon rank sum test; error bars show standard error). e, Normalized fraction of mutated cells in HSC (n = 883 cells), MEP (n = 1,352 cells), erythroid progenitors (EP1, n = 1,639 cells; EP2–3, n = 2,482 cells) and MkP (n = 907 cells) in ruxolitinib-treated MF patients (each dot represents a single patient; Two-sided Wilcoxon rank sum test; error bars show standard error). f, Normalized fraction of mutated cells in HSC (n = 883 cells), HSCMY, (n = 889 cells) and GMP (n = 2,562 cells) in ruxolitinib-treated MF patients (each dot represents a single patient; Two-sided Wilcoxon rank sum test; error bars show standard error). g, Accessibility-based UMAP colored by GoT-ChA genotype assignment for the Pt-07 sample (no on-treatment response to ruxolitinib) as WT (n = 994 cells), homozygous MUT (n = 674 cells), HET (n = 193 cells) or not assignable (NA, n = 3,448). h, Top: odds ratio between the fraction of mutated cells in each of the indicated clusters and the fraction of mutated cells for the remaining clusters (Two-sided Fisher Exact test; dots indicate the estimated odds ratio, error bars show the 95% confidence interval; the dotted line indicates an odds ratio of 1, signifying no change). Bottom: total number of cells in each cluster for which genotyping data are available. i, Pseudotime estimation as calculated by Monocle 3 (Methods) for the Pt-07 sample UMAP from (g), setting the HSC cluster as the starting point of the trajectories.
Extended Data Fig. 8 |
Extended Data Fig. 8 |. Per sample differences in TF motif accessibility and gene pathway enrichment.
a, Normalized accessibility tracks for genes with increased accessibility in JAK2V617F-mutated HSC and HSCMY clusters (BMPR1B, MMP15) or in WT cells (HLF, BAG2). b, Heatmap for examples of differentially accessible TF motifs in early HSCs and HSCMY clusters in untreated patients. Hierarchical clustering was performed and heatmap was split by rows defining two expected groups. Color scale indicates the mean z-score difference between JAK2V617F-mutated and WT cells. TF motifs are defined as upregulated (red) or downregulated (blue) in JAK2V617F. Samples with > 50 cells genotyped in the analyzed clusters were included. c, Heatmap showing the TF motif accessibility for those TF found to be statistically significant between WT (n = 1,902 cells) and JAK2V617F homozygous mutant (n = 1,885 cells) HSCs and HSCMY, including JAK2V617F heterozygous cells (n = 371 cells) for visualization. Color scale represents row scaled mean z-scores of motif accessibility for the indicated TFs. d, STAT1 TF motif accessibility in a longitudinal sample (Pt-01) that progressed from PV (n = 76 WT cells; n = 30 JAK2V617F cells) to MF (n = 192 WT cells; n = 117 JAK2V617F cells). e, Heatmap of correlation values between STAT TFs (STAT1, STAT2, STAT3, STAT4, STAT5A, STAT5B and STAT6) and TFs involved in the NF-κB pathway (NFKB1, NFKB2, REL, RELA and RELB). Color scale represents the Spearman’s ρ value. Side barplot represents the mean correlation across columns for the indicated row. f, Jak2RL experiment schematic. Bulk RNA-seq was performed on sorted LSK cells from Jak2V617F and Jak2V617F-deleted mice (top). Pre-ranked gene set enrichment of differentially expressed genes within the erythroid (FDR = 2.5 × 10⁻⁴; normalized enrichment score (NES) = −1.87; heme metabolism Hallmark gene set) and TNF via NF-kB (FDR = 4.1 × 10⁻⁴; NES = −1.59) gene sets in Jak2V617F compared to Jak2V617F-deleted mouse LSK cells (bottom). NES, normalized enrichment score. g, Differential TF motif accessibility (FDR < 0.05, absolute Δz-score > 0.1; Two-sided Wilcoxon rank sum test followed by Benjamini-Hochberg correction) in Pt-19 CH sample within the early stem cell clusters (HSC and HSCMY). h, Heatmap comparing changes in TF motif accessibility between JAK2V617F-mutated and WT early HSC and HSCMY clusters in CH (P < 0.05, absolute Δz-score > 0.1; Two-sided Wilcoxon rank sum test) or MF (FDR < 0.05, absolute Δz-score > 0.1; LMM followed by likelihood ratio test and Benjamini-Hochberg correction). Color scale represents the Δz-score. Concordant changes (black, same direction in both CH and MF) and significance (red, P < 0.05 in CH; FDR < 0.05 in MF) are shown. i, Heatmap for examples of differentially accessible TF motifs in the MkP cluster in untreated patients. Hierarchical clustering was performed and heatmap was split by rows defining two expected groups. Color scale indicates the mean z-score difference between JAK2V617F-mutated and WT cells. TF motifs are defined as upregulated (red) or downregulated (blue) in JAK2V617F. Samples with at least 50 cells genotyped in the analyzed clusters were included. j, TF footprinting for JUN comparing WT (blue) and mutant (red) in untreated (n = 12) MF patient samples. Shadowed regions-represent the 95% confidence interval. k, Gene set enrichment analysis illustrating an enrichment of Hallmark inflammatory signature in JAK2V617F-mutated MkPs compared to WT MkPs (FDR = 0.15; normalized enrichment score [NES] = 1.42). l, Schematic of mouse model experiment. m, Gene set enrichment analysis illustrating a depletion of Jun targets in Jak2V617F-deleted compared to Jak2V617F mouse MEPs (FDR = 4.9 × 10⁻⁵; normalized enrichment score [NES] = −1.75). n, Heatmap for examples of differentially accessible TF motifs in the erythroid progenitor (EP[1–3]) clusters in untreated patients. Hierarchical clustering was performed and heatmap was split by rows defining two expected groups. Color scale indicates the mean z-score difference between JAK2V617F-mutated and WT cells. TF motifs are defined as upregulated (red) or downregulated (blue) in JAK2V617F. Samples with at least 50 cells genotyped in the analyzed clusters were included. o, Gene set enrichment analysis illustrating an enrichment of heme metabolism genes in JAK2V617F erythroid progenitor clusters (EP[1–3]) compared to WT (FDR = 0.05; normalized enrichment score [NES] = 1.52). p, Heatmap showing the TF motif accessibility for those TFs found to be statistically significant between WT (n = 1,312 cells) and JAK2V617F homozygous mutant (n = 3,745 cells) EP[1–3] cells, including JAK2V617F heterozygous cells (n = 446 cells) or JAK2V617F homozygous cells (n = 3,745 cells) for visualization. Color scale represents row scaled mean z-scores of motif accessibility for the indicated TFs. q, TF footprinting for BCL11A comparing WT (blue) and mutant (red) in EPs (EP[1–3]; n = 5,925 cells) of untreated MF patient samples. Shadowed areas represent the 95% confidence interval.
Extended Data Fig. 9 |
Extended Data Fig. 9 |. Quality control, mitochondrial-based genotype imputation and protein measurements with GoT-ChA-ASAP.
a, scATAC-seq library fragment size distribution for primary samples processed through GoT-ChA-ASAP, showing expected nucleosomal periodicity. b, Distribution of scATAC fragment counts per cell for samples processed through GoT-ChA-ASAP. Cells with fragment counts below 1,000 or above 50,000 were filtered out (Methods). c, Distribution of nucleosome signal per cell for samples processed through GoT-ChA-ASAP. Cells with nucleosome signal above 4 were filtered out (Methods). d, Lineage tree of HSPCs from a patient (ET1) with essential thrombocythemia (ET) built from 21,430 clonal SNVs detected within the single-cell expanded clones across the whole genome using CellPhy. Terminal nodes are colored based on JAK2 genotype. Cell heteroplasmies for two mitochondrial mutations are shown in the heatmap on the right. e, Heatmap of heteroplasmy of mitochondrial variants per cell per patient sample (Methods). f, Correlation of TF motif accessibility mean Δz-score between JAK2V617F-mutated and WT early HSC and HSCMY clusters between cells genotyped via GoT-ChA-ASAP or via mitochondrial-based genotype imputation for Pt-02 (Pearson’s ρ = 0.94; R2 = 0.88; P < 2.2 × 10⁻¹⁶; Two-sided F-test, shadowed area represents the 95% confidence interval). g, Pt-02 UMAP colored by genotype from GoT-ChA (n = 7,763 cells), GoT-ChA-ASAP (n = 11,602 cells), GoT-ChA-ASAP with mtDNA-based genotype imputation (n = 11,602 cells) or DOGMA-seq with mtDNA-based genotype imputation (n = 15,465 cells), showing percent of genotyped cells. h, Pearson correlation values between mutant cell fractions for each cluster for Pt-02 between methods in g or shuffled control. i, UMAP from g, colored by cell-surface protein expression from GoT-ChA-ASAP.
Extended Data Fig. 10 |
Extended Data Fig. 10 |. Integrated mitochondrial-based genotype imputation with chromatin accessibility, gene expression and protein measurements using GoT-ChA-ASAP.
a, Differential cell surface protein expression rank between JAK2V617F-mutated and WT HSCMY cells in ruxolitinib-treated patients (LMM followed by likelihood ratio test and Bonferroni correction). b, CD90 protein expression in the HSCMY cluster for patients processed with GoT-ChA-ASAP with > 50 genotyped cells in the cluster. Patient Pt-08 was removed due to the presence of additional mutations. Two-sided Wilcoxon rank sum test; Δ represents the effect size. c, CD90 (THY1 gene) imputed gene accessibility scores in HSC and HSCMY clusters for untreated MF samples (n = 12); excluding Pt-01 (PV) and Pt-02, or ruxolitinib-treated samples (n = 6). LMM modeling patient identity as random effects, followed by likelihood ratio test. d, Flow cytometry gating for measurements of CD90 mean fluorescence intensity (MFI) in HSCs defined as Lineage, CD45+, CD34+, CD38, CD45RA cells. e, Correlation between CD90 mean fluorescence intensity (MFI) and JAK2V617F variant allele fraction (VAF) in HSCs. (Two-sided F-test). f, Correlation between CD90 MFI and JAK2V617F variant allele fraction (VAF) in the hematopoietic progenitor cell (HPC) compartment defined as Lineage, CD45+, CD34+, CD38+, CD45RA cells (n = 71 patients; P > 0.05 [n.s.]; Two-sided F-test; grey area represents the 95% confidence interval). g, Comparison of correlation between JAK2V617F VAF and CD90 MFI within HPCs or HSCs (Methods). Dots represent Spearman’s ρ values, error bars represent the 95% confidence interval, the dotted line marks zero (no correlation). Two-sided F-test. h, CD90 protein expression as measured by MissionBio Tapestri (Methods) in Pt-11 (n = 195 cells WT; n = 62 cells JAK2V617F); Two-sided Wilcoxon rank sum test. The trend towards increased CD90 in JAK2V617F-mutated HSCs does not reach statistical significance due to low cell number (Two-sided Wilcoxon rank sum test). i, Accessibility track for THY1 in WT (blue) or JAK2V617F-mutated (red) HSC and HSCMY cells defined by mitochondrial-based genotype imputation in the Pt-02 sample processed through DOGMA-seq. Imputed THY1 expression at the RNA level is shown in the violin plot on the right panel (P < 2.2 × 10⁻¹⁶; Two-sided Wilcox rank sum test). Peak to gene expression linkage is shown (FDR < 0.05; color scale shows the correlation value). j, Correlation between WT vs JAK2V617F changes in RNA expression or gene accessibility for the same gene in HSC + HSCMY clusters for Pt-02 DOGMA-seq data. Two-sided F-test. k, RNA expression levels for Pt-02 HSC and HSCMY clusters for BMPR1B (top) and FRY (bottom) in WT (n = 467 cells) and JAK2V617F-mutated cells (n = 163 cells). Two-sided Wilcoxon rank sum test. l, Correlation between WT vs JAK2V617F changes in RNA expression or gene accessibility for the same gene in MkP cluster for Pt-02 DOGMA-seq data. Two-sided F-test. m, CD36 protein expression in the MkP cluster for either untreated (n = 225 cells WT; n = 550 cells JAK2V617F) or ruxolitinib-treated (n = 36 cells WT; n = 108 cells JAK2V617F) MF patients (Two-sided Wilcoxon rank sum test). For all boxplots, error bars represent the range, boxes represent the interquartile range and lines represent the median.
Fig. 1 |
Fig. 1 |. GoT-ChA profiles single-cell genotypes with chromatin accessibility.
a, GoT-ChA workflow (Methods). b, TP53R248 mixing study (top) and accessibility-based uniform manifold approximation and projection (UMAP; bottom) for HEL (TP53WT/WT) and CA46 (TP53MUT/MUT) cells. c, TP53R248 locus coverage (Methods). d, UMAP colored by GoT-ChA genotyping of CA46 and HEL cells assigned as wild type (WT), mutant (MUT), or not assignable (NA). e, scATAC-seq inferred copy number variation (CNV) scores in TP53R248 WT HEL cells (with known chromosome 9 amplification) or mutant cells (Methods). f, JAK2V617 mixing study (top) and chromatin accessibility-based UMAP for HEL (JAK2MUT/MUT), CCRF-CEM (JAK2WT/WT) and SET-2 (JAK2WT/MUT) cells (bottom). g, Chromatin accessibility-based UMAP for HEL (n = 1,334 cells), SET-2 (n = 1,268 cells) and CCRF-CEM (n = 638 cells) colored by GoT-ChA genotyping of homozygous WT, homozygous mutant (MUT), heterozygous (HET), and not assignable (NA) cells. SET-2 genotyping showing multi-allelic capture in a subset of cells (inset, Methods). h, Multiplex-adapted GoT-ChA cell mixing experiment (top) and chromatin accessibility-based UMAP for multiplexing GoT-ChA targeting four distinct loci, colored by cell line for OCI-AML3, SET-2, HEL and CA46 cells. i, Chromatin accessibility-based UMAP colored by multiplexed GoT-ChA genotype for JAK2V617, TP53M133, NRASQ61 and TP53R248. j, Percentage of cells with 0 to 4 genotyped loci per single cell.
Fig. 2 |
Fig. 2 |. GoT-ChA applied to human JAK2V617F-mutated myelofibrosis samples.
a, Chromatin accessibility UMAP after reciprocal latent semantic indexing (LSI) integration (Methods) from CD34+-sorted patient samples (n = 21 samples, 19 patients, 150,643 cells). Cell types in Supplementary Table 3. b, Integrated UMAP with GoT-ChA-assigned JAK2V617 genotypes: homozygous wild type (WT), homozygous mutant (MUT), heterozygous (HET) and not assignable (NA). c, Density estimation of WT, HET or MUT cell distribution across UMAP embedding. LY, lymphoid; EM, erythroid/megakaryocyte. Dotted lines highlight increased density. d, Same as c for untreated (top) or ruxolitinib-treated (bottom) patients. e, Cell density difference (Δ density) between mutated and WT for untreated (top) and ruxolitinib-treated (bottom) patients. Dotted lines highlight changes in Δdensity. f, Normalized mutant fraction along erythroid pseudotime quantiles for untreated (n = 9,855 cells) or ruxolitinib-treated (n = 6,356 cells) samples, with quantiles 9–10 merged to increase cell number; points represent mean mutant cell fraction, error bars indicate standard error across samples, lines indicate the fit and shadowed areas represent the 95% confidence interval of the generalized additive model (top).
Fig. 3 |
Fig. 3 |. JAK2V617F-mutant HSPCs exhibit intrinsic pro-inflammatory and myeloid-biased epigenetic priming.
a, Differential gene accessibility scores between WT (n = 1,868 cells) and mutant (n = 1,814 cells) cells within the HSC and HSCMY clusters of untreated MF patients (n = 12; excluding CH and PV sample). Horizontal dotted line represents FDR = 0.05; vertical dotted lines represent absolute log2FC > 0.1. b, Differentially accessible TF motifs between WT (n = 1,858 cells) and JAK2V617F-mutant (n = 1,800 cells) cells from untreated MF patients with > 50 genotyped cells in the cluster (n = 11 MF samples; excluding CH and PV samples). Horizontal dotted line represents FDR = 0.05; vertical dotted lines represent absolute Δz-score > 0.1. c, TF motif accessibility for WT or JAK2V617F-mutated HSC and HSCMY clusters (n = 240 cells) for a patient with JAK2V616F CH. Error bars represent the range, boxes represent the interquartile range and lines represent the median. Two-sided Wilcoxon rank sum test. d, Differential TF motif accessibility between WT (n = 378 cells) and mutant (n = 1,521 cells) within the MkP cluster of untreated MF patients with > 50 genotyped cells in the cluster (n = 7 patients). Horizontal dotted line represents FDR = 0.05; vertical dotted lines represent absolute Δz-score > 0.1. a,b,d, Linear mixed model (LMM) followed by Benjamini-Hochberg correction.
Fig. 4 |
Fig. 4 |. JAK2V617F-driven epigenetic dysregulation of EP hemoglobin locus.
a, EP[1–3] differential TF motif accessibility between WT (n = 1,372 cells) and mutant (n = 3,796 cells) cells of untreated MF patient samples (n = 8) with > 50 cells per cluster. Horizontal line represents FDR = 0.05; vertical lines represent absolute Δz-score > 0.1. LMM followed by likelihood ratio test and Benjamini-Hochberg correction. b, Co-accessibility (correlation > 0.1, FDR < 0.05; Two-sided Wilcoxon rank sum test and Benjamini-Hochberg correction) at the HBG1 locus for WT or JAK2V617F cells (down-sampled to n = 1,372 cells per genotype). Hemoglobin locus control region (LCR), BCL11A motifs, normalized accessibility signal tracks for WT or JAK2V617F-mutated EPs, gene annotations and peak regions are shown. Co-accessibility centered on peaks (shaded boxes) for an HBG1 enhancer (top); negative control: peak with no BCL11A motif (bottom). Inset: HBG1 proximal peaks. Differential peak accessibility was calculated by Fisher Exact test followed by Bonferroni correction. FWER shown for each peak, n.s., not significant (FWER > 0.05). c, BCL11A motif accessibility for Pt-01 PV (n = 37 WT cells; n = 201 JAK2V617F cells) to MF (n = 213 WT cells; n = 1,690 JAK2V617F cells). Two-sided Wilcoxon rank sum test. d, Percentage of EP[1–3] with HBG1 gene accessibility for Pt-01. Two-sided Fisher test. e, Percent of fetal hemoglobin (HbF) positive EPs via flow cytometry of mobilized peripheral blood of healthy individuals or MF patients with JAK2V617F mutation. Two-sided Wilcoxon rank sum test. f, Flow cytometry gating of EPs for sorting HbF positive or negative cells. g, Sanger sequencing traces for sorted cells from f. Grey area, expected base change (c.1849G>T). For all boxplots, error bars, range; boxes, interquartile range; lines, median.
Fig. 5 |
Fig. 5 |. GoT-ChA integration with ASAP-seq.
a, Mitochondrial genome (mtDNA) coverage (sample Pt-02) for GoT-ChA-ASAP, DOGMA-seq or GoT-ChA. b, Pt-02 mitochondrial variant heteroplasmy per cell, showing 12,786 A>G and 3,834 G>A variants that co-occur with GoT-ChA genotyping. c, Percent of JAK2V617-genotyped cells across technologies plotted as mean ± s.d.; dots represent individual samples. Dotted line shows increased percent of genotyped cells for Pt-02 after mtDNA-based genotype imputation. d, Differential protein expression between WT and mutant cells within the HSCMY cluster. LMM followed by likelihood ratio test and Bonferroni correction. e, Normalized CD90 protein levels across clusters in WT or JAK2V617F-mutated cells in untreated MF patients, plotted as mean ± 95% confidence interval. Cell numbers are in Supplementary Table 10. f, Dynamics of CD36-associated features in MkPs pseudotime trajectory, min-max normalized for visualization. DORC, domains of open regulatory chromatin. Two-sided F-test. Shadowed regions represent the 95% confidence interval.

References

    1. Corces MR et al. Lineage-specific and single-cell chromatin accessibility charts human hematopoiesis and leukemia evolution. Nat Genet 48, 1193–1203 (2016). - PMC - PubMed
    1. Buenrostro JD et al. Single-cell chromatin accessibility reveals principles of regulatory variation. Nature 523, 486–490 (2015). - PMC - PubMed
    1. Ma S et al. Chromatin Potential Identified by Shared Single-Cell Profiling of RNA and Chromatin. Cell 183, 1103–1116.e20 (2020). - PMC - PubMed
    1. Izzo F et al. DNA methylation disruption reshapes the hematopoietic differentiation landscape. Nat Genet 52, 378–387 (2020). - PMC - PubMed
    1. Nam AS et al. Single-cell multi-omics of human clonal hematopoiesis reveals that DNMT3A R882 mutations perturb early progenitor states through selective hypomethylation. Nat Genet 54, 1514–1526 (2022). - PMC - PubMed

MeSH terms