. 2024 Jun;6(6):1128-1142.
doi: 10.1038/s42255-024-01039-2. Epub 2024 May 8.

Systematic analysis of NDUFAF6 in complex I assembly and mitochondrial disease

Affiliations

Systematic analysis of NDUFAF6 in complex I assembly and mitochondrial disease

Andrew Y Sung et al. Nat Metab. 2024 Jun.

Abstract

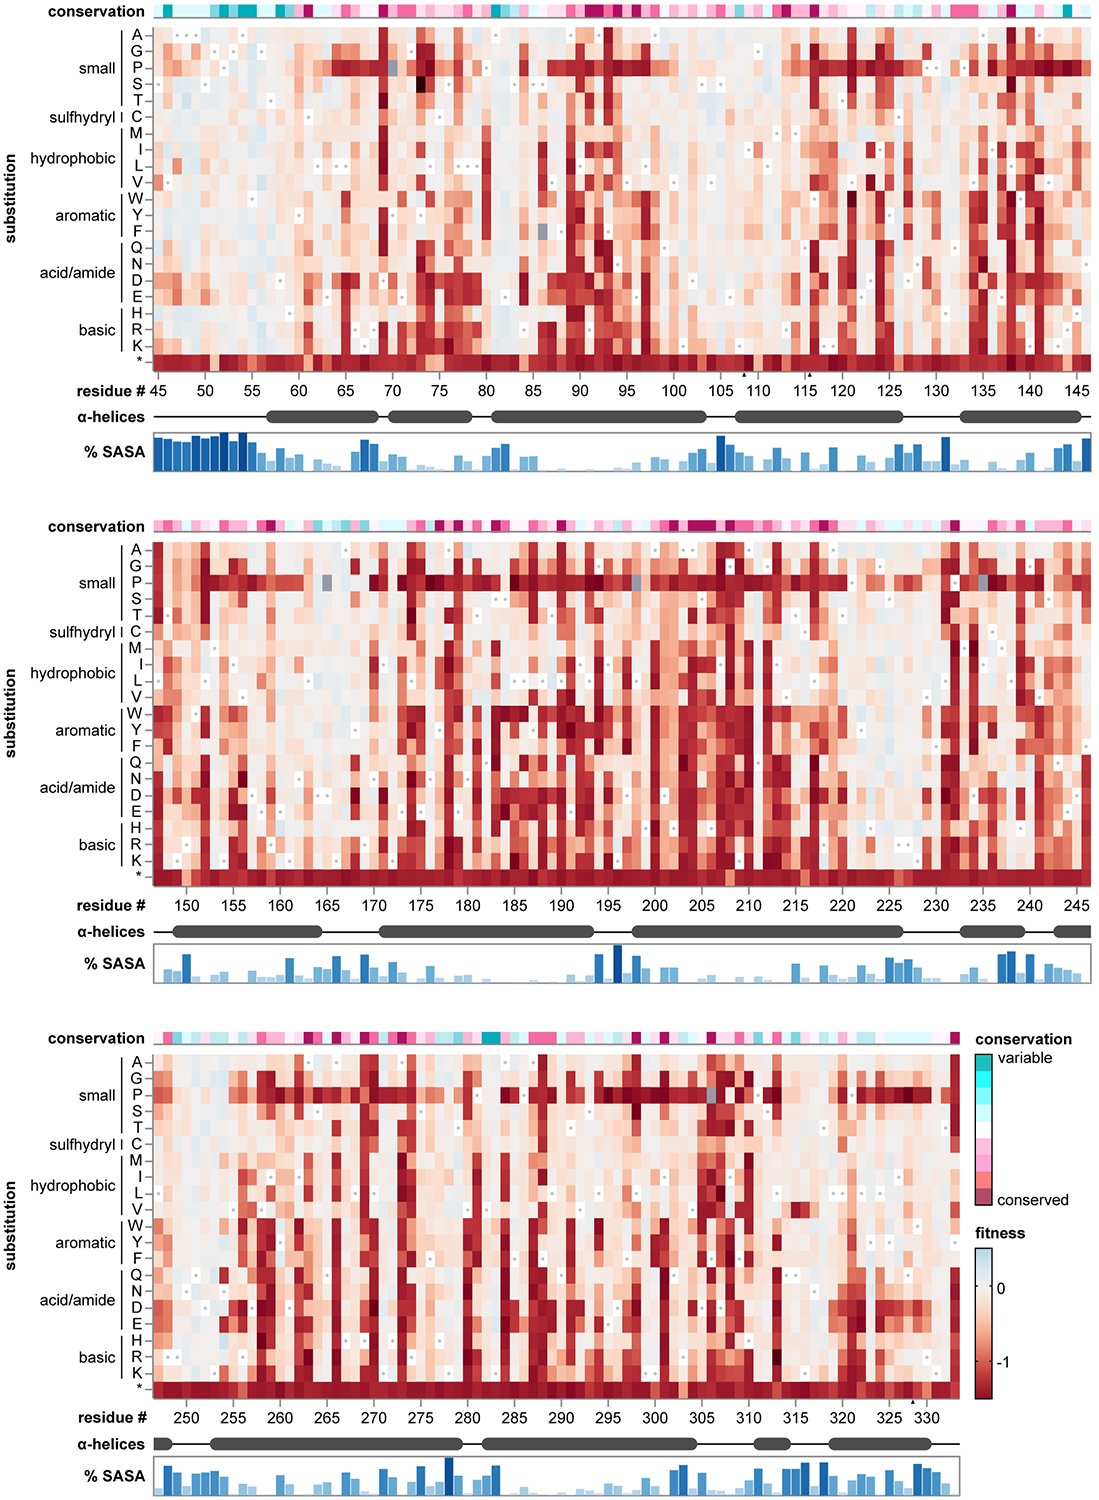
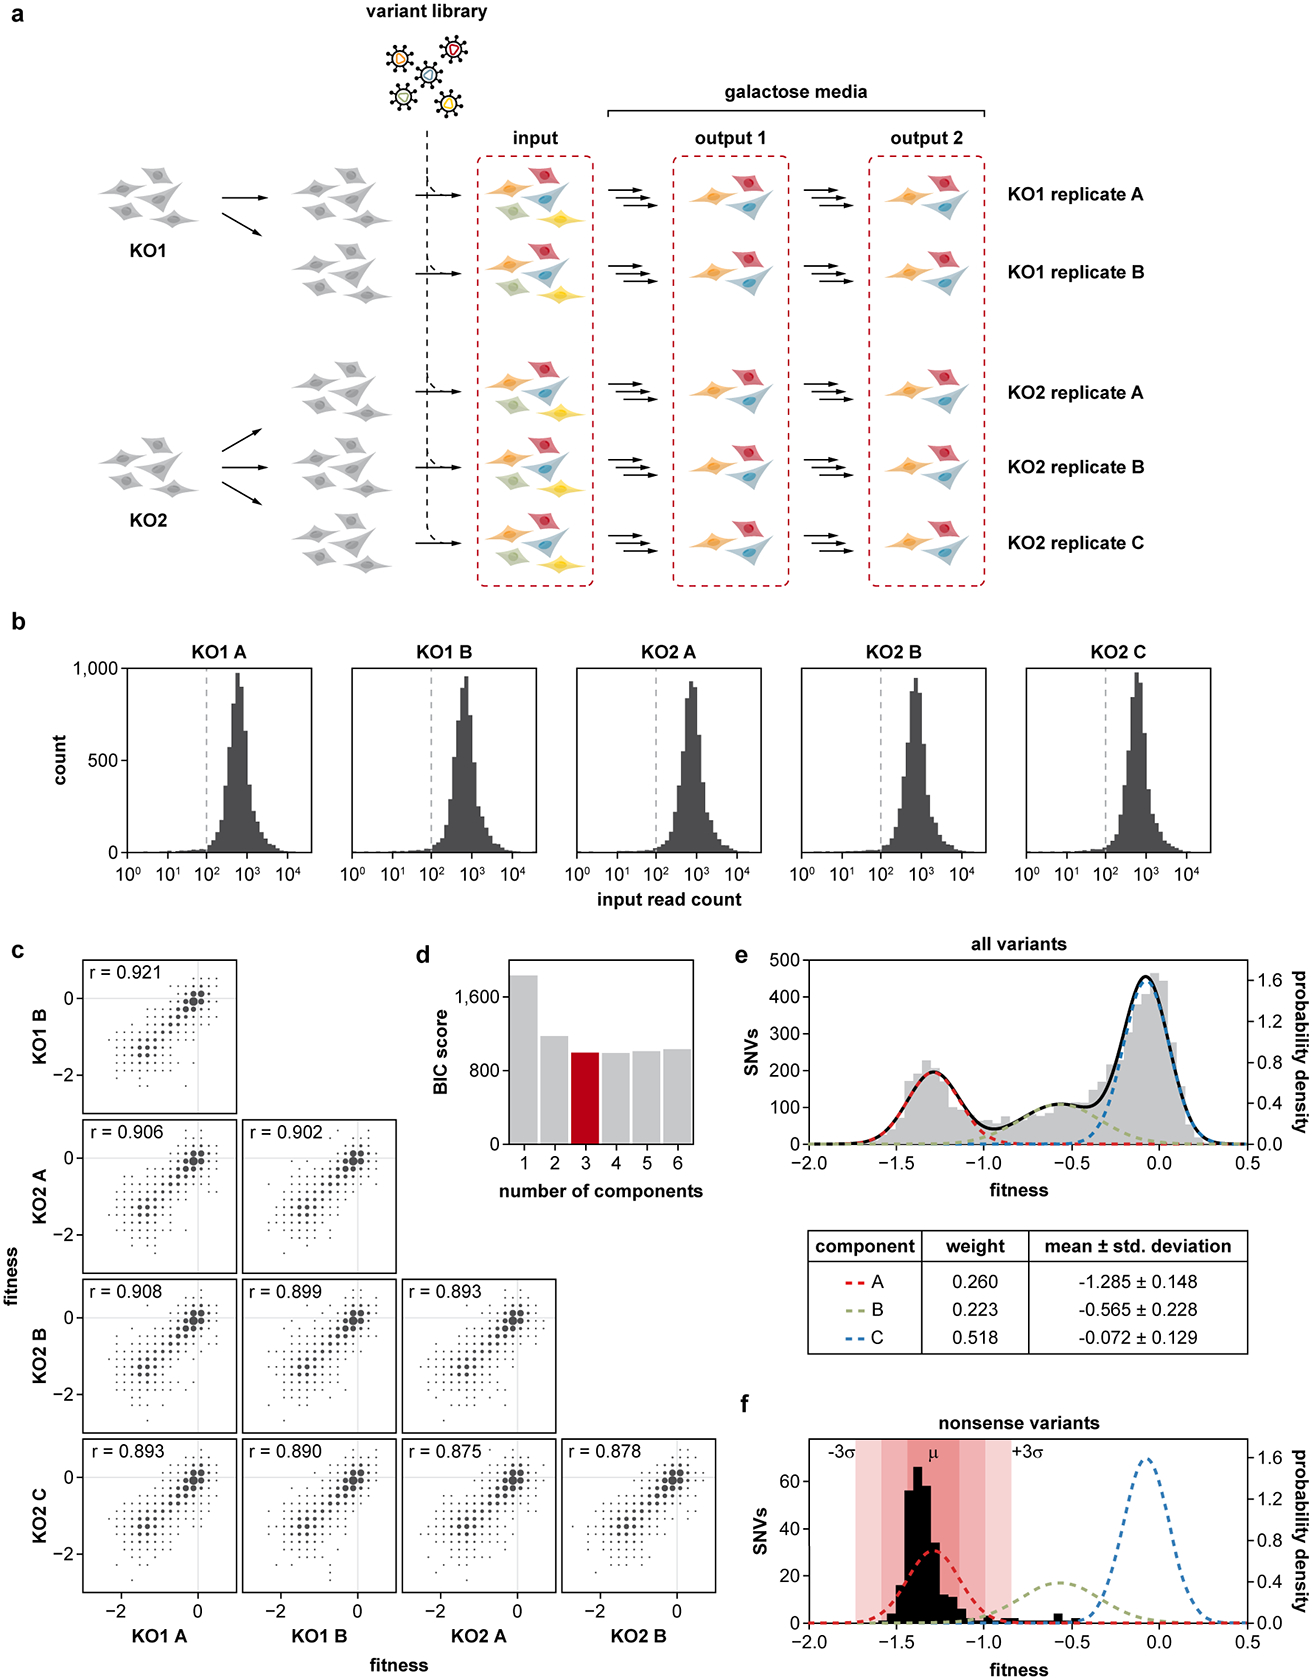
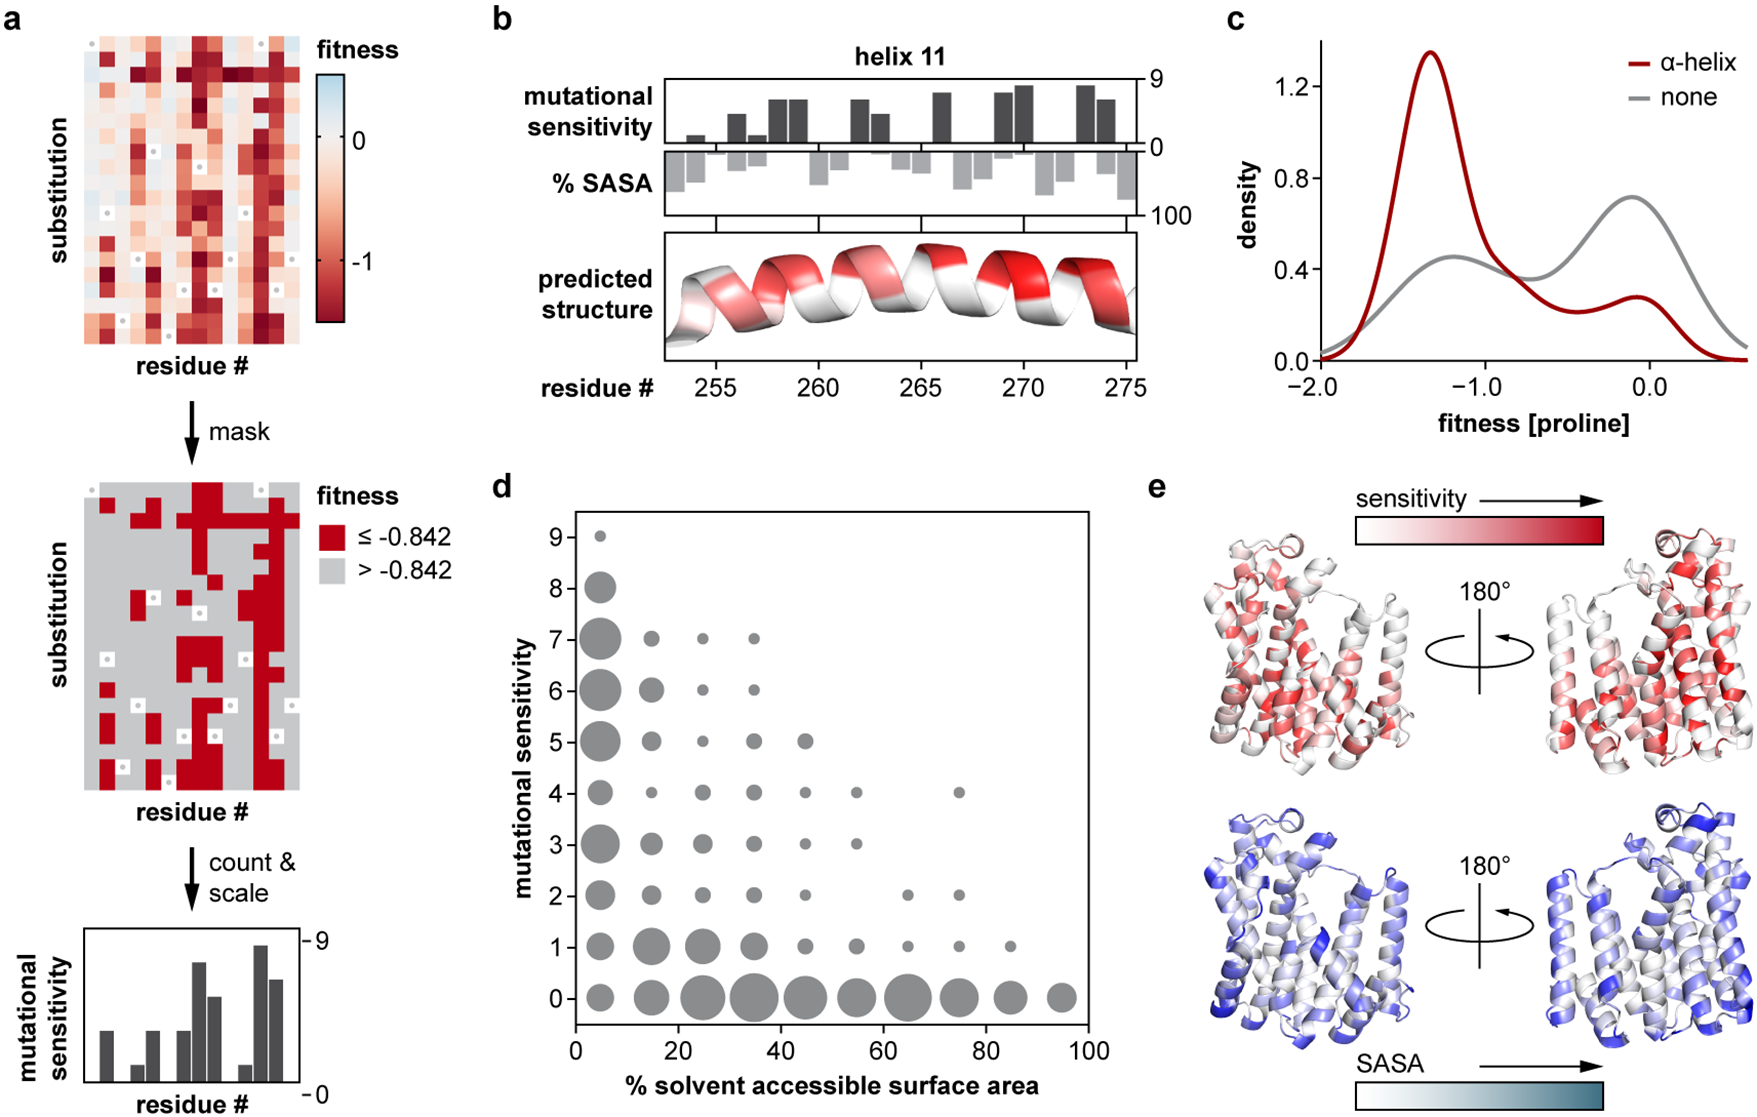
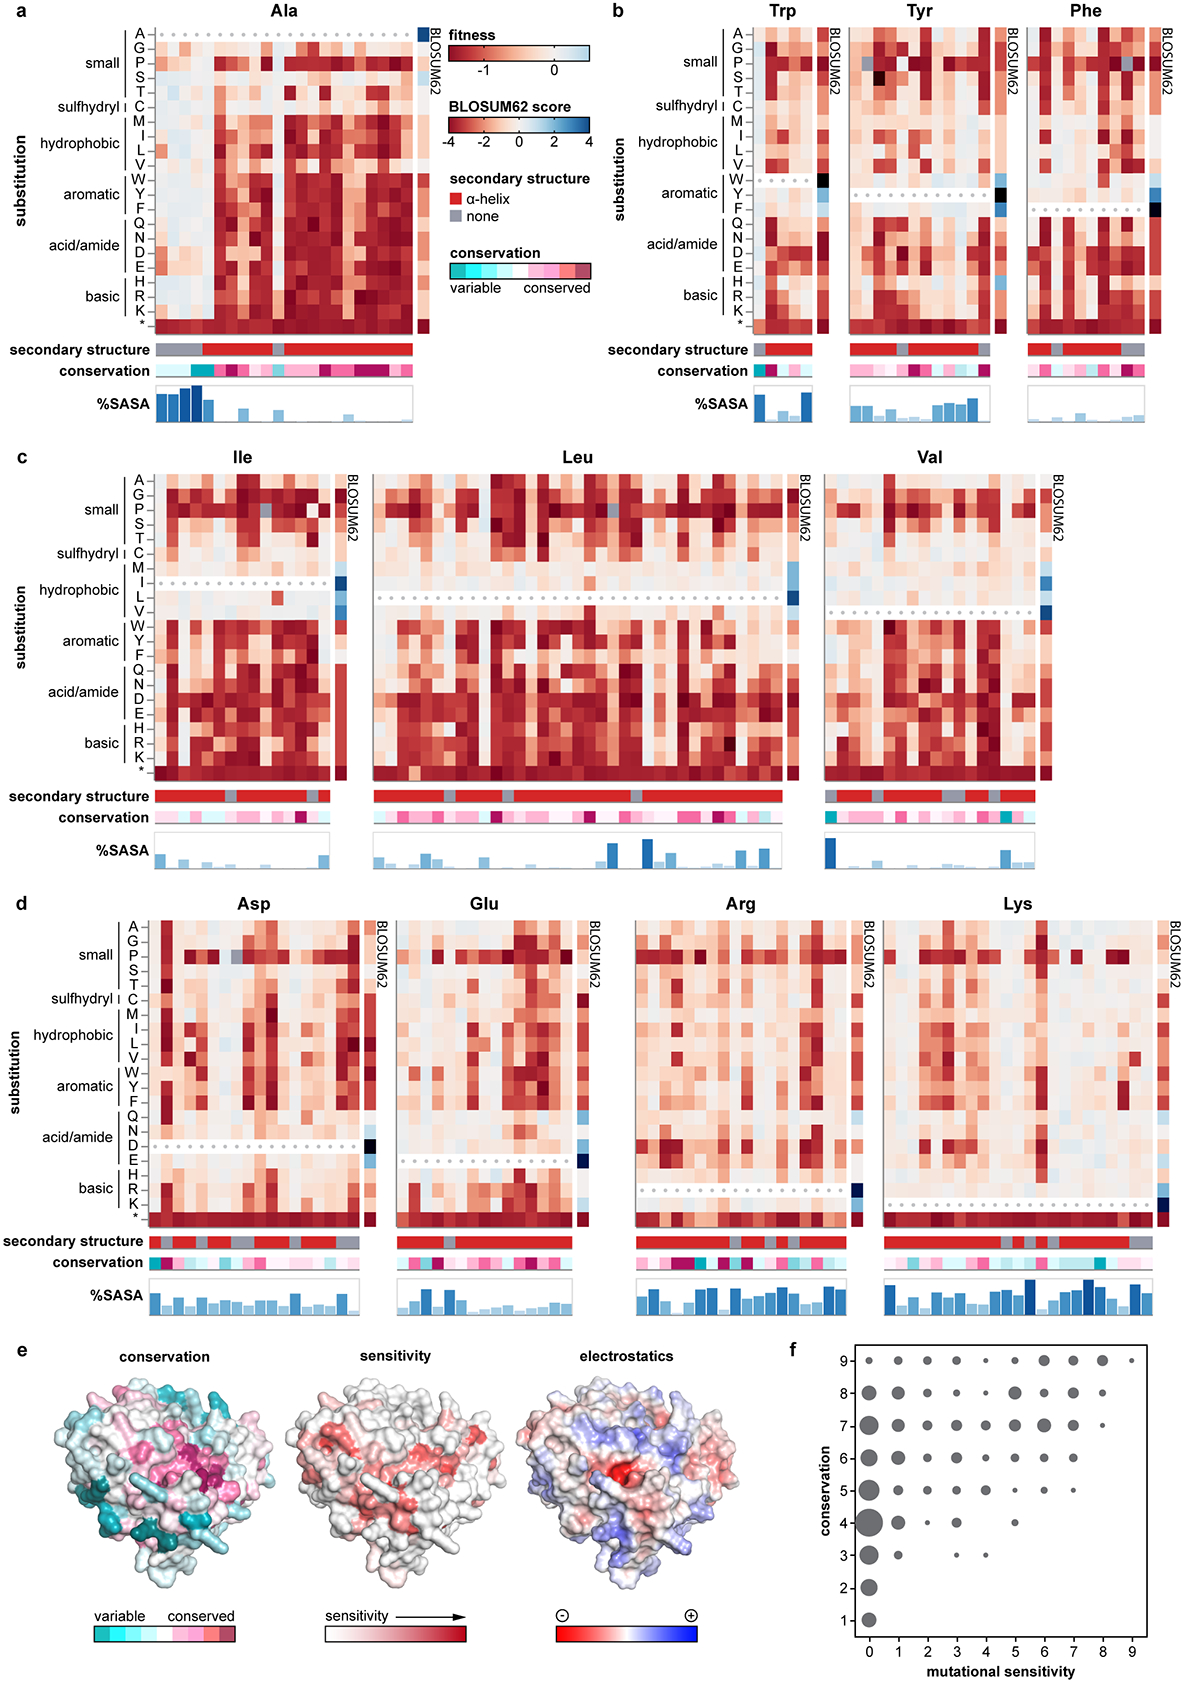
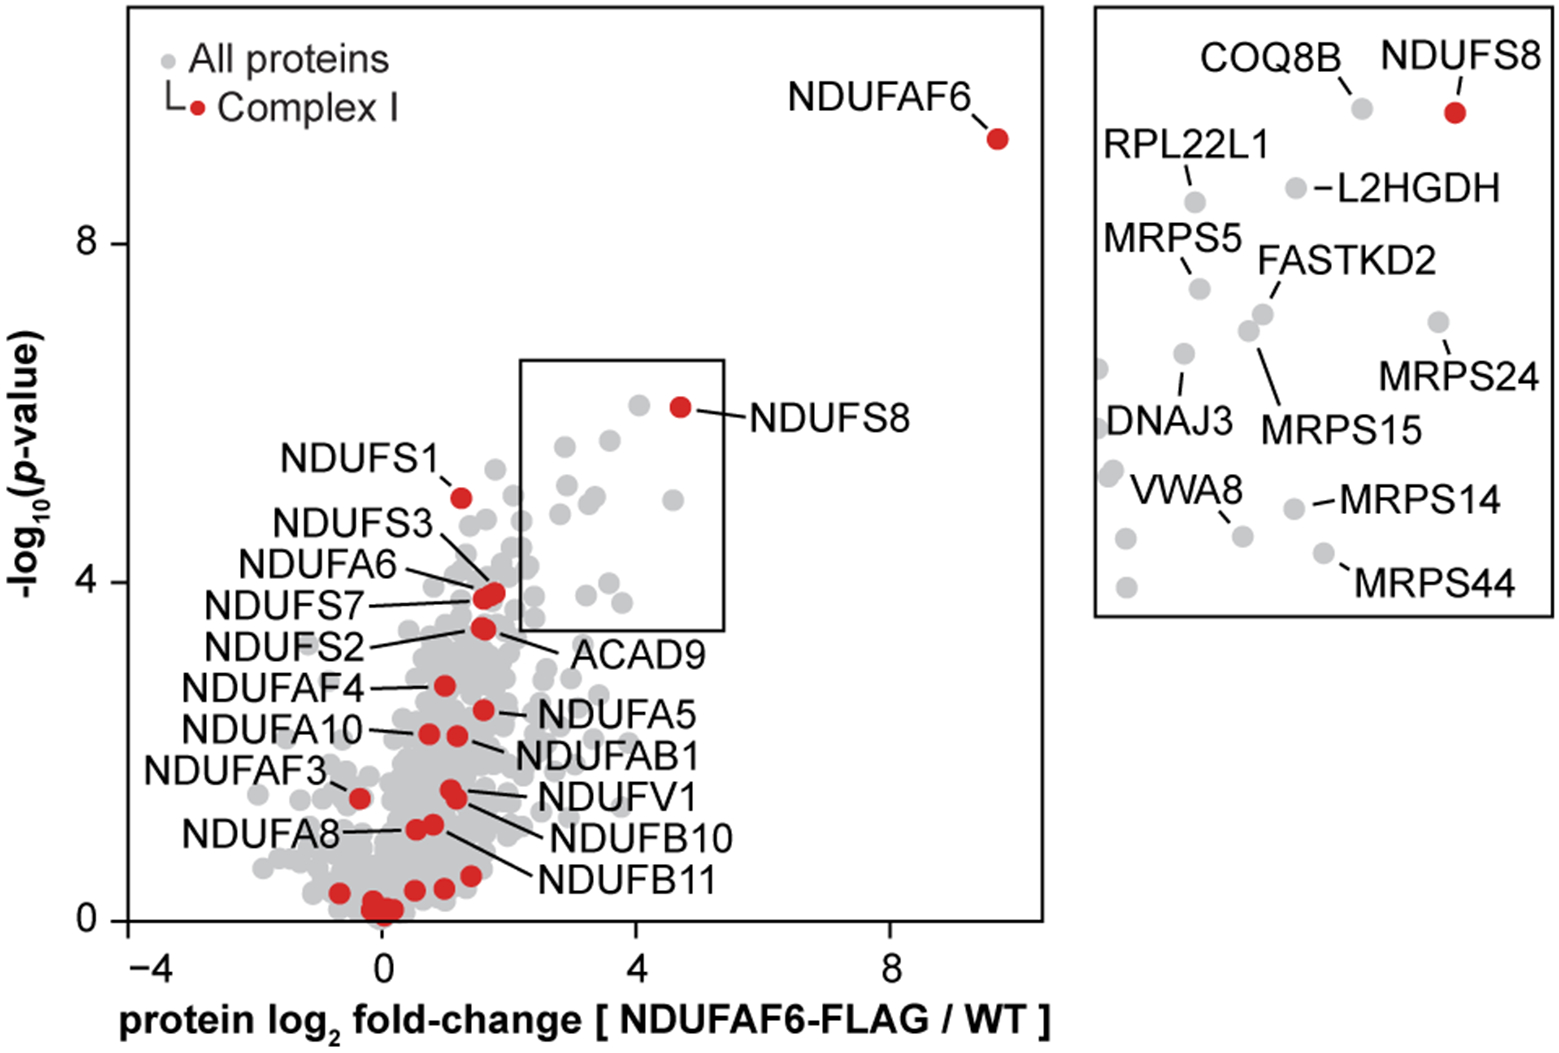
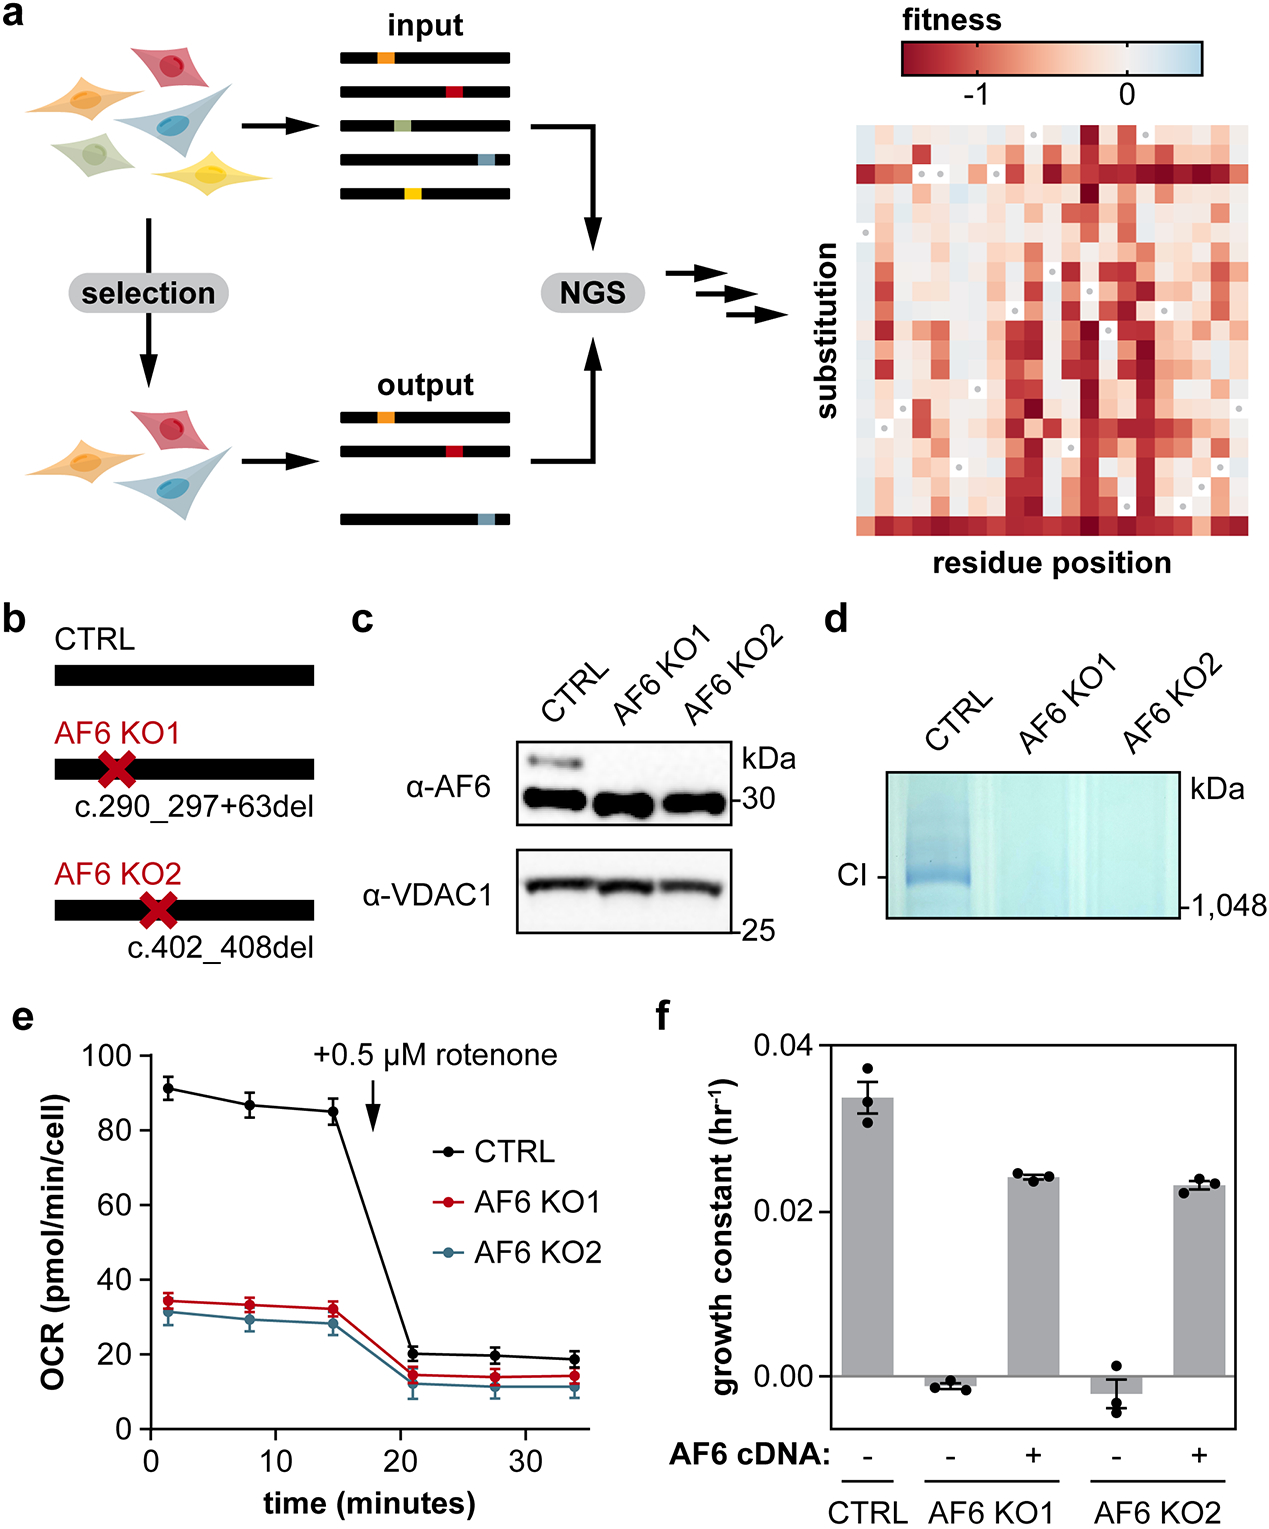
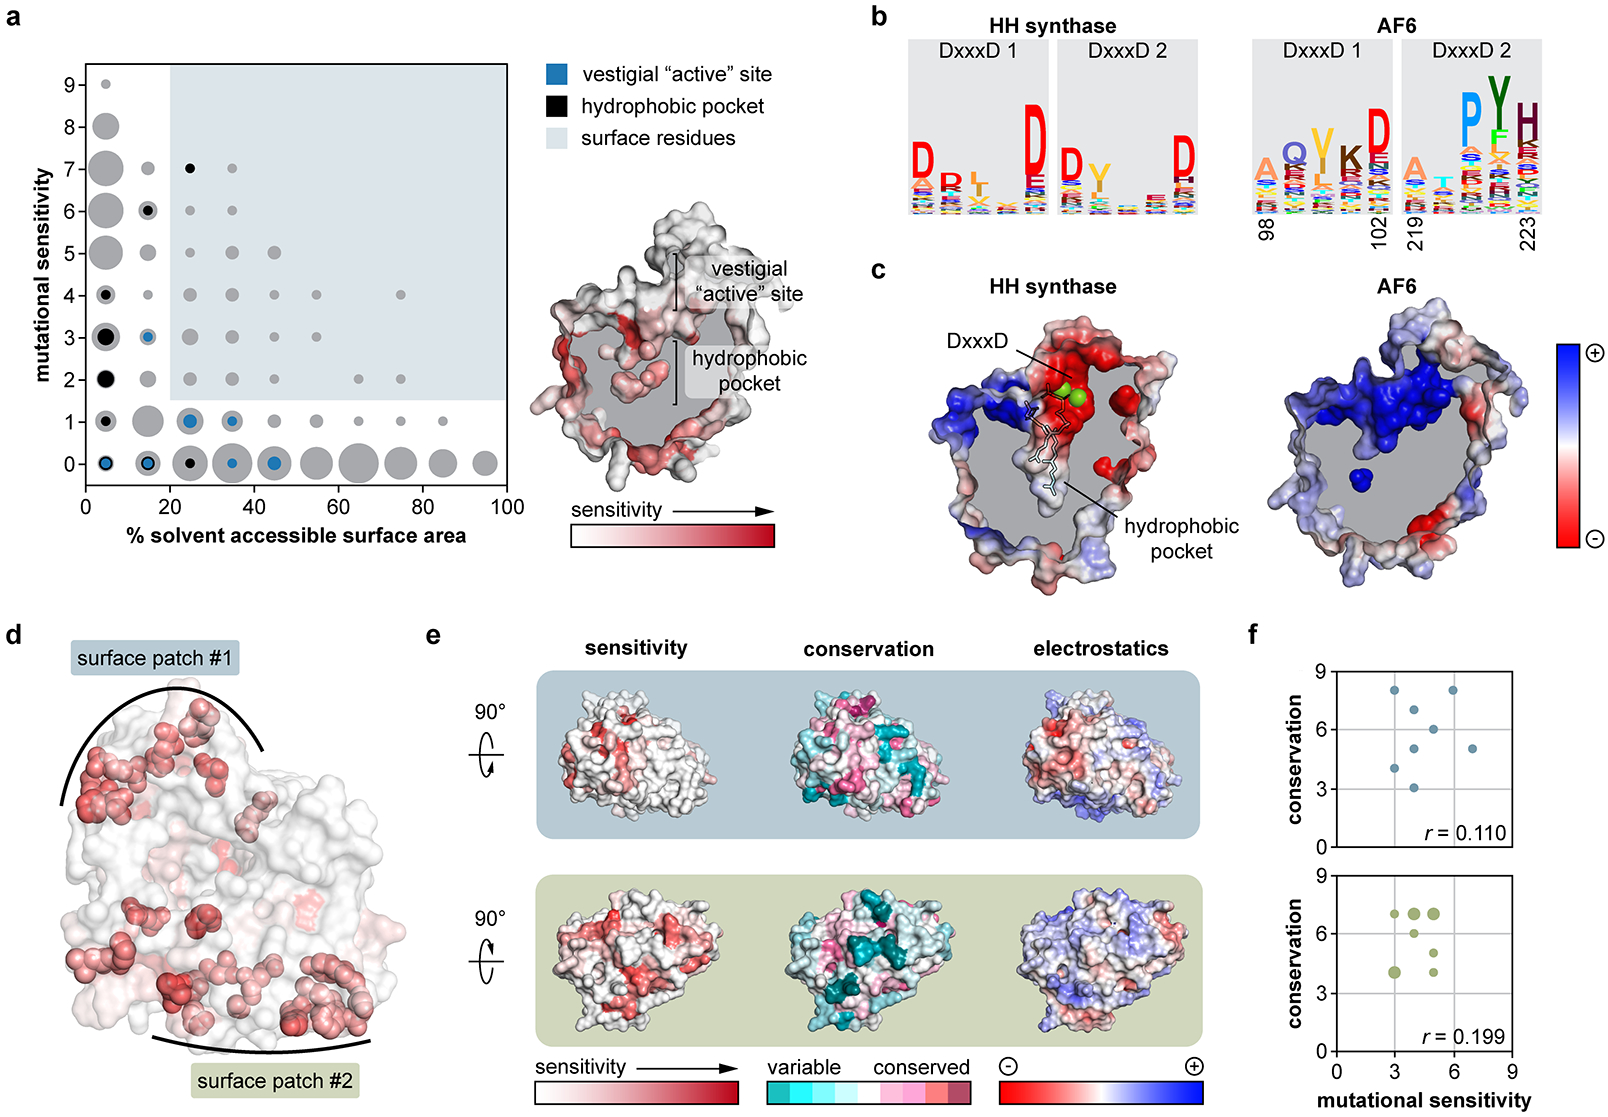
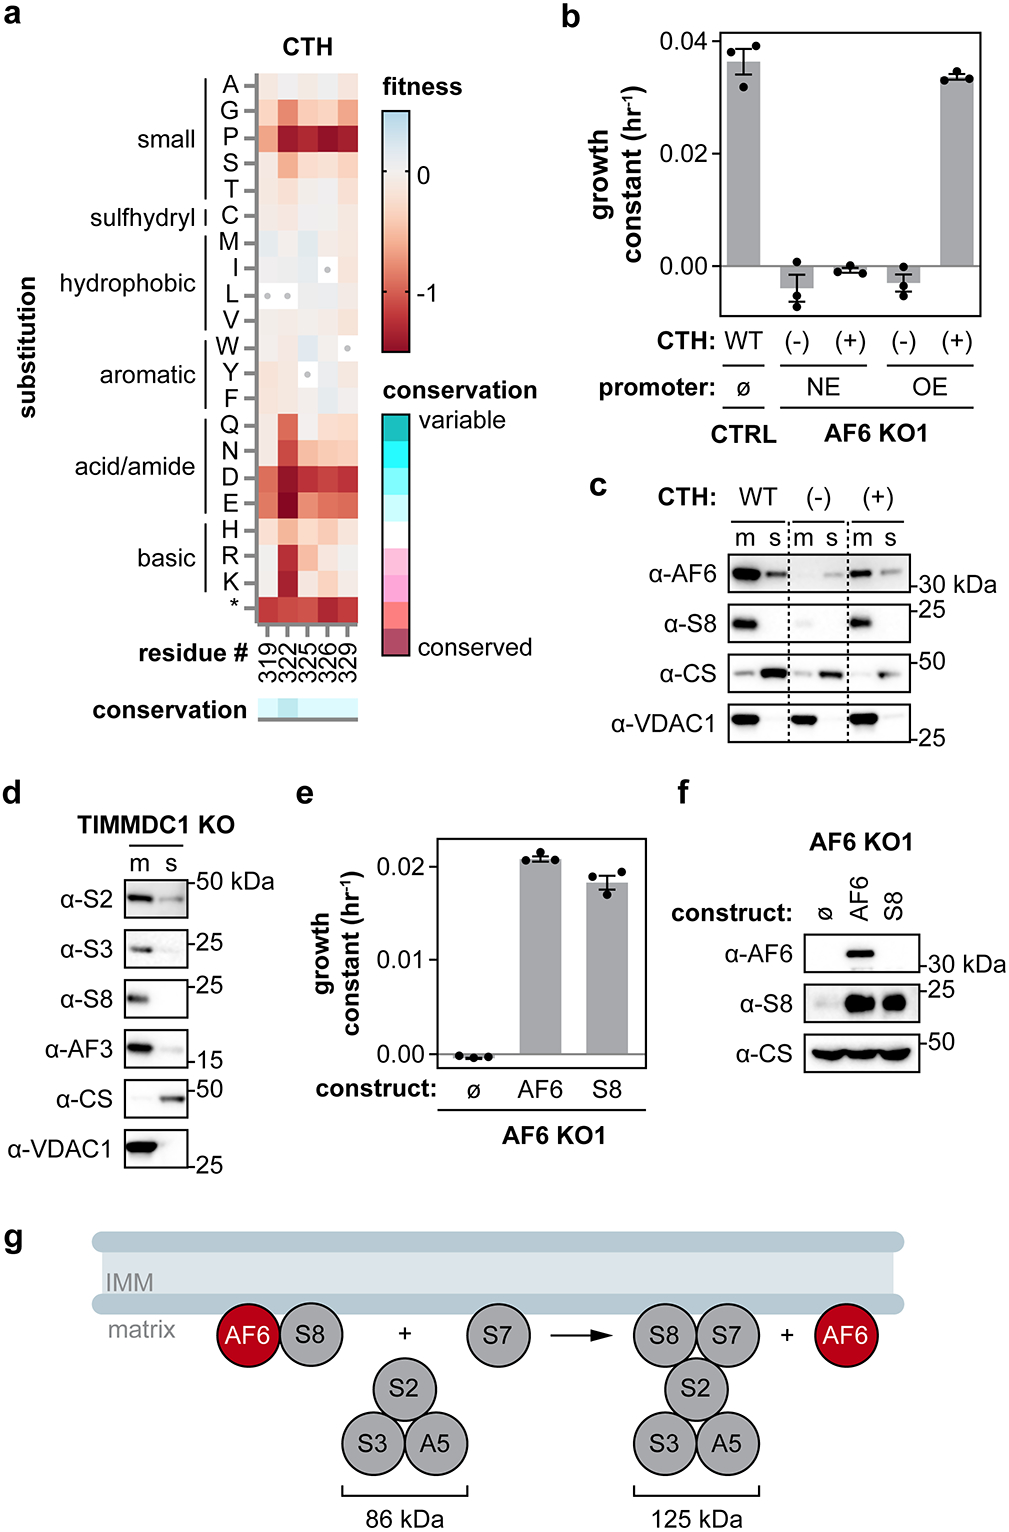
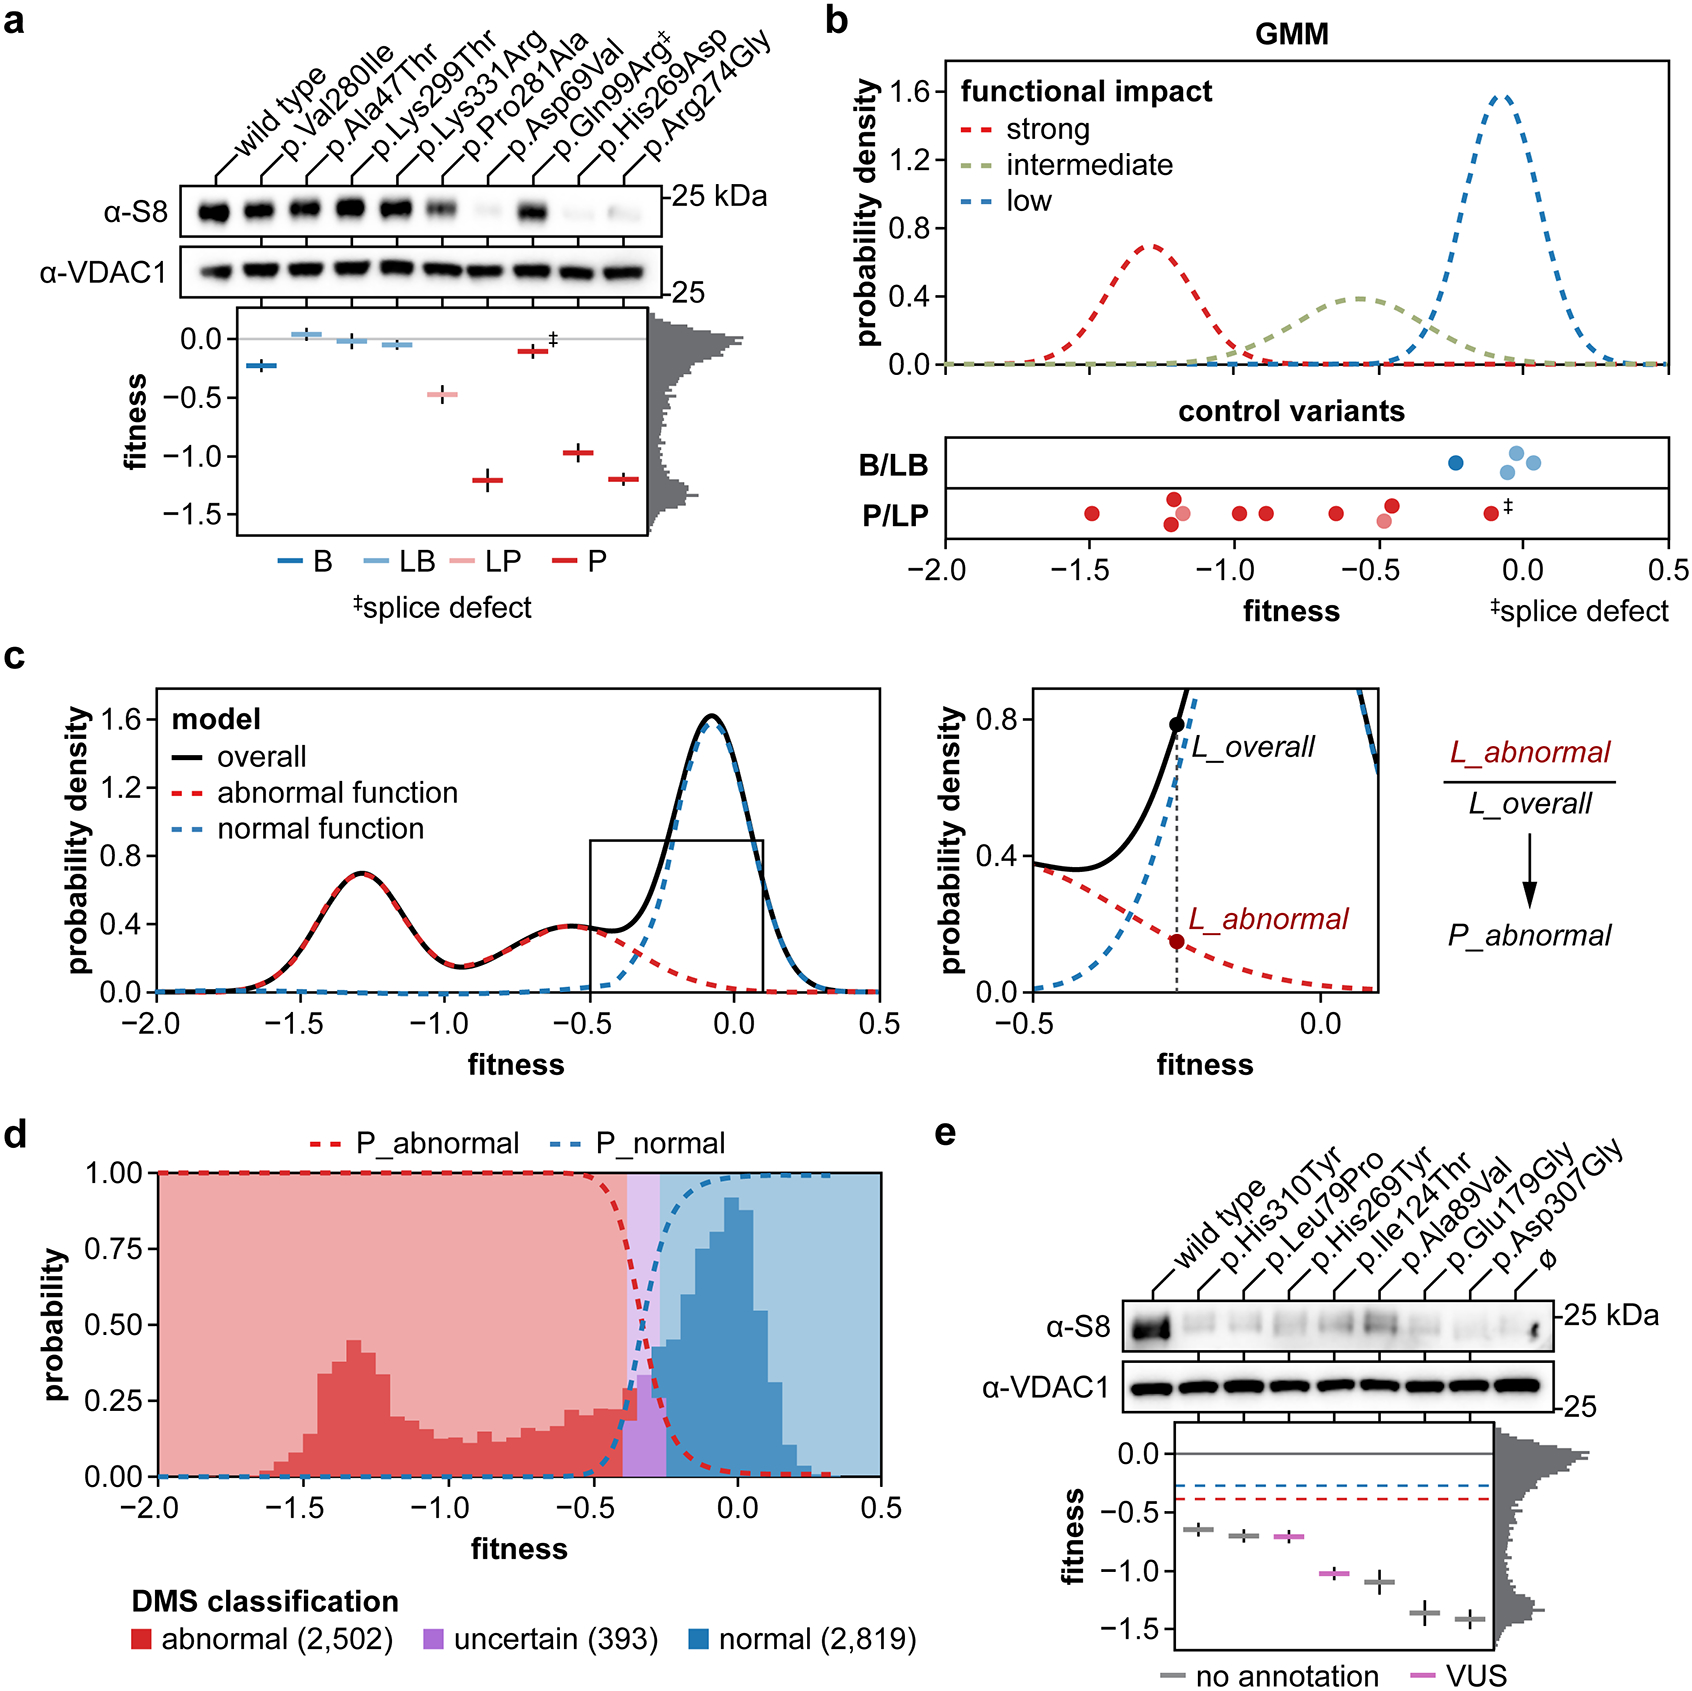
Isolated complex I (CI) deficiencies are a major cause of primary mitochondrial disease. A substantial proportion of CI deficiencies are believed to arise from defects in CI assembly factors (CIAFs) that are not part of the CI holoenzyme. The biochemistry of these CIAFs is poorly defined, making their role in CI assembly unclear, and confounding interpretation of potential disease-causing genetic variants. To address these challenges, we devised a deep mutational scanning approach to systematically assess the function of thousands of NDUFAF6 genetic variants. Guided by these data, biochemical analyses and cross-linking mass spectrometry, we discovered that the CIAF NDUFAF6 facilitates incorporation of NDUFS8 into CI and reveal that NDUFS8 overexpression rectifies NDUFAF6 deficiency. Our data further provide experimental support of pathogenicity for seven novel NDUFAF6 variants associated with human pathology and introduce functional evidence for over 5,000 additional variants. Overall, our work defines the molecular function of NDUFAF6 and provides a clinical resource for aiding diagnosis of NDUFAF6-related diseases.


Figures

Extended Data Fig. 1 ∣
Extended Data Fig. 1 ∣. Full DMS dataset.
Heatmap representation of the DMS data. The residue position is labeled along the horizontal axis (missing residues in the dataset denoted by a black triangle), the amino acid substitution is labeled on the vertical axis. The color of the rectangles represents the fitness score of the variant. Gray dots mark the wild-type amino acid at each position. Additional annotations to aid interpretation are shown above and below the fitness score heatmaps. Conservation at each position (calculated using ConSurf) is shown using the ConSurf color scale. Predicted alpha-helical secondary structure based on the AlphaFold AF6 model is shown as a thick, grey line. Percent solvent-accessible surface area (% SASA) at each residue position, calculated from the AlphaFold AF6 model is shown as a bar graph.
Extended Data Fig. 2 ∣
Extended Data Fig. 2 ∣. Experimental design and quality control.
a. Experimental design of DMS experiment. AF6 KO1 and AF6 KO2 cells are split into five replicates and separately transduced with the AF6 variant library. Input samples are collected 6–8 days after transduction (with 4-5 days of selection with puromycin). Cells are then cultured in galactose media to select for cells expressing functional variants of AF6. Output samples are collected afterthree and six passages in galactose media. b. Histogram of input read count distribution of the variants by replicate. The dashed line represents a read depth of 100x. c. Binned scatterplot of fitness scores from individual replicates. The dot size represents the number of variants in each fitness score bin. Pearson correlation coefficients (r) for each pairwise comparison is provided in the upper left corner of each plot. d. Bayesian information criterion (BIC) scores for Gaussian mixture models (GMM) with 1–6 components. A three-component model (shown in red) was chosen for this analysis. e. Histogram of DMS fitness scores overlaid with a three-component GMM. The three components are represented as colored dashed lines while the overall model is represented by a solid black line. The component weight, mean, and standard deviation are shown in the table below. f. Histogram of DMS fitness scores of nonsense variants overlaid with the three components from the GMM. The red component likely represents variants with a strong functional impact. The red shaded region represents three standard deviations from the mean of the red component, [−1.729, −0.842], and encompasses the fitness scores for 274 out of 286 nonsense variants.
Extended Data Fig. 3 ∣
Extended Data Fig. 3 ∣. Comparisons of DMS data to predicted NDUFAF6 structure.
a. Schematic for the calculation of mutational sensitivity. At each residue position, the number of missense substitutions with a fitness ≤ −0.842 (threshold for variants with strong functional impact, see Extended Data Fig. 2f) are counted and scaled linearly to a value between 0 and 9. b. Mutational sensitivity and percent solvent-accessible surface area (% SASA) of helix 11 (residues 253–275) are shown as bars. A cartoon representation of this alpha helix from the AF6 AlphaFold model is shown below and colored by mutational sensitivity. c. Density plot of DMS fitness scores for proline substitutions grouped by predicted secondary structure. d. Binned scatterplot showing the distribution of percent solvent accessible surface area and mutational sensitivity of residues in AF6. The dot size represents the number of residues in each bin. e. Cartoon representation of the AF6 AlphaFold model colored by mutational sensitivity (top) and % SASA (bottom). A front view and a back view are shown.
Extended Data Fig. 4 ∣
Extended Data Fig. 4 ∣. Biochemical principles recapitulated by DMS.
a-d. DMS fitness scores of substitutions in alanine residues (a), aromatic residues (b), hydrophobic residues (c), and charged residues (d). BLOSUM62 similarity scores for each substitution is shown along the right. Predicted secondary structure is shown below, conservation (calculated using ConSurf), and percent solvent accessible surface area (% SASA) are shown below. e. Surface representation of AF6 AlphaFold model colored by conservation, mutational sensitivity, and electrostatics. f. Binned scatterplot showing the distribution of conservation (calculated by ConSurf) and mutational sensitivity of residues in AF6. The dot size represents the number of residues in each bin.
Extended Data Fig. 5 ∣
Extended Data Fig. 5 ∣. Additional XL-MS hits.
Volcano plot showing the mean log2 fold-change and the −log10 of the two-tailed Student’s t-test p-value (no adjustment for multiple comparisons) of proteins in mitochondria overexpressing FLAG-tagged AF6 compared to wild-type mitochondria, n = 4 biologically independent samples per condition. CI subunits and assembly factors are marked as red dots and labeled. The most significant hits are labeled in the magnified portion of the volcano plot.
Figure 1:
Figure 1:. Deep mutational scanning of AF6
a. Schematic of DMS experiment. Cells expressing functional variants of AF6 were selected for by culturing in galactose media. Genomic DNA was extracted from samples collected before and after the selection and sequenced. Read counts from before and after selection were used to calculate fitness scores for each variant. b. AF6 KO cell genotypes as determined by Sanger sequencing around the target Cas9 cut site. CTRL cells were treated with a non-targeting guide RNA. c. Western blot of crude mitochondria isolated from CTRL, AF6 KO1 and AF6 KO2 cells, probing for AF6. VDAC1 is used as the loading control. The band at 30 kDa represents non-specific signal from the anti-AF6 antibody. This experiment was repeated three times with similar results. d. In-gel activity assay measuring CI activity in crude mitochondria lysate isolated from CTRL, AF6 KO1, and AF6 KO2 cells. Band corresponding to CI is marked on the left. This experiment was performed once. e. Seahorse oxygen consumption rate (OCR) measured before and after addition of 0.5 μM rotenone in CTRL, AF6 KO1, and AF6 KO2 cells. Results represent the mean of four replicates and error bars represent the standard error of the mean. f. Growth constants in galactose media of CTRL cells and AF6 KO cells with and without expression of wild-type AF6. Bars represent the mean ± SEM, n=3 biologically independent experiments (replicate values shown as dots).
Figure 2:
Figure 2:. DMS highlights functionally relevant protein regions
a. Binned scatterplot showing the distribution of percent solvent accessible surface area and mutational sensitivity of residues in AF6. The dot size represents the number of residues in each bin. Residues comprising the vestigial “active” site motifs are highlighted in blue. Residues lining the putative hydrophobic binding pocket are highlighted in orange. Residues with a higher mutational sensitivity than expected for the given percent solvent-accessible surface area (mutational sensitivity ≥ 2 and SASA > 20%) are highlighted in light blue. A cut-away view of the AF6 AlphaFold model, colored by mutational sensitivity, is shown for reference. Regions comprising the vestigial “active” site and putative hydrophobic pocket are marked. b. Sequence logos representing multiple sequence alignments for HH synthase active site compared to AF6 “active site”. Residue numbers for AF6 residues corresponding to the catalytic aspartates in HH synthases are indicated below the sequence logos. c. Cut-away view of the hydrophobic pocket in the E. hirae dehydrosqualene synthase structure (PDBID: 5IYS) compared to the AF6 AlphaFold model. Mg2+ ions depicted as green spheres, two farnesyl pyrophosphate substrates shown as black outlines. Surface is colored by electrostatics. d, e, f. The surface residues in (a) are highlighted as spheres on the structural model of AF6 and colored by mutational sensitivity. These residues map to two surface patches that may be important for protein-protein interaction (d). Head-on views showing the mutational sensitivity, conservation, and electrostatics of the two surface patches, respectively (e). Scatter plots showing correlation between mutational sensitivity and conservation for the two surface patches, with overlapping points marked by increased dot size. Pearson’s r is shown for each plot (f).
Figure 3:
Figure 3:. AF6 enables NDUFS8 incorporation into CI
a. Volcano plot showing the mean log2 fold-change and the −log10 of the two-tailed Student’s t-test p-value (no adjustment for multiple comparisons) of proteins in mitochondria overexpressing FLAG-tagged AF6 compared to wild-type mitochondria, n=4 biologically independent samples per condition. Dashed lines mark log2 foldchanges of −2 and 2. CI subunits and assembly factors are marked as red dots. All other proteins marked as grey dots. b. Yeast two-hybrid assay assessing the interaction between AF6, NDUFS8, and Q module subunits / assembly factors. Serial dilutions are marked along the top of the spot plate. The bait proteins are labeled above and the prey proteins are labeled on the side. Image is representative of three biological replicates. c. Yeast two-hybrid assay assessing the interaction of various double and triple alanine variants in the three patches highlighted in (d). Serial dilutions are marked along the top of the spot plate. The bait proteins are labeled above and the prey proteins are labeled on the side. Image is representative of three biological replicates. d. Residues in the surface patches identified by DMS targeted for mutagenesis are labeled and highlighted in blue and green for surface patches 1 and 2, respectively. Residues highlighted in grey represent a surface region that is not predicted to be important for interaction with NDUFS8 based on the DMS data. e. Q/Pp-a module assembly pathway with known assembly intermediates and assembly factors. The predicted molecular weight of each assembly intermediate is marked. The assembly steps mediated by NDUFAF5 and TIMMDC1 are labeled above the arrows. f. Blue native western blots of crude mitochondrial lysate from wild-type, NDUFAF5 KO, AF6 KO, and TIMMDC1 KO HAP1 cells, probing for NDUFS2, NDUFS3, NDUFS8, and NDUFAF3. Bands corresponding to Q/Pp-a module assembly intermediates and the CI holoenzyme are marked along the left of the blot. Molecular weights on the right indicate migration of the soluble protein ladder. Lanes were rearranged and grouped by cell line to facilitate interpretation. This experiment was repeated independently two times with similar results.
Figure 4:
Figure 4:. AF6 mediates assembly at the IMM
a. DMS fitness scores in the solvent-facing residues in the C-terminal helix (CTH). Conservation at each position is shown using the ConSurf color scale. b. Growth constants in galactose media of CTRL cells and AF6 KO cells expressing the negative CTH mutant [(−)] or positive CTH mutant [(+)] under either the native expression (NE) promoter or the overexpression (OE) promoter. Bars represent the mean ± SEM, n=3 biologically independent experiments (replicate values shown as dots). c. Western blots of membrane (m) and soluble (s) fractions of crude mitochondria isolated from AF6 KO cells overexpressing wild-type AF6, the negative CTH mutant, or the positive CTH mutant probing for AF6 and NDUFS8. VDAC1 is used as a membrane fraction marker and loading control. Citrate synthase (CS) is used as a soluble fraction marker. This experiment was repeated independently two times with similar results. d. Western blots of membrane (m) and soluble (s) fractions of crude mitochondria isolated from TIMMDC1 KO HAP1 cells, probing for NDUFS2, NDUFS3, NDUFS8, and NDUFAF3. VDAC1 is used as a membrane fraction marker and loading control. Citrate synthase (CS) is used as a soluble fraction marker. See Fig. 3f for native PAGE migration pattern of blot targets in TIMMDC1 KO HAP1 cells. This experiment was repeated independently three times with similar results. e. Growth constants in galactose media of AF6 KO cells and AF6 KO cells overexpressing either AF6 or NDUFS8. Bars represent the mean ± SEM, n=3 biologically independent experiments (replicate values shown as dots). f. Western blots of whole cell lysate from AF6 KO cells and AF6 KO cells overexpressing either AF6 or NDUFS8, probing for AF6 and NDUFS8. Citrate synthase (CS) is used as a loading control. This experiment was performed once. g. Model of AF6 role in CI assembly. AF6 binds to NDUFS8 and mediates its incorporation into the 125 kDa Q module intermediate at the inner mitochondrial membrane (IMM).
Figure 5:
Figure 5:. DMS provides a diagnostic resource for AF6-related diseases
a. Western blots of whole cell lysate from AF6 KO cells expressing control AF6 variants, probing for NDUFS8. VDAC1 is used as a loading control. DMS fitness scores for the variants are presented below the western blots as mean ± DiMSum error estimate, n=5 biologically independent samples. The color of the bar represents the current ClinVar annotations: benign (B), likely benign (LB), pathogenic (P), and likely pathogenic (LP). The histogram on the side represents the distribution of fitness scores in the full DMS dataset. b. The three components of the GMM corresponding to variants with strong, intermediate, and low functional impact, respectively. DMS fitness scores for benign/likely benign (B/LP) and pathogenic/likely pathogenic (P/LP) variants from ClinVar are shown below as individual points. c. Schematic for the calculation of probability of abnormal function (Pabnormal). The models derived from the GMM are shown on the left. The boxed region of the graph is magnified on the right, with an example calculation. For a given fitness score, the Pabnormal is calculated as the likelihood of observing that fitness score given the abnormal function model (Labnormal) divided by the likelihood of observing that fitness score given the overall model (Loverall). d. Histogram showing the distribution of DMS fitness scores overlaid with probabilities of abnormal or normal function (dashed lines). The blue, purple, and red shaded regions represent the variants classified as “normal,” “uncertain,” or “abnormal” function, respectively. The number of variants in each category is shown below. e. Western blots of whole cell lysate from AF6 KO cells expressing candidate pathogenic AF6 variants, probing for NDUFS8. VDAC1 is used as a loading control. DMS fitness scores for the variants are presented below the western blots as mean ± DiMSum error estimate, n=5 biologically independent samples. The color of the bar represents the current ClinVar annotations. The blue and red dashed lines represent the fitness score cutoffs for normal and abnormal function, respectively. The histogram on the side represents the distribution of fitness scores in the full DMS dataset.

References

    1. Sazanov LA A giant molecular proton pump: structure and mechanism of respiratory complex I. Nat Rev Mol Cell Bio 16, 375–388 (2015). - PubMed
    1. Kirby DM et al. Respiratory chain complex I deficiency: an underdiagnosed energy generation disorder. Neurology 52, 1255–64 (1999). - PubMed
    1. Schon KR et al. Use of whole genome sequencing to determine genetic basis of suspected mitochondrial disorders: cohort study. BMJ 375, e066288 (2021). - PMC - PubMed
    1. Nouws J, Nijtmans LGJ, Smeitink JA & Vogel RO Assembly factors as a new class of disease genes for mitochondrial complex I deficiency: cause, pathology and treatment options. Brain 135, 12–22 (2012). - PubMed
    1. Swalwell H. et al. Respiratory chain complex I deficiency caused by mitochondrial DNA mutations. Eur J Hum Genet 19, 769–775 (2011). - PMC - PubMed

MeSH terms

Substances