. 2024 May 8;24(1):380.
doi: 10.1186/s12870-024-05101-9.

Elucidating the role of exogenous melatonin in mitigating alkaline stress in soybeans across different growth stages: a transcriptomic and metabolomic approach

Affiliations

Elucidating the role of exogenous melatonin in mitigating alkaline stress in soybeans across different growth stages: a transcriptomic and metabolomic approach

Yajuan Duan et al. BMC Plant Biol. .

Abstract

Background: Soybean (Glycine max), a vital grain and oilseed crop, serves as a primary source of plant protein and oil. Soil salinization poses a significant threat to soybean planting, highlighting the urgency to improve soybean resilience and adaptability to saline stress. Melatonin, recently identified as a key plant growth regulator, plays crucial roles in plant growth, development, and responses to environmental stress. However, the potential of melatonin to mitigate alkali stress in soybeans and the underlying mechanisms remain unclear.

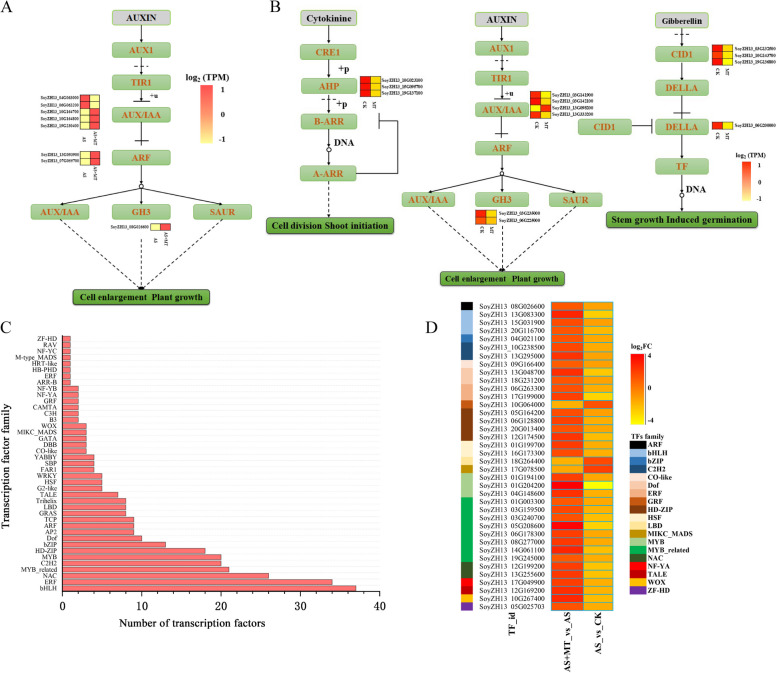
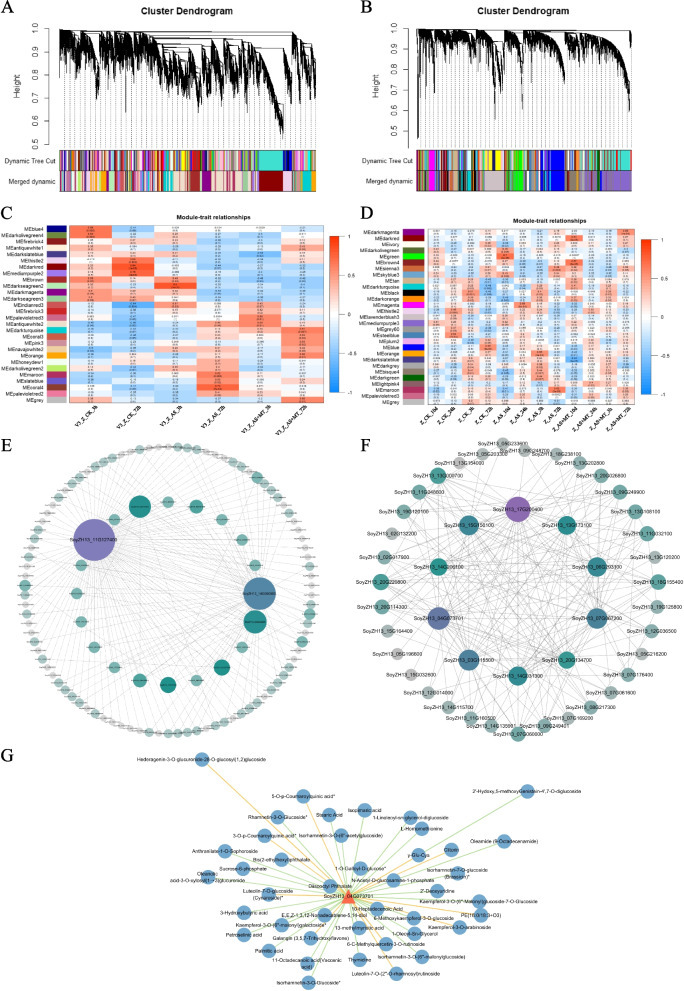
Results: This study investigated the effects of exogenous melatonin on the soybean cultivar Zhonghuang 13 under alkaline stress. We employed physiological, biochemical, transcriptomic, and metabolomic analyses throughout both vegetative and pod-filling growth stages. Our findings demonstrate that melatonin significantly counteracts the detrimental effects of alkaline stress on soybean plants, promoting plant growth, photosynthesis, and antioxidant capacity. Transcriptomic analysis during both growth stages under alkaline stress, with and without melatonin treatment, identified 2,834 and 549 differentially expressed genes, respectively. These genes may play a vital role in regulating plant adaptation to abiotic stress. Notably, analysis of phytohormone biosynthesis pathways revealed altered expression of key genes, particularly in the ARF (auxin response factor), AUX/IAA (auxin/indole-3-acetic acid), and GH3 (Gretchen Hagen 3) families, during the early stress response. Metabolomic analysis during the pod-filling stage identified highly expressed metabolites responding to melatonin application, such as uteolin-7-O-(2''-O-rhamnosyl)rutinoside and Hederagenin-3-O-glucuronide-28-O-glucosyl(1,2)glucoside, which helped alleviate the damage caused by alkali stress. Furthermore, we identified 183 differentially expressed transcription factors, potentially playing a critical role in regulating plant adaptation to abiotic stress. Among these, the gene SoyZH13_04G073701 is particularly noteworthy as it regulates the key differentially expressed metabolite, the terpene metabolite Hederagenin-3-O-glucuronide-28-O-glucosyl(1,2)glucoside. WGCNA analysis identified this gene (SoyZH13_04G073701) as a hub gene, positively regulating the crucial differentially expressed metabolite of terpenoids, Hederagenin-3-O-glucuronide-28-O-glucosyl(1,2)glucoside. Our findings provide novel insights into how exogenous melatonin alleviates alkali stress in soybeans at different reproductive stages.

Conclusions: Integrating transcriptomic and metabolomic approaches, our study elucidates the mechanisms by which exogenous melatonin ameliorates the inhibitory effects of alkaline stress on soybean growth and development. This occurs through modulation of biosynthesis pathways for key compounds, including terpenes, flavonoids, and phenolics. Our findings provide initial mechanistic insights into how melatonin mitigates alkaline stress in soybeans, offering a foundation for molecular breeding strategies to enhance salt-alkali tolerance in this crop.

Keywords: Alkaline stress; Gene regulation; Melatonin; Metabolomics; Soybean; Transcriptomics.


Conflict of interest statement

The authors declare no competing interests.

Figures

Fig. 1
Fig. 1
Assessment of physiological parameters and phenotypic morphology in soybean under varied treatments during the vegetative growth and pod-filling stages. A, H Net photosynthetic rate. B, I Intercellular CO2 concentration. C, J Stomatal conductance. D, K Transpiration rate. E, L Activity of superoxide dismutase (SOD). F, M Soluble sugar content. G, N Malondialdehyde (MDA) levels. O Phenotypic morphology of soybean plants at the pod-filling stage. Note: Illustrated with error bars representing standard deviation. The difference significance was examined using the Duncan’s test. Different letters denote statistically significant differences between treatments at the 0.05 level
Fig. 2
Fig. 2
Differential gene expression and pathway enrichment analysis in soybean under various treatment combinations during vegetative growth and pod-filling stages. A DEGs profile at the vegetative growth stage: This panel illustrates DEGs identified in all comparative analyses at the vegetative growth stage of soybean. B DEGs profile at the pod-filling stage: depicting DEGs from all comparison combinations during the soybean’s pod-filling stage. C UpSet plot of temporal DEGs: displaying the intersection of DEGs at different time points between the AS + MT vs AS groups. D GO enrichment analysis: panel (a) presents GO terms enriched in the AS + MT_3h vs AS_3h comparison, while panel (b) illustrates enriched GO terms in the AS + MT_72h vs AS_72h comparison. E KEGG pathway enrichment during vegetative growth: showcasing significantly enriched KEGG signaling pathways in each comparison combination. The horizontal axis represents different comparison groups, and the vertical axis indicates the enriched KEGG pathways. Circle size correlates with the number of genes enriched in each pathway, while color denotes the significance level of enrichment, with blue indicating lower and red indicating higher significance. F KEGG pathway enrichment during pod-filling stage: highlighting significantly enriched KEGG signaling pathways in the comparison combinations at this stage. G Trend analysis during pod-filling stage: detailing the expression trend analysis of soybeans based on the short time-series expression miner (STEM) method
Fig. 3
Fig. 3
DEGs in soybean’s growth hormone signaling pathways modulated by melatonin. A Melatonin-induced DEGs in growth hormone signaling during vegetative growth stage: this panel illustrates the differential gene expression induced by melatonin in the soybean vegetative growth stage’s growth hormone signaling pathway. B Melatonin-induced DEGs in growth hormone signaling during pod-filling stage: showcasing the DEGs influenced by melatonin in the growth hormone signaling pathway of soybean during the pod-filling stage. C TFs encoded by DEGs: depicting 319 differentially expressed genes that encode TFs. D TF expression modulation by melatonin: presenting the expression levels of 38 TFs that are up- or down-regulated under alkaline stress conditions in response to melatonin treatment
Fig. 4
Fig. 4
Comprehensive analysis of metabolomic alterations in soybean under alkali stress and melatonin treatment. A Sample correlation analysis: illustrating the correlation between replicates across different treatments, affirming the consistency and repeatability of the metabolomic data. B Principal component analysis (PCA): this plot delineates the distinct clustering of samples based on treatment groups, highlighting the metabolic diversity induced by different treatments. If the significance value P ≤ 0.05, the correlation coefficient matrix is considered not to be a unitary matrix and can be subjected to principal component analysis. C differentially expressed metabolite volcano plots: displaying the distribution and significance of DAMs between the AS and AS + MT groups. D Chord diagram of differentially accumulated metabolites: visualizing the relationships and abundance of all DAMs identified in AS and AS + MT treatments. E KEGG pathway classification: mapping the DAMs to specific KEGG pathways, elucidating the metabolic pathways influenced by AS and AS + MT treatments
Fig. 5
Fig. 5
WGCNA highlighting the impact of melatonin on soybean’s response to alkali stress. A Hierarchical clustering tree and expression modules at the vegetative growth stage: this panel depicts the clustering of gene expression modules identified during the vegetative growth stage. B Hierarchical clustering tree and expression modules at the pod-filling stage: illustrating the clustering of gene expression modules observed during the pod-filling stage. C Gene co-expression network in the vegetative growth stage: showcasing the correlation between different treatments and the identified modules at this stage. D Gene co-expression network in the pod-filling stage: demonstrating the correlation between various treatments and the identified modules during the pod-filling stage. E Hub gene networks in the darkturquoise module: depicting the gene network and connectivity of key hub genes within the darkturquoise module identified at the vegetative growth stage. F Hub gene networks in the brown4 module: illustrating the gene network and connectivity of central hub genes within the brown4 module observed at the pod-filling stage. Note: The size of each node in the network represents the gene connectivity, while different colors indicate the weight value of each connection. G Gene-metabolite correlation network: depicting the network of interactions between the hub gene SoyZH13_04G073701 and various metabolites. Orange triangles represent the gene, blue circles denote metabolites, with orange lines indicating positive correlations and green lines signifying negative correlations

Similar articles

Cited by

References

    1. Cai XX, Jia BW, Sun MZ, Sun XL. Insights into the regulation of wild soybean tolerance to salt-alkaline stress. Front Plant Sci. 2022;13:19. doi: 10.3389/fpls.2022.1002302. - DOI - PMC - PubMed
    1. Guo KW, Xu ZS, Huo YZ, Sun Q, Wang Y, Che YH, Wang JC, Li W, Zhang HH. Effects of salt concentration, pH, and their interaction on plant growth, nutrient uptake, and photochemistry of alfalfa (Medicago sativa) leaves. Plant Signal Behav. 2020;15(12):9. - PMC - PubMed
    1. An Y, Gao Y, Tong SZ, Liu B. Morphological and physiological traits related to the response and adaption of Bolboschoenus planiculmis seedlings grown under salt-alkaline stress conditions. Front Plant Sci. 2021;12:13. doi: 10.3389/fpls.2021.567782. - DOI - PMC - PubMed
    1. Sun JK, He L, Li T. Response of seedling growth and physiology of Sorghum bicolor (L.) Moench to saline-alkali stress. PLoS One. 2019;14(7):10. doi: 10.1371/journal.pone.0220340. - DOI - PMC - PubMed
    1. Kumar M, Kesawat MS, Ali A, Lee SC, Gill SS, Kim HU. Integration of abscisic acid signaling with other signaling pathways in plant stress responses and development. Plants Basel. 2019;8(12):20. - PMC - PubMed

MeSH terms

LinkOut - more resources