

Uncovering physical activity trade-offs in transportation policy: A spatial agent-based model of Bogotá, Colombia
- PMID: 38720323
- PMCID: PMC11077730
- DOI: 10.1186/s12966-024-01570-1
Uncovering physical activity trade-offs in transportation policy: A spatial agent-based model of Bogotá, Colombia
Abstract
Background: Transportation policies can impact health outcomes while simultaneously promoting social equity and environmental sustainability. We developed an agent-based model (ABM) to simulate the impacts of fare subsidies and congestion taxes on commuter decision-making and travel patterns. We report effects on mode share, travel time and transport-related physical activity (PA), including the variability of effects by socioeconomic strata (SES), and the trade-offs that may need to be considered in the implementation of these policies in a context with high levels of necessity-based physical activity.
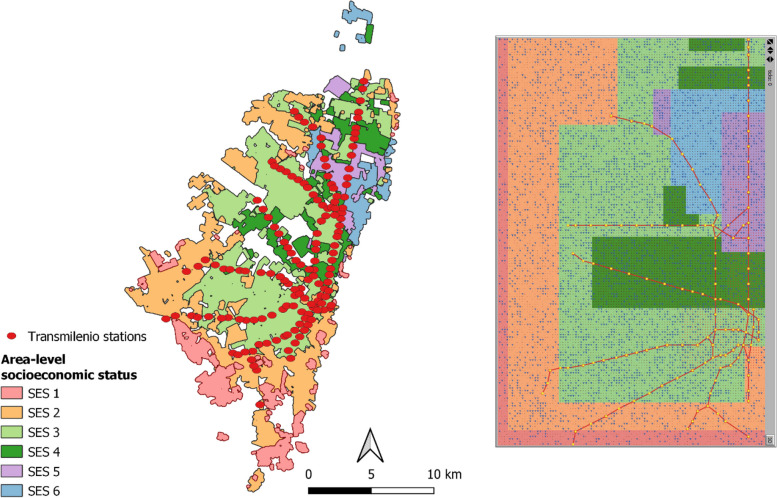
Methods: The ABM design was informed by local stakeholder engagement. The demographic and spatial characteristics of the in-silico city, and its residents, were informed by local surveys and empirical studies. We used ridership and travel time data from the 2019 Bogotá Household Travel Survey to calibrate and validate the model by SES. We then explored the impacts of fare subsidy and congestion tax policy scenarios.
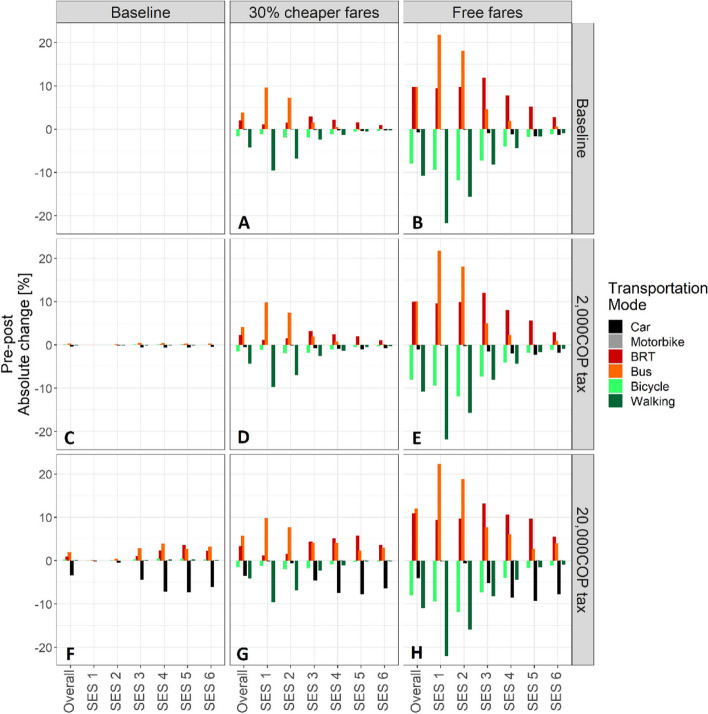
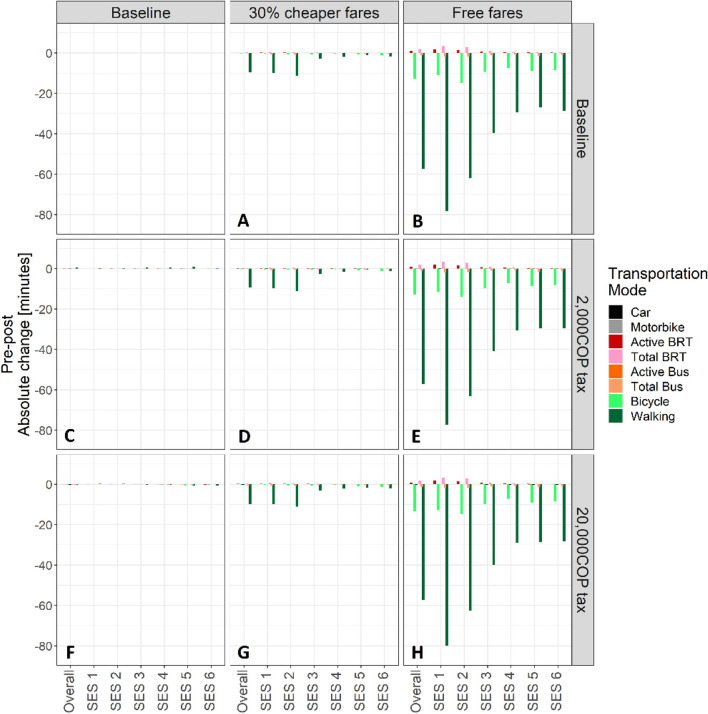
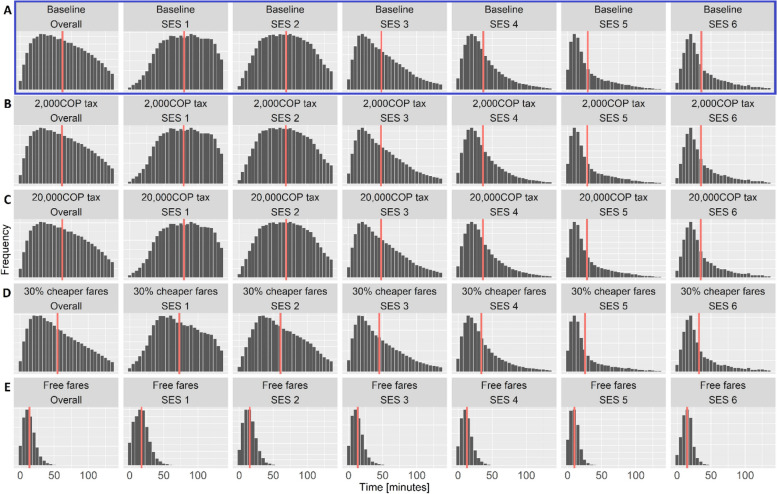
Results: Our model reproduced commuting patterns observed in Bogotá, including substantial necessity-based walking for transportation. At the city-level, congestion taxes fractionally reduced car use, including among mid-to-high SES groups but not among low SES commuters. Neither travel times nor physical activity levels were impacted at the city level or by SES. Comparatively, fare subsidies promoted city-level public transportation (PT) ridership, particularly under a 'free-fare' scenario, largely through reductions in walking trips. 'Free fare' policies also led to a large reduction in very long walking times and an overall reduction in the commuting-based attainment of physical activity guidelines. Differential effects were observed by SES, with free fares promoting PT ridership primarily among low-and-middle SES groups. These shifts to PT reduced median walking times among all SES groups, particularly low-SES groups. Moreover, the proportion of low-to-mid SES commuters meeting weekly physical activity recommendations decreased under the 'freefare' policy, with no change observed among high-SES groups.
Conclusions: Transport policies can differentially impact SES-level disparities in necessity-based walking and travel times. Understanding these impacts is critical in shaping transportation policies that balance the dual aims of reducing SES-level disparities in travel time (and time poverty) and the promotion of choice-based physical activity.
Keywords: Agent-based model; Complex systems; Health inequities; Physical activity; Time scarcity; Transportation policy.
© 2024. The Author(s).
Conflict of interest statement
The authors declare that they have no competing interests.
Figures


References
-
- Anenberg SC, et al. The global burden of transportation tailpipe emissions on air pollution-related mortality in 2010 and 2015. Environ Res Lett. 2019;14(9):094012. doi: 10.1088/1748-9326/ab35fc. - DOI
-
- World Health Organisation . WHO guidelines on physical activity and sedentary behaviour. Geneva: World Health Organisation; 2020. - PubMed
-
- Heaps, W., E. Abramsohn, and E. Skillen, Public Transportation In The US: A Driver Of Health And Equity. Health Affairs Health Policy Brief, 2021.
-
- Montoya-Robledo V, et al. Gender stereotypes affecting active mobility of care in Bogotá. Transp Res Part D: Transp Environ. 2020;86:102470. doi: 10.1016/j.trd.2020.102470. - DOI
Publication types
MeSH terms
Grants and funding
LinkOut - more resources
Full Text Sources
Medical
