. 2024 May 8;57(1):25.
doi: 10.1186/s40659-024-00499-w.

Novel role of LLGL2 silencing in autophagy: reversing epithelial-mesenchymal transition in prostate cancer

Affiliations

Novel role of LLGL2 silencing in autophagy: reversing epithelial-mesenchymal transition in prostate cancer

Geum-Lan Hong et al. Biol Res. .

Abstract

Purpose: Prostate cancer (PCa) is a major urological disease that is associated with significant morbidity and mortality in men. LLGL2 is the mammalian homolog of Lgl. It acts as a tumor suppressor in breast and hepatic cancer. However, the role of LLGL2 and the underlying mechanisms in PCa have not yet been elucidated. Here, we investigate the role of LLGL2 in the regulation of epithelial-mesenchymal transition (EMT) in PCa through autophagy in vitro and in vivo.

Methods: PC3 cells were transfected with siLLGL2 or plasmid LLGL2 and autophagy was examined. Invasion, migration, and wound healing were assessed in PC3 cells under autophagy regulation. Tumor growth was evaluated using a shLLGL2 xenograft mouse model.

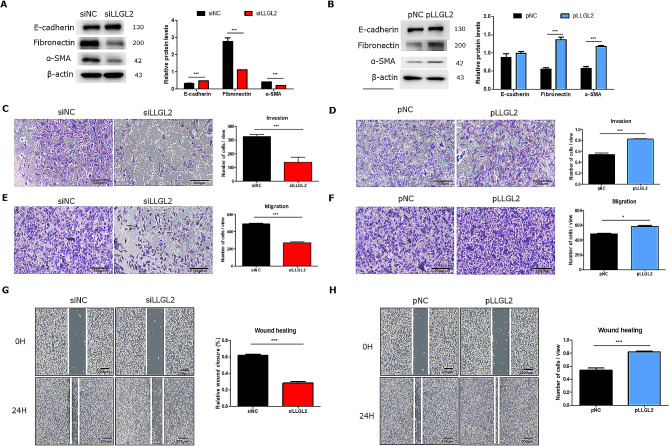
Results: In patients with PCa, LLGL2 levels were higher with defective autophagy and increased EMT. Our results showed that the knockdown of LLGL2 induced autophagy flux by upregulating Vps34 and ATG14L. LLGL2 knockdown inhibits EMT by upregulating E-cadherin and downregulating fibronectin and α-SMA. The pharmacological activation of autophagy by rapamycin suppressed EMT, and these effects were reversed by 3-methyladenine treatment. Interestingly, in a shLLGL2 xenograft mouse model, tumor size and EMT were decreased, which were improved by autophagy induction and worsened by autophagy inhibition.

Conclusion: Defective expression of LLGL2 leads to attenuation of EMT due to the upregulation of autophagy flux in PCa. Our results suggest that LLGL2 is a novel target for alleviating PCa via the regulation of autophagy.

Keywords: Autophagy; EMT; LLGL2; Proliferation; Prostate cancer.


Conflict of interest statement

The authors declare that they have no competing interests.

Figures

Fig. 1
Fig. 1
Expression of LLGL2 was higher in PCa tissues with downregulated autophagy and upregulated EMT (n = 5/ group). (A) Immunohistochemical staining of LLGL2 in the prostates of patients with non-cancer (BPH) and PCa patients. (B) Quantitative analysis of the positive areas in BPH and PCa tissues. (C) Immunohistochemical staining of LC3 and p62 in patients with BPH and PCa and quantitative analysis of the positive area (D). (E) Immunohistochemical staining of E-cadherin and α-SMA in patients with BPH and PCa and quantitative analysis of the positive area. The relative % area of positive densities was analyzed using Image J software. E) Immunostaining of E-cadherin and α-SMA in patients with BPH and PCa and quantitative analysis of positive area (F). Scale bar = 25 μm. mean ± SD. ***p < 0.001
Fig. 2
Fig. 2
Silencing LLGL2 induced autophagy flux in PC3 cells. (A) Protein level of LLGL2 in PC3 cells transfected with siRNA sequences of LLGL2 (siLLGL2) or negative control (siNC) for 48 h as determined by western blotting and relative band intensities (right). (B) The protein level of LLGL2 in PC3 cells transfected with LLGL2 plasmid (pLLGL2) or control plasmid (pNC) for 48 h as determined by western blotting and relative band intensities (right, n = 3). (C) Protein levels of Vps34, ATG14L, LC3B and p62 were examined by western blotting in PC3 cells after transfection with siLLGL2 or siNC (left). Relative band intensities were analyzed using CS Analyzer 4 (n = 3, right). (D) The protein levels of Vps34, ATG14L, LC3B and p62 were examined using western blotting in PC3 cells after transfection with pLLGL2 or pNC (Left). Relative band intensities analyzed by CSAnalyzer 4 (n = 3, Right). (E) Representative immunofluorescence images of Vps34 or ATG14L in PC3 cells after transfection with siLLGL2 or siNC. (F) Representative immunofluorescence images of Vps34 or ATG14L in PC3 cells after transfection with pLLGL2 or pNC. (G) Analysis of GFP-RFP-LC3 fluorescent signals in PC3 cells after transfection with siLLGL2 or siNC and transient transfection with GFP-RFP-LC3 plasmid. (H) Analysis of GFP-RFP-LC3 fluorescent signals in PC3 cells after transfected with pLLGL2 or pNC and transiently transfected with GFP-RFP-LC3 plasmid. Scale Bar = 10 μm. Error bars, mean ± SD. *p < 0.05 and ***p < 0.001, vs. control
Fig. 3
Fig. 3
Silencing LLGL2 prevents EMT and overexpression of LLGL2 promotes EMT in PC3 cells. (A) Protein levels of E-cadherin, fibronectin, and α-SMA were examined by western blotting in PC3 cells after transfection with siLLGL2 or siNC (left). Relative band intensities were analyzed using CS Analyzer 4 (n = 3, right). (B) Protein levels of E-cadherin, fibronectin, and α-SMA were examined using western blotting in PC3 cells after transfection with pLLGL2 or pNC (left). Relative band intensities were analyzed using CS Analyzer 4 (n = 3, right). The invasion (n = 3, C and D) and migration (n = 3, E and F) assays were performed in PC3 cells after transfection with siLLGL2 or pLLGL2 (left). The number of cells in view was calculated using Image J (right). The wound healing assay (n = 3, G and H) was performed on PC3 cells after transfection with siLLGL2 or pLLGL2 (left). The relative % of wound closure was calculated using Image J (right). Scale Bar = 200 μm. Error bars, mean ± SD. *p < 0.05 and ***p < 0.001, vs. control
Fig. 4
Fig. 4
Silencing LLGL2 prevents EMT through autophagy. (A) Protein levels of E-cadherin, fibronectin, and α-SMA were examined using western blotting in PC3 cells after transfection with siLLGL2 or siNC for 48 h with rapamycin (Rapa, 100 nM) or 3-methyladenine (3MA, 5 mM, Top). Relative band intensities were analyzed using CS Analyzer 4 (n = 3, bottom). (B) The protein levels of E-cadherin, fibronectin, and α-SMA were examined using western blotting in PC3 cells after transfection with pLLGL2 or pNC for 48 h with rapamycin (Rapa, 100 nM) or 3-methyladenine (3MA, 5 mM), (Top). Relative band intensities were analyzed using CS Analyzer 4 (n = 3, Bottom). (C) Immunofluorescence staining of E-cadherin (red) and fibronectin (green) in PC3 cells transfected with siLLGL2 or siNC for 48 h with rapamycin (Rapa, 100 nM) or 3-methyladenine (3MA, 5 mM). (D) Immunofluorescence staining of E-cadherin (red) and fibronectin (green) in PC3 cells transfected with pLLGL2 or pNC for 48 h with rapamycin (Rapa, 100 nM) or 3-methyladenine (3MA, 5 mM). Scale Bar = 20 μm. Error bars, mean ± SD. *p < 0.05, **p < 0.01, ***p < 0.001, vs. siNC control, #p < 0.05, ##p < 0.01, ###p < 0.001 vs. siLLGL2 control, and δp < 0.05, δδp < 0.01, and δδδp < 0.001 vs. respective control
Fig. 5
Fig. 5
LLGL2 knockdown inhibits xenograft tumorS through autophagy in nude mice (n = 5/ group). Mice were inoculated subcutaneously into the right (shLLGL2) or left (shNC) flanks. For pharmacological changes in autophagy, mice were intraperitoneally treated with rapamycin (Rapa, 2.5 mg/kg/d) or 3-methyladenine (3MA, 30 mg/kg/d) when tumor size reached 100 mm3. (A) Representative images of the tumor obtained from each group. (B) Tumor size in each group was assessed by calipers and calculated as the length × width × width × 0.5. (C) Protein levels of LLGL2, LC3, and p62 were examined using western blotting in shNC or shLLGL2 tumor treated with or without Rapa or 3MA (left). Relative band intensities were analyzed using CS Analyzer (right). (D) The protein levels of E-cadherin, fibronectin, and α-SMA were examined using western blotting in shNC or shLLGL2 tumor treated with or without Rapa or 3MA (left). Relative band intensities were analyzed using CS Analyzer (Right). (E) Immunohistochemical staining of E-cadherin and α-SMA in tumor tissues from the mice. Scale bar = 25 μm. Error bar, mean ± SD. *p < 0.05, **p < 0.01, ***p < 0.001, vs. shNC-control, #p < 0.05, ##p < 0.01, ###p < 0.001 vs. shLLGL2-control, and δp < 0.05, δδp < 0.01, and δδδp < 0.001 vs. respective control

References

    1. Mechler BM, McGinnis W, Gehring WJ. Molecular cloning of lethal(2)giant larvae, a recessive oncogene of Drosophila melanogaster. EMBO J. 1985;4(6):1551–7. doi: 10.1002/j.1460-2075.1985.tb03816.x. - DOI - PMC - PubMed
    1. Albertson R, Doe CQ, Dlg Scrib and Lgl regulate neuroblast cell size and mitotic spindle asymmetry. Nat Cell Biol. 2003;5(2):166–70. doi: 10.1038/ncb922. - DOI - PubMed
    1. Betschinger J, Mechtler K, Knoblich JA. The Par complex directs asymmetric cell division by phosphorylating the cytoskeletal protein Lgl. Nature. 2003;422(6929):326–30. doi: 10.1038/nature01486. - DOI - PubMed
    1. Saito Y, Li L, Coyaud E, Luna A, Sander C, Raught B, et al. LLGL2 rescues nutrient stress by promoting leucine uptake in ER(+) breast cancer. Nature. 2019;569(7755):275–9. doi: 10.1038/s41586-019-1126-2. - DOI - PubMed
    1. Leng S, Xie F, Liu J, Shen J, Quan G, Wen T. LLGL2 increases ca(2+) influx and exerts oncogenic activities via PI3K/AKT signaling pathway in Hepatocellular Carcinoma. Front Oncol. 2021;11:683629. doi: 10.3389/fonc.2021.683629. - DOI - PMC - PubMed

Substances