Diaphragm ultrasound in patients with prolonged weaning from mechanical ventilation
- PMID: 38720844
- PMCID: PMC11074767
- DOI: 10.21037/qims-23-1712
Diaphragm ultrasound in patients with prolonged weaning from mechanical ventilation
Abstract
Background: Several publications have examined diaphragmatic ultrasound using two-dimensional (2D) parameters in the context of weaning from mechanical ventilation (MV) and extubation. However, the studied cohorts had rather short duration of ventilation. Examinations on patients with prolonged weaning after long-term ventilation were missing. It was the aim of this study to assess of the diaphragm and peripheral musculature of patients undergoing prolonged weaning creating a chronological sequence of ultrasonic parameters during the course of weaning.
Methods: This study was carried out as a monocentric, prospective observational cross-sectional study. Patients in prolonged weaning who were transferred to a specialized weaning unit were eligible for inclusion if they were ventilated invasively by means of an endotracheal tube or tracheal cannula and if their expected treatment period was at least 5 days. Diaphragmatic function and one representative peripheral muscle were examined in 50 patients between March 2020 and April 2021. The 2D sonographic parameters of diaphragm and diaphragmatic function consisted of diaphragmatic thickness (Tdi) at the end of inspiration and expiration, the fractional thickening (FT) and the diaphragmatic excursion. Additionally, the M. quadriceps femoris was sonographically assessed at two locations. The difference of measurements between the first and the last measuring timepoint were examined using the Wilcoxon signed-rank test. For a longer chronological sequence, the Friedman's rank sum test with subsequent Wilcoxon-Nemenyi-McDonald-Thompson test for multiple comparisons was carried out.
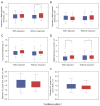
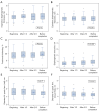
Results: Fifty patients with prolonged weaning were included. The median duration of MV before transfer to the weaning unit was 11.5 [interquartile range (IQR) 10] days. Forty-one patients could be assessed over the full course of weaning, with 38 successfully weaned. Within these 41 patients, the sonographic parameters of the diaphragm slightly increased over the course of weaning indicating an increase in thickness and mobility. Especially parameters which represented an active movement reached statistical significance, i.e., inspiratory Tdi when assessed under spontaneous breathing [begin 3.41 (0.99) vs. end 3.43 (1.31) mm; P=0.01] and diaphragmatic excursion [begin 0.7 (0.8) vs. end 0.9 (0.6) cm; P=0.01]. The presence of positive end-expiratory pressure (PEEP) and pressure support did not influence the sonographic parameters significantly. The M. quadriceps femoris, in contrast, decreased slightly but constantly over the time [lower third: begin 1.36 (0.48) vs. end 1.28 (0.36) cm; P=0.054].
Conclusions: The present study is the first one to longitudinally analyse diaphragmatic ultrasound in patients with prolonged weaning. Sonographic assessment showed that Tdi and excursion increased over the course of prolonged weaning, while the diameter of a representative peripheral muscle decreased. However, the changes are rather small, and data show a wide dispersion. To allow a potential, standardized use of diaphragm ultrasound for diagnostic decision support in prolonged weaning, further studies in this specific patient group are required.
Keywords: Diaphragm; prolonged weaning; ultrasonography; ultrasound; ventilator weaning.
2024 Quantitative Imaging in Medicine and Surgery. All rights reserved.
Conflict of interest statement
Conflicts of Interest: All authors have completed the ICMJE uniform disclosure form (available at https://qims.amegroups.com/article/view/10.21037/qims-23-1712/coif). T.P.S. reports consulting fees and travel support from B. Braun AG Melsungen, Germany and Sphingotec GmbH, Hennigsdorf, Germany. The other authors have no conflicts of interest to declare.
Figures


References
LinkOut - more resources
Full Text Sources
Miscellaneous
