. 2024 Apr 24:15:1355405.
doi: 10.3389/fimmu.2024.1355405. eCollection 2024.

The post-septic peripheral myeloid compartment reveals unexpected diversity in myeloid-derived suppressor cells

Affiliations

The post-septic peripheral myeloid compartment reveals unexpected diversity in myeloid-derived suppressor cells

Evan L Barrios et al. Front Immunol. .

Abstract

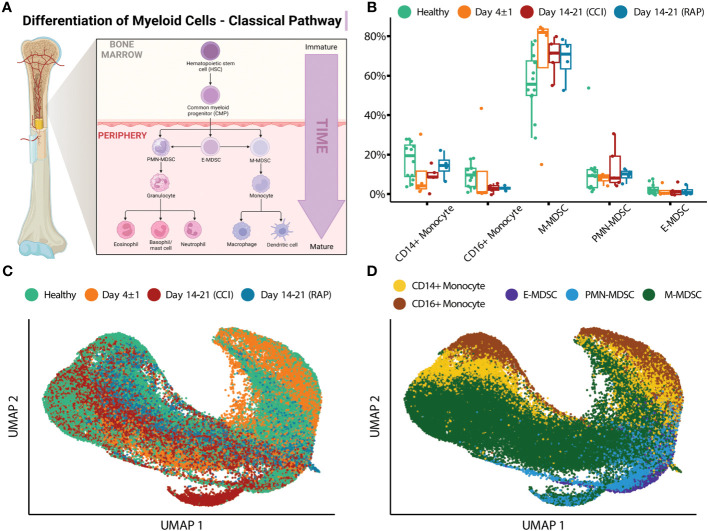
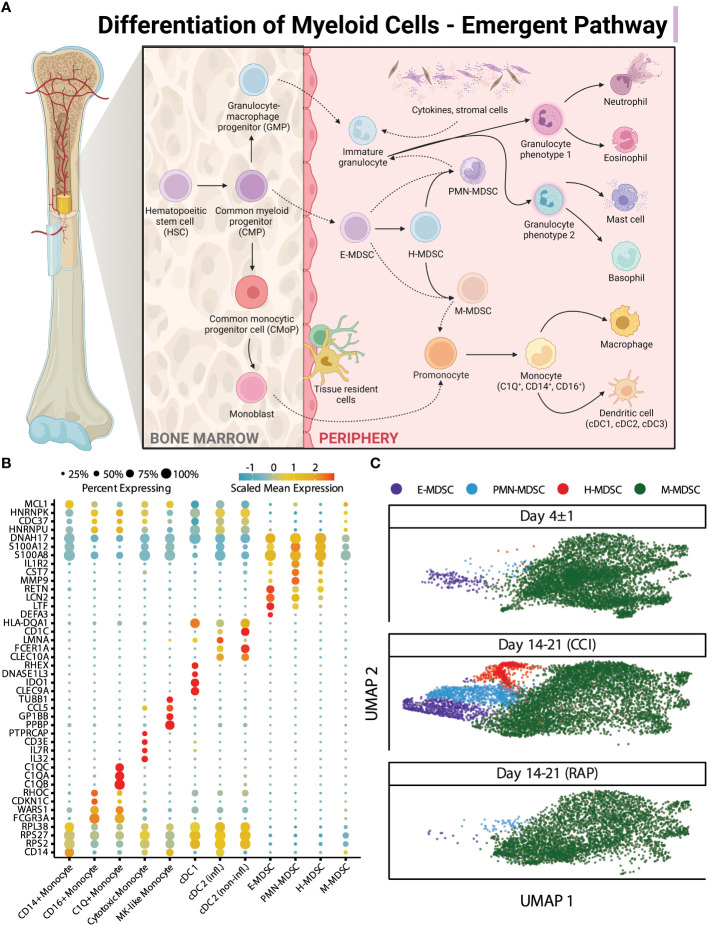
Introduction: Sepsis engenders distinct host immunologic changes that include the expansion of myeloid-derived suppressor cells (MDSCs). These cells play a physiologic role in tempering acute inflammatory responses but can persist in patients who develop chronic critical illness.

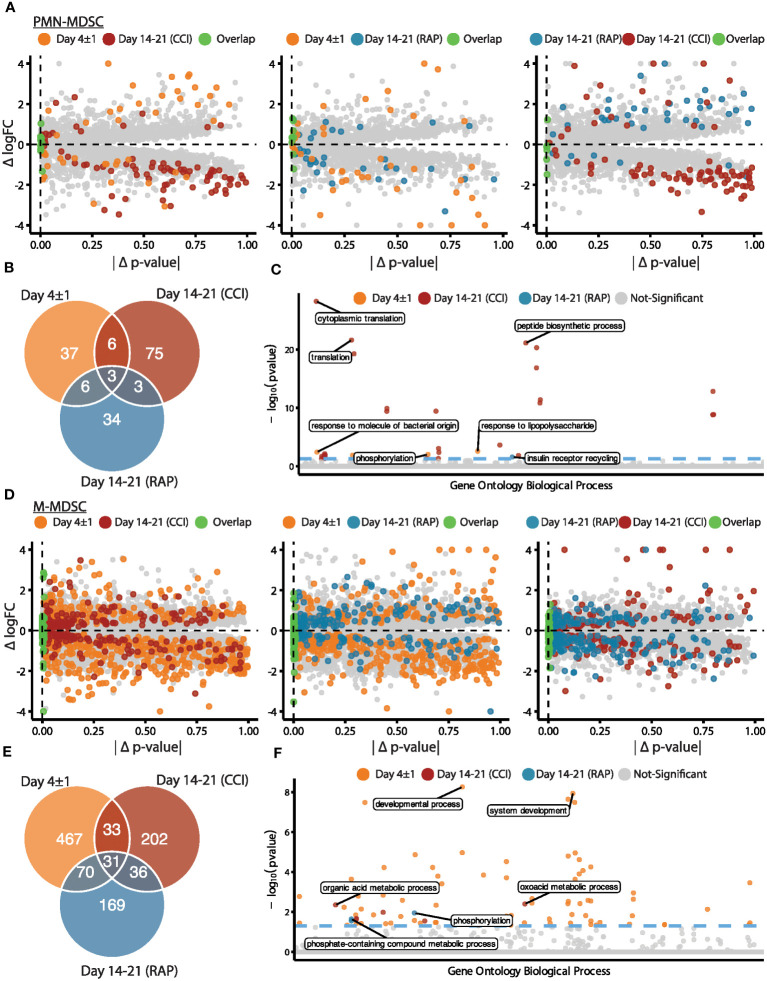
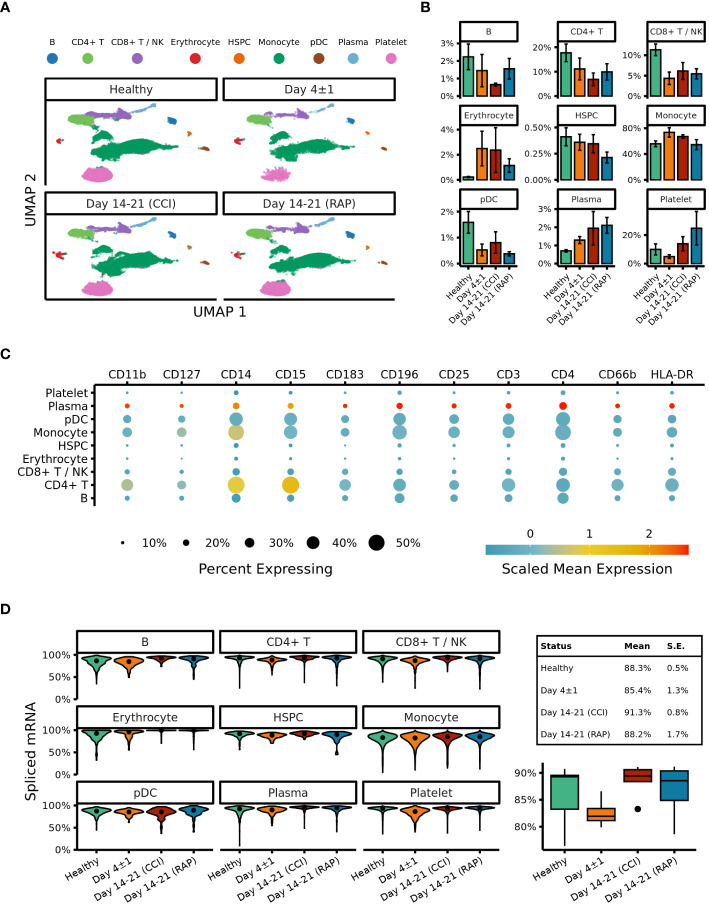
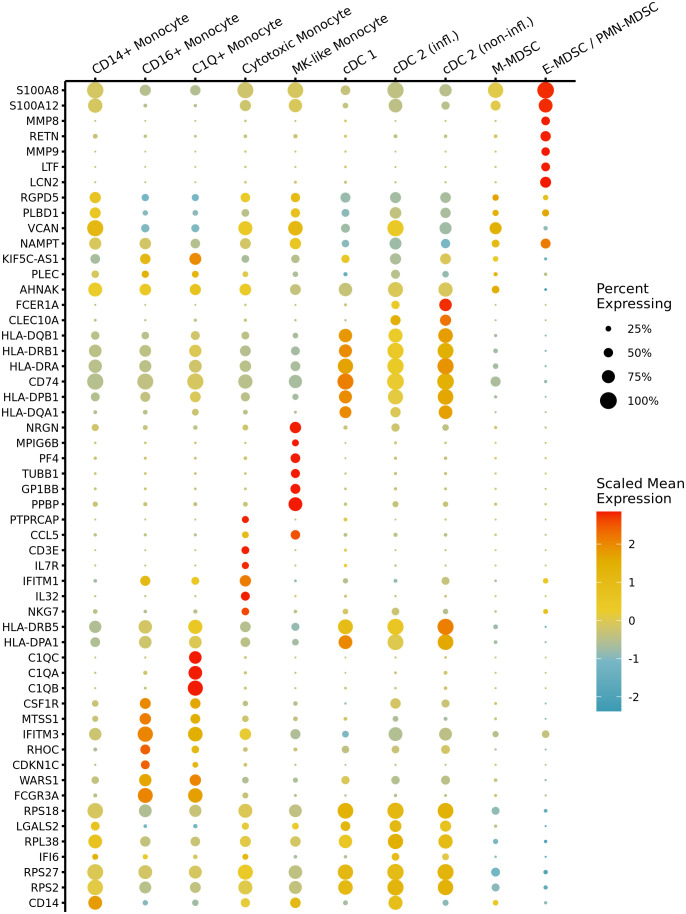
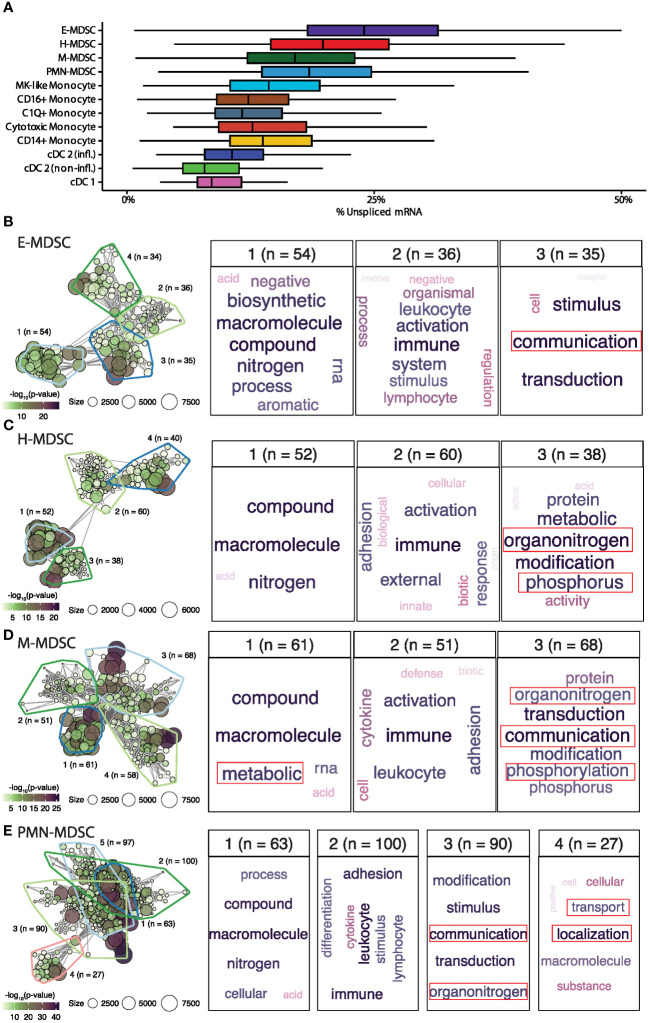
Methods: Cellular Indexing of Transcriptomes and Epitopes by Sequencing and transcriptomic analysis are used to describe MDSC subpopulations based on differential gene expression, RNA velocities, and biologic process clustering.

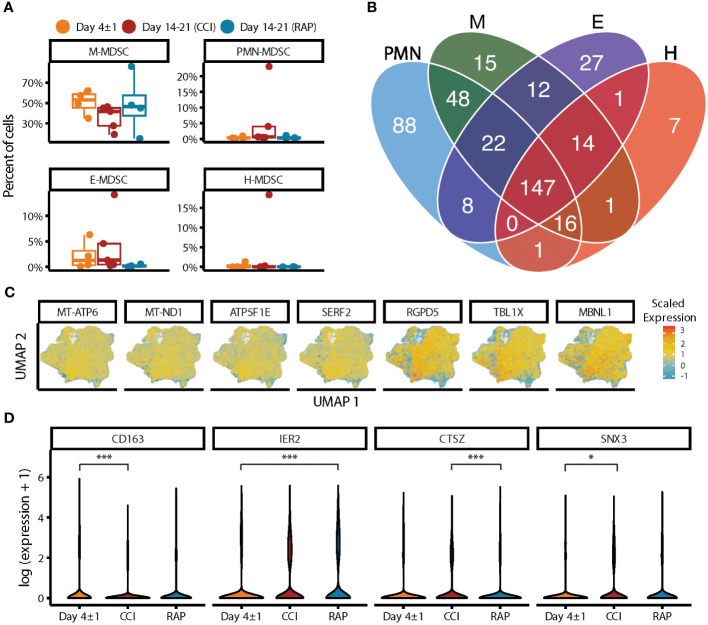
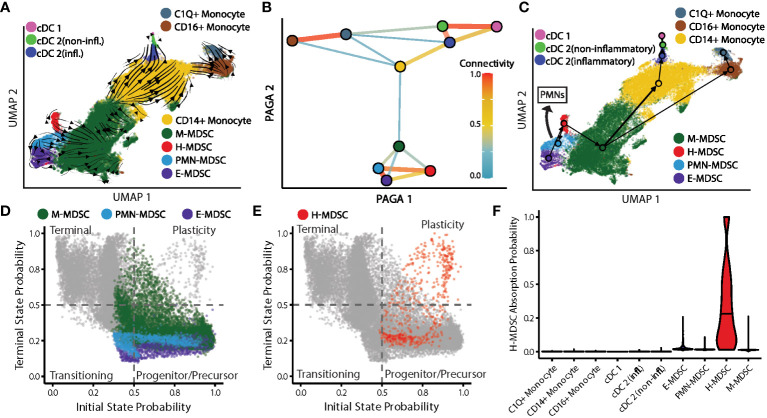
Results: We identify a unique lineage and differentiation pathway for MDSCs after sepsis and describe a novel MDSC subpopulation. Additionally, we report that the heterogeneous response of the myeloid compartment of blood to sepsis is dependent on clinical outcome.

Discussion: The origins and lineage of these MDSC subpopulations were previously assumed to be discrete and unidirectional; however, these cells exhibit a dynamic phenotype with considerable plasticity.

Keywords: chronic critical illness; myeloid-derived suppressor cells; sepsis; single-cell RNA sequencing; transcriptomics.


Conflict of interest statement

The authors declare that the research was conducted in the absence of any commercial or financial relationships that could be construed as a potential conflict of interest. The author(s) declared that they were an editorial board member of Frontiers, at the time of submission. This had no impact on the peer review process and the final decision.

Figures

Figure 1
Figure 1
Single-cell analysis of myeloid cells using surface protein makers. (A) Illustration representing the historical/classic/monolithic definition of MDSCs. E-, PMN-, and M-MDSCs are the predominant subpopulations with distinct phenotypes and functions (modified from Hegde et al. (13)). Created with BioRender.com. (B) Cell proportions of monocyte subtypes and MDSCs relative to overall monocytic cells are shown for healthy subjects (“Healthy”) (n=12), septic patients 4 days following diagnosis (“Day 4 ± 1”) (n=4), and septic patients at days 14-21 (separated into those experiencing chronic critical illness (“CCI”) (n=5) or those who rapidly recovered (“RAP”) (n=4)). (C) UMAP embedding of single-cell transcriptomes of peripheral blood mononuclear cells (PBMCs). Cells are colored by the timepoint at which the samples were taken. Samples from day 4 and days 14-21 are from septic patients. (D) Similar to (C), with cells colored by cell type. M, monocytic; PMN, granulocytic; E, early.
Figure 2
Figure 2
Analysis via CITE-seq of differential gene expression of PMN- and M-MDSC subpopulations at different time points relative to healthy subjects. (A) Within PMN-MDSCs, gene expression of twelve healthy subjects (baseline) was compared with septic patients at day 4 (“Day 4 ± 1”) (n=4) and septic patients at days 14-21 (subdivided into chronic critical illness (“CCI”) (n=5) and rapid recovery (“RAP”) (n=4)). Differential expression results relative to healthy subjects were compared for each pair of septic time points (left panel: day 4 vs CCI, middle panel: day 4 vs RAP, right panel: RAP vs CCI). The x-axis is the absolute difference in the p-value per gene (|Δ p-value|) and the y-axis is the difference in log fold-change (Δ logFC). The colored points represent genes that were differentially expressed in a single group or for both groups (p-value < 0.01). (B) Venn diagram of genes with overlapping significant differential expression (p-value < 0.01). (C) Enrichment results of significant genes representing the gene ontology biological processes. The y-axis is the negative log (base 10) of the p-value (-log10(pvalue)). (D-F) Similar to (A-C) for M-MDSCs. PMN, granulocytic; M, monocytic.
Figure 3
Figure 3
UMAP embeddings of peripheral blood mononuclear cells (PBMCs). (A) Clusters are colored according to cell type. Samples from acutely septic patients (“Day 4 ± 1”) and late sepsis patients who either developed chronic critical illness (“CCI”) or experienced rapid recovery (“RAP”). (B) Relative proportions of cell types are depicted with respect to the each septic cohort. (C) Expression of surface markers on subtypes of PBMCs. (D) The left panel denotes percentages of spliced mRNA in different cell types separated by patient cohort. The right panel denotes overall unspliced mRNA across cell types by patient cohort. B, B cells; NK, natural killer cells; HSPC, hematopoietic stem and progenitor cells; pDC, plasmacytoid dendritic cells; Day 4+/-1, acutely septic patients; CCI, chronic critical illness; RAP, rapid recovery.
Figure 4
Figure 4
Marker gene expression across myeloid cell types in septic patients. A dot plot shows scaled mean expression of the top seven most significant differentially expressed genes (DEGs) in each myeloid cell type prior to fine-level annotation for MDSC subpopulations. Point radius indicates the percentage of cells with nonzero expression, and color denotes relatively higher or lower mean expression across cell types. Testing was performed with the Wilcoxon test, and genes were ranked by adj. p-value after Bonferroni correction. CD14+: classical monocyte, CD16+: non-classical monocyte, MK, megakaryocyte; cDC, conventional dendritic cells; infl., inflammatory; M, monocytic; E, early; PMN, granulocytic.
Figure 5
Figure 5
“Emergent” view and annotation of myeloid cell subpopulations in septic patients. (A) Illustration representing the “emergent” definition of MDSCs, incorporating the plasticity and heterogeneity of the myeloid compartment (modified from Hegde et al. (13)). Created with BioRender.com. (B) Fine cell type annotations within cells from septic patients that were broadly annotated as monocytes. The x-axis includes the different myeloid cell subtypes. The y-axis includes genes which were most highly expressed by each cell subtype. The scaled mean expression is denoted by the color of the dots, and the percentages of cells expressing the genes are represented by the size of the dots. (C) UMAP plots of cells of the four distinct subpopulations of MDSCs stratified by acutely septic patients (“Day 4 ± 1”) (n=4) and late sepsis, late sepsis patients who developed chronic critical illness (“CCI”) (n=5) or experienced rapid recovery (“RAP”) (n=4). This includes cells consistent with early (E-) MDSCs, granulocytic (PMN-) MDSCs, monocytic (M-) MDSCs, and a population of cells with characteristics of both M- and PMN-MDSCs, labeled hybrid (H-) MDSCs. MK, megakaryocyte; cDC, conventional dendritic cell; infl., inflammatory.
Figure 6
Figure 6
Characterizing data-driven subpopulations of MDSCs. (A) Relative frequencies of MDSCs by subpopulation. Percent of cells defined by transcriptomic analysis and gene expression, rather than cell surface markers. Grouped by acutely septic patients (“Day 4 ± 1”) (n=4) and late sepsis patients who developed chronic critical illness (“CCI”) (n=5) or experienced rapid recovery (“RAP”) (n=4). (B) Diagram of significant marker genes for each MDSC subpopulation were determined in the pooled septic patients. (C) UMAP plots of all MDSCs are shown for the seven genes that were unique markers of gene expression in the H-MDSC subpopulation compared to all other MDSCs. Scaled expression represented by heat map of each gene. (D) Differential expression testing between septic groups in M-MDSCs revealed four genes that were significant. y-axis is log (expression +1). * = p<0.05, *** = p<0.001, obtained from the mixed model analysis. M, monocytic; PMN, granulocytic; E, early; H, hybrid.
Figure 7
Figure 7
Larger proportions of unspliced mRNA in E- and H- MDSCs. (A) Distribution of unspliced mRNA percent across myeloid cell types. (B-E) Gene-set enrichment analysis of genes having high proportions of unspliced mRNA within each MDSC subpopulation. The left panel shows the gene-set network and clustering of significantly enriched biological processes. The right panels show word clouds for each biologically similar cluster (a general cluster of high-level biological processes was present for each cell-type and omitted). E, early; H, hybrid; M, monocytic; PMN, granulocytic; CD16+, non-classical monocyte; CD14+, classical monocyte; MK, megakaryocyte; cDC, conventional dendritic cell; infl., inflammatory.
Figure 8
Figure 8
Topology of myeloid differentiation and plasticity in septic patients. (A) Myeloid cell smoothed RNA velocity estimates projected onto UMAP. Arrows represent differentiation potential. (B) Undirected partition-based graph abstraction (PAGA) of myeloid cell types. Line width/color between cell types denote relationship strength. Nodes colored by cell type. (C) Arrow directions represent differentiation potential. Arrow widths denote strength of connectivities between cell types. Arrow manually added indicating PMN-MDSC differentiation into granulocytes. (D) Cell state probabilities shown together for M-, PMN-, and E-MDSCs with all other cells in gray. (E) Similar to (D) with H-MDSCs in red. (F) H-MDSC cell fate absorption probabilities. cDC, conventional dendritic cell; infl., inflammatory; CD16+, non-classical monocyte; CD14+, classical monocyte; M, monocytic; H, hybrid; PMN, granulocytic; E, early.
Figure 9
Figure 9
Differences in PMN-, E-, and M-MDSCs across septic time-points. (A) Cell dynamic parameters estimated from CellRank were compared across cells from septic patients at Day 4 ± 1 (acute sepsis) (n=4), patients at day 14-21 who rapidly recovered (“RAP”) (n=4), and patients at day 14-21 who developed chronic critical illness (“CCI”) (n=5) in M-MDSCs. (B, C) Similar to (A) for PMN-MDSCs and E-MDSCs, respectively. Significant p-values (< 0.05) were obtained from fitting a linear mixed model. E, early; PMN, granulocytic; H, hybrid; M, monocytic.
Figure 10
Figure 10
Canonical MDSC genes in immunosuppressive cell subpopulations in septic patients. Heatmap of scaled expression of canonical genes identified in the current MDSC literature. Cells in the four identified MDSC subpopulations are denoted in the colored key. Genes were arranged using hierarchical clustering with complete linkage. Patient groups include acutely septic patients (“Day 4 ± 1”) (n=4) and late sepsis patients who developed chronic critical illness (“CCI”) (n=5) or experienced rapid recovery (“RAP”) (n=4). M, monocytic; PMN, granulocytic; E, early; H, hybrid.

Similar articles

Cited by

  • Unique lymphocyte transcriptomic profiles in septic patients with chronic critical illness.
    Barrios EL, Balzano-Nogueira L, Polcz VE, Rodhouse C, Leary JR, Darden DB, Rincon JC, Dirain ML, Ungaro R, Nacionales DC, Larson SD, Sharma A, Upchurch G, Wallet SM, Brusko TM, Loftus TJ, Mohr AM, Maile R, Bacher R, Cai G, Kladde MP, Mathews CE, Moldawer LL, Brusko MA, Efron PA. Barrios EL, et al. Front Immunol. 2024 Dec 3;15:1478471. doi: 10.3389/fimmu.2024.1478471. eCollection 2024. Front Immunol. 2024. PMID: 39691721 Free PMC article.
  • Innate immune training in the neonatal response to sepsis.
    Rincon JC, Wang D, Polcz VE, Barrios EL, Dirain ML, Ungaro RF, Nacionales DC, Zeumer-Spataro L, Xiao F, Efron PA, Moldawer LL, Cai G, Larson SD. Rincon JC, et al. Mol Med. 2025 Apr 30;31(1):159. doi: 10.1186/s10020-025-01179-5. Mol Med. 2025. PMID: 40307728 Free PMC article.

References

    1. Singer M, Deutschman CS, Seymour CW, Shankar-Hari M, Annane D, Bauer M, et al. . The third international consensus definitions for sepsis and septic shock (Sepsis-3). JAMA. (2016) 315:801–10. doi: 10.1001/jama.2016.0287 - DOI - PMC - PubMed
    1. Stortz JA, Mira JC, Raymond SL, Loftus TJ, Ozrazgat-Baslanti T, Wang Z, et al. . Benchmarking clinical outcomes and the immunocatabolic phenotype of chronic critical illness after sepsis in surgical intensive care unit patients. J Trauma Acute Care Surg. (2018) 84:342–9. doi: 10.1097/TA.0000000000001758 - DOI - PMC - PubMed
    1. Cuenca AG, Delano MJ, Kelly-Scumpia KM, Moreno C, Scumpia PO, Laface DM, et al. . A paradoxical role for myeloid-derived suppressor cells in sepsis and trauma. Mol Med. (2011) 17:281–92. doi: 10.2119/molmed.2010.00178 - DOI - PMC - PubMed
    1. Mathias B, Delmas AL, Ozrazgat-Baslanti T, Vanzant EL, Szpila BE, Mohr AM, et al. . Human myeloid-derived suppressor cells are associated with chronic immune suppression after severe sepsis/septic shock. Ann Surg. (2017) 265:827–34. doi: 10.1097/SLA.0000000000001783 - DOI - PMC - PubMed
    1. Horiguchi H, Loftus TJ, Hawkins RB, Raymond SL, Stortz JA, Hollen MK, et al. . Innate immunity in the persistent inflammation, immunosuppression, and catabolism syndrome and its implications for therapy. Front Immunol. (2018) 9:595. doi: 10.3389/fimmu.2018.00595 - DOI - PMC - PubMed

Publication types