

Xputer: bridging data gaps with NMF, XGBoost, and a streamlined GUI experience
- PMID: 38720912
- PMCID: PMC11076752
- DOI: 10.3389/frai.2024.1345179
Xputer: bridging data gaps with NMF, XGBoost, and a streamlined GUI experience
Abstract
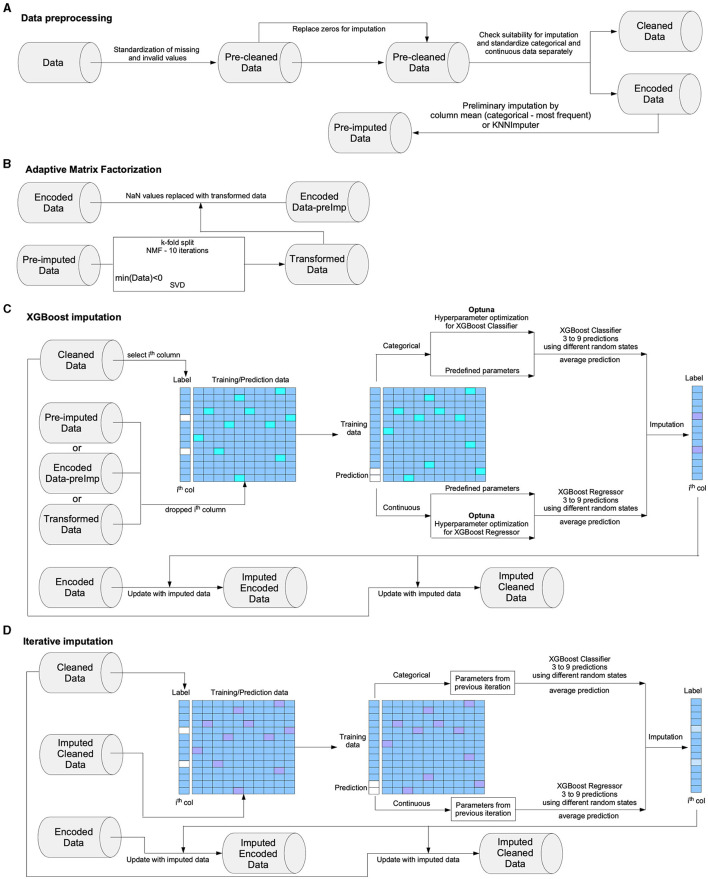
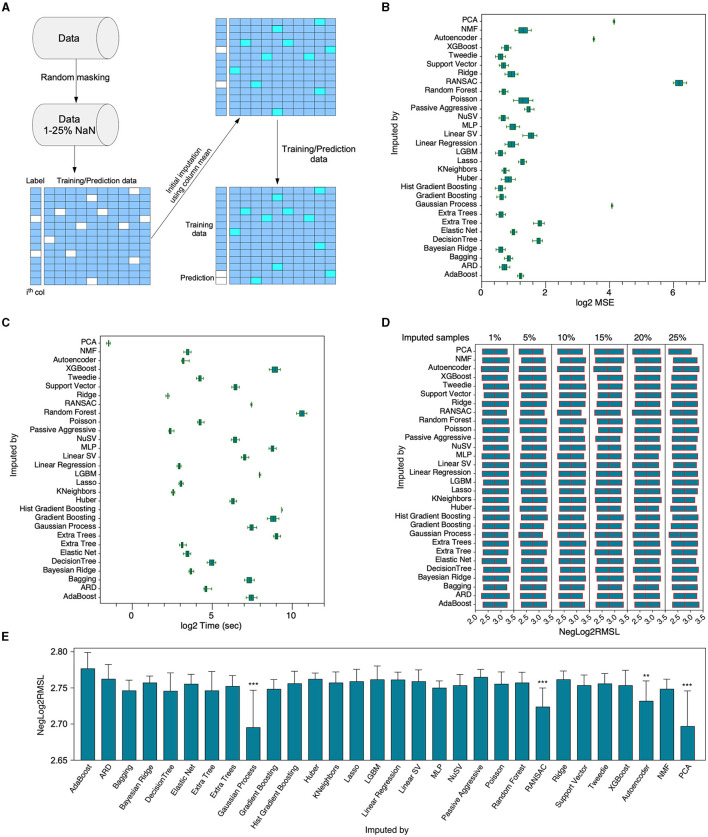
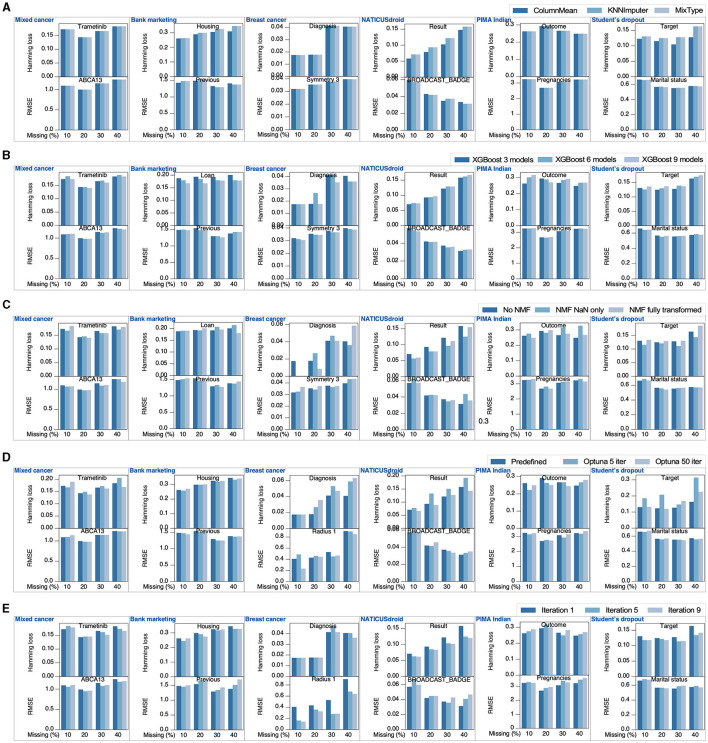
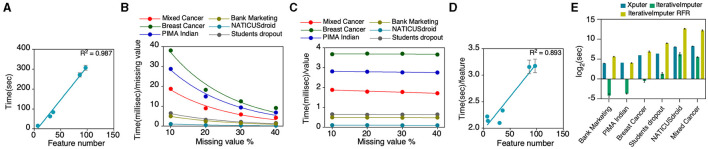
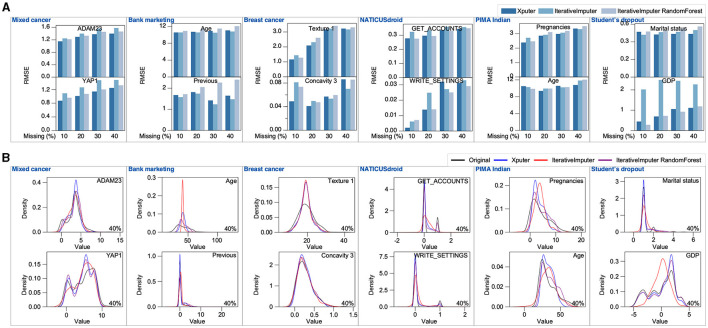
The rapid proliferation of data across diverse fields has accentuated the importance of accurate imputation for missing values. This task is crucial for ensuring data integrity and deriving meaningful insights. In response to this challenge, we present Xputer, a novel imputation tool that adeptly integrates Non-negative Matrix Factorization (NMF) with the predictive strengths of XGBoost. One of Xputer's standout features is its versatility: it supports zero imputation, enables hyperparameter optimization through Optuna, and allows users to define the number of iterations. For enhanced user experience and accessibility, we have equipped Xputer with an intuitive Graphical User Interface (GUI) ensuring ease of handling, even for those less familiar with computational tools. In performance benchmarks, Xputer often outperforms IterativeImputer in terms of imputation accuracy. Furthermore, Xputer autonomously handles a diverse spectrum of data types, including categorical, continuous, and Boolean, eliminating the need for prior preprocessing. Given its blend of performance, flexibility, and user-friendly design, Xputer emerges as a state-of-the-art solution in the realm of data imputation.
Keywords: ensemble learning; imputation; matrix factorization; mix-type data; tabular data.
Copyright © 2024 Younus, Rönnstrand and Kazi.
Conflict of interest statement
The authors declare that the research was conducted in the absence of any commercial or financial relationships that could be construed as a potential conflict of interest.
Figures
Similar articles
-
weIMPUTE: a user-friendly web-based genotype imputation platform.Front Genet. 2025 Mar 17;16:1532464. doi: 10.3389/fgene.2025.1532464. eCollection 2025. Front Genet. 2025. PMID: 40165935 Free PMC article.
-
Optimization and expansion of non-negative matrix factorization.BMC Bioinformatics. 2020 Jan 6;21(1):7. doi: 10.1186/s12859-019-3312-5. BMC Bioinformatics. 2020. PMID: 31906867 Free PMC article.
-
NMF-Based Approach for Missing Values Imputation of Mass Spectrometry Metabolomics Data.Molecules. 2021 Sep 24;26(19):5787. doi: 10.3390/molecules26195787. Molecules. 2021. PMID: 34641330 Free PMC article.
-
Missing Value Estimation using Clustering and Deep Learning within Multiple Imputation Framework.Knowl Based Syst. 2022 Aug 5;249:108968. doi: 10.1016/j.knosys.2022.108968. Epub 2022 May 10. Knowl Based Syst. 2022. PMID: 36159738 Free PMC article.
-
A Review of Integrative Imputation for Multi-Omics Datasets.Front Genet. 2020 Oct 15;11:570255. doi: 10.3389/fgene.2020.570255. eCollection 2020. Front Genet. 2020. PMID: 33193667 Free PMC article. Review.
Cited by
-
XeroGraph: enhancing data integrity in the presence of missing values with statistical and predictive analysis.Bioinform Adv. 2025 Feb 21;5(1):vbaf035. doi: 10.1093/bioadv/vbaf035. eCollection 2025. Bioinform Adv. 2025. PMID: 40061871 Free PMC article.
References
-
- Akiba T., Sano S., Yanase T., Ohta T., Kovama M. (2019). “Optuna: a next-generation hyperparameter optimization framework,” in Proceedings of the 25th {ACM} {SIGKDD} International Conference on Knowledge Discovery and Data Mining KDD 19, 2623–2631. 10.1145/3292500.3330701 - DOI
-
- Anand V., Mamidi V. (2020). “Multiple imputation of missing data in marketing,” in 2020 International Conference on Data Analytics for Business and Industry: Way Towards a Sustainable Economy (ICDABI) (Sakhir: ), 16. 10.1109/ICDABI51230.2020.9325602 - DOI
-
- Breiman L. (2001). Random Forests. Machine Learn. 45, 5–32. 10.1023/A:1010933404324 - DOI
LinkOut - more resources
Full Text Sources