. 2024 Apr 24:15:1385210.
doi: 10.3389/fpls.2024.1385210. eCollection 2024.

Genetic basis of local adaptation in the cold-tolerant mangrove Kandelia obovata

Affiliations

Genetic basis of local adaptation in the cold-tolerant mangrove Kandelia obovata

Chuangchao Zou et al. Front Plant Sci. .

Abstract

Understanding the genetic basis of local adaption is crucial in the context of global climate change. Mangroves, as salt-tolerant trees and shrubs in the intertidal zone of tropical and subtropical coastlines, are particularly vulnerable to climate change. Kandelia obovata, the most cold-tolerant mangrove species, has undergone ecological speciation from its cold-intolerant counterpart, Kandelia candel, with geographic separation by the South China Sea. In this study, we conducted whole-genome re-sequencing of K. obovata populations along China's southeast coast, to elucidate the genetic basis responsible for mangrove local adaptation to climate. Our analysis revealed a strong population structure among the three K. obovata populations, with complex demographic histories involving population expansion, bottleneck, and gene flow. Genome-wide scans unveiled pronounced patterns of selective sweeps in highly differentiated regions among pairwise populations, with stronger signatures observed in the northern populations compared to the southern population. Additionally, significant genotype-environment associations for temperature-related variables were identified, while no associations were detected for precipitation. A set of 39 high-confidence candidate genes underlying local adaptation of K. obovata were identified, which are distinct from genes under selection detected by comparison between K. obovata and its cold-intolerant relative K. candel. These results significantly contribute to our understanding of the genetic underpinnings of local adaptation in K. obovata and provide valuable insights into the evolutionary processes shaping the genetic diversity of mangrove populations in response to climate change.

Keywords: demographic history; genome-environment association; local adaptation; mangroves; population genomics; selective sweeps.


Conflict of interest statement

The authors declare that the research was conducted in the absence of any commercial or financial relationships that could be construed as a potential conflict of interest.

Figures
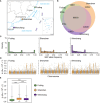
Figure 1
Figure 1
Sampling locations and genetic diversity of three populations of Kandelia obovata in China. (A) Map depicting the sampling locations of the Fuding (n = 14), Shenzhen (n = 17), and Wenchang (n = 15) populations in China. (B) Venn diagrams show the numbers of shared and private SNPs detected in the three K obovata populations. (C) Site frequency spectra based on 189,909 SNPs in each population. (D) Genome-wide analysis of nucleotide diversity (θπ ) in each K obovata populations. θπ was calculated in nonoverlapping 20-kb bins and displayed in logarithmic scale across the K obovata genome. (E) Boxplot displaying the distribution of θπ in three K obovata populations. Asterisks indicate the significance level of Mann-Whitney U test: ***p-value < 0.001.
Figure 2
Figure 2
Population differentiation and genetic structure of Kandelia obovata. (A) Boxplot displaying the genome-wide distributions of fixed index (F ST) in three pairwise populations: F-W (Fuding vs. Wenchang population), F-S (Wenchang vs. Shenzhen population), and S-W, (Wenchang vs. Shenzheng population). (B) Boxplot displaying genome-wide distributions of genetic divergence (DXY) in the same three pairwise populations. Asterisks indicate the significance level of Mann-Whitney U test: ***, p-value < 0.001; “n.s.”, non-significant. (C) Principal components analysis (PCA) based on 189,909 SNPs showing genetic separation among the 46 K. obovata samples. Principal components 1 (28.1%) and principal components 2 (23.3%) are shown. (D) Phylogenetic tree of individuals and population genetic structure. Each individual is represented by a vertical bar, which is partitioned into K (K = 2, 3, 4, and 5) colored segments reflecting the individual's probability of membership to each genetic cluster.
Figure 3
Figure 3
Demographic model depicting the population history of Kandelia obovata in China. Populations are represented by rectangles in distinct colors: ancestral population (ANC) in brown, Wenchang population (W) in purple, Shenzhen population (S) in orange, and Fuding population (F) in green. Changes in the width of each rectangle reflects changes in population size. Solid arrows denote gene flow between pairwise populations, with arrow direction indicating the direction of gene flow. The dashed arrow signifies population expansion in the Fuding population. Point estimates of demographic parameters, including effective population size (Ne ), population size growth rate (g), time (T), and migration rate (m), along with their 95% confidence intervals (CI), are presented below the demographic model. The parameters were estimated using a neutral mutation rate per site per generation (µ) of 7.86 × 10⁻⁸ and a generation time of 20 years for K. obovata. The line chart on the left illustrates the relative sea levels during the last glacial period, depicting the last interglacial period (LIG), the last glacial period (LGP), and the last glacial maximum (LGM).
Figure 4
Figure 4
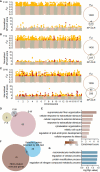
Genome wide signatures of selection and selected genes. Sliding window analysis of fixation index (F ST) and cross-population composite likelihood ratio (XP-CLR) with 20-kb window size and 5-kp step size across the K obovata genome for pairwise populations: (A) Fuding and Wenchang population (F-W), (B) Fuding and Shenzhen population (F-S), and (C) Shenzhen and Wenchang population (S-W). Outlier values (defined as at least 1.96 SD above the mean) are indicated in gold. Venn diagrams show the number of outliers identified by each method. Windows exhibiting both F ST and XP-CLR outliers were identified as highly differentiated regions (HDRs) and indicated in red. (D) Venn diagrams showing the numbers of genes residing in HDRs that were identified in the three comparison pairs. All 78 genes identified as HDR-related selected genes are listed in Supplementary Table S4 . (E) Bar plot displaying the enriched Gene Ontology (GO) terms of biological process of HDR-related selected genes. (F) Venn diagrams showing the overlaps between the 78 HDR-related selected genes and the 27 selected genes identified by the McDonald-Kreitman test (MK test). Genes detected by MK test are listed in Supplementary Table S5 . (G) Bar plot displaying the enriched GO terms of biological process of 27 selected genes identified by the MK test.
Figure 5
Figure 5
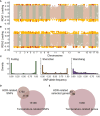
Genome–environment associations detected by redundancy analysis (RDA). SNP loadings on (A) the first RDA axis (RDA1) and (B) the second RDA axis (RDA2). The gold dots represent SNPs with significant associations along the RDA axes (defined as 1.96 standard deviations below or above the mean), and these SNPs are identified as temperature-related SNPs. The red dots represent SNPs located in highly differentiated regions (HDRs). (C) Site frequency spectra based on 16,256 temperature-related SNPs in each population. (D) Venn diagrams showing the overlaps between HDR-related SNPs and temperature-related SNPs. (E) Venn diagrams showing the overlaps between HDR-related selected genes and temperature-related genes. A total of 39 shared genes were identified as high-confidence candidate genes responsible for local temperature adaptation and are listed in Table 2 .

Similar articles

Cited by

References

    1. Alexander D. H., Novembre J., Lange K. (2009). Fast model-based estimation of ancestry in unrelated individuals. Genome Res. 19, 1655–1664. doi: 10.1101/gr.094052.109 - DOI - PMC - PubMed
    1. Altschul S. F., Gish W., Miller W., Myers E. W., Lipman D. J. (1990). Basic local alignment search tool. J. Mol. Biol. 215, 403–410. doi: 10.1016/S0022-2836(05)80360-2 - DOI - PubMed
    1. Angert A. L., Bontrager M. G., Aringgren J. (2020). What Do We Really Know about Adaptation at Range Edges? Annu. Rev. Ecol. Evol. Syst. 51, 341–361. doi: 10.1146/annurev-ecolsys-012120-091002 - DOI
    1. Balick D. J., Jordan D. M., Sunyaev S., Do R. (2022). Overcoming constraints on the detection of recessive selection in human genes from population frequency data. Am. J. Hum. Genet. 109, 33–49. doi: 10.1016/j.ajhg.2021.12.001 - DOI - PMC - PubMed
    1. Baron K. N., Schroeder D. F., Stasolla C. (2012). Transcriptional response of abscisic acid (ABA) metabolism and transport to cold and heat stress applied at the reproductive stage of development in Arabidopsis thaliana. Plant Sci. 188, 48–59. doi: 10.1016/j.plantsci.2012.03.001 - DOI - PubMed

LinkOut - more resources