. 2024 Jul 1;327(1):F61-F76.
doi: 10.1152/ajprenal.00225.2023. Epub 2024 May 9.

Cilia-deficient renal tubule cells are primed for injury with mitochondrial defects and aberrant tryptophan metabolism

Affiliations

Cilia-deficient renal tubule cells are primed for injury with mitochondrial defects and aberrant tryptophan metabolism

Xiaofeng Zuo et al. Am J Physiol Renal Physiol. .

Abstract

The exocyst and Ift88 are necessary for primary ciliogenesis. Overexpression of Exoc5 (OE), a central exocyst component, resulted in longer cilia and enhanced injury recovery. Mitochondria are involved in acute kidney injury (AKI). To investigate cilia and mitochondria, basal respiration and mitochondrial maximal and spare respiratory capacity were measured in Exoc5 OE, Exoc5 knockdown (KD), Exoc5 ciliary targeting sequence mutant (CTS-mut), control Madin-Darby canine kidney (MDCK), Ift88 knockout (KO), and Ift88 rescue cells. In Exoc5 KD, Exoc5 CTS-mut, and Ift88 KO cells, these parameters were decreased. In Exoc5 OE and Ift88 rescue cells they were increased. Reactive oxygen species were higher in Exoc5 KD, Exoc5 CTS-mut, and Ift88 KO cells compared with Exoc5 OE, control, and Ift88 rescue cells. By electron microscopy, mitochondria appeared abnormal in Exoc5 KD, Exoc5 CTS-mut, and Ift88 KO cells. A metabolomics screen of control, Exoc5 KD, Exoc5 CTS-mut, Exoc5 OE, Ift88 KO, and Ift88 rescue cells showed a marked increase in tryptophan levels in Exoc5 CTS-mut (113-fold) and Exoc5 KD (58-fold) compared with control cells. A 21% increase was seen in Ift88 KO compared with rescue cells. In Exoc5 OE compared with control cells, tryptophan was decreased 59%. To determine the effects of ciliary loss on AKI, we generated proximal tubule-specific Exoc5 and Ift88 KO mice. These mice had loss of primary cilia, decreased mitochondrial ATP synthase, and increased tryptophan in proximal tubules with greater injury following ischemia-reperfusion. These data indicate that cilia-deficient renal tubule cells are primed for injury with mitochondrial defects in tryptophan metabolism.NEW & NOTEWORTHY Mitochondria are centrally involved in acute kidney injury (AKI). Here, we show that cilia-deficient renal tubule cells both in vitro in cell culture and in vivo in mice are primed for injury with mitochondrial defects and aberrant tryptophan metabolism. These data suggest therapeutic strategies such as enhancing ciliogenesis or improving mitochondrial function to protect patients at risk for AKI.

Keywords: acute kidney injury; exocyst; mitochondria; oxidative stress; primary cilia.


Conflict of interest statement

No conflicts of interest, financial or otherwise, are declared by the authors.

Figures
None
Graphical abstract
Figure 1.
Figure 1.
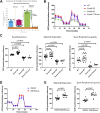
Exoc5 knockdown (KD) and ciliary targeting sequence-mutant (CTS-mut) Madin–Darby canine kidney (MDCK) cells as well as Ift88 knockout (KO) cells have significantly decreased basal respiration, maximal respiration, and spare respiratory capacity. A: schematic detailing the Seahorse XF Cell Mito Stress Test (adapted from the webpage of the Weill Cornell Medicine Metabolic Phenotyping Center). B: Seahorse study for Exoc5 overexpressing (OE), Exoc5 KD, Exoc5 CTS-mut, and control MDCK cells. C: statistical analysis of the results from B showed significantly decreased basal respiration, maximal respiration, and spare respiratory capacity in the Exoc5 KD and CTS-mutant cells compared with the Exoc5 control cells. In contrast, there was significantly increased basal respiration, maximal respiration, and spare respiratory capacity in the Exoc5 OE compared with control cells. D: Seahorse study for Ift88 KO and rescue cells. E: statistical analysis of the results from D showed significantly decreased maximal respiration and spare respiratory capacity in the Ift88 KO compared with rescue cells. This experiment was repeated three times with similar results.
Figure 2.
Figure 2.
Exoc5 knockdown (KD) and ciliary targeting sequence-mutant (CTS-mut) Madin–Darby canine kidney (MDCK) as well as Ift88 knockout (KO) cells have significantly higher amounts of reactive oxygen species (ROS) compared with control, Exoc5 overexpressing (OE), and Ift88 rescue cells. Exoc5 and Ift88 cells were seeded on Transwell filters and cultured for 10 days. The cells were then incubated with CellROX Deep Red reagent with far-red fluorescence to visualize ROS (red), MitoTracker, which is a mitochondrial cell membrane-permeable rhodamine-based dye (which was pseudocolored green in this figure), and Hoechst nuclear stain (blue) for 60 min at 37°C. A and B: staining and statistical analysis showed increased ROS in Exoc5 KD and CTS-mut cells compared with Exoc5 OE and control MDCK cells. Bar = 60 µm. C and D: staining and statistical analysis showed increased ROS in Ift88 KO compared with rescue cells. Colocalization of the mitochondria (MitoTracker) and ROS (CellROX) in A and C indicate that the ROS were generated in mitochondria. Bar = 10 µm. The same confocal microscope imaging parameters (gain, zoom, objective) were used for each panel. This experiment was repeated three times with similar results.
Figure 3.
Figure 3.
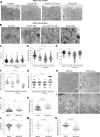
Mitochondrial structure in Madin–Darby canine kidney (MDCK) and mouse cells. A and B: electron microscopic images of mitochondria obtained in MDCK cells. Arrowheads denote mitochondria; scale bar is shown. A and B: images taken at ×20,000 and ×80,000, respectively. CG: analysis of data from the mitochondrial images in the MDCK cells. n = 3 independent experimental samples per group. Each dot is a mitochondrion (CE) or an individual image (F). n = 66, 62, 98, and 41 in C–E and 9, 13, 13, and 9 in F. G: each dot is a mitochondrion. n (scored) = 77, 83, 125, and 83. H and I: electron microscopic images of mitochondria obtained in mouse cells. n = 5 independent experimental samples per group. Arrowheads denote mitochondria; scale bar is shown. H and I: images taken at ×25,000 and ×80,000, respectively. JN: analysis of data from the mitochondrial images in the mouse cells. Each dot is a mitochondrion (JL) or an individual image (M). n = 77 and 45 in J–L and 5 and 5 in M. N: each dot is a mitochondrion. n (scored) = 77 and 45. For G and N, each electron microscopy (EM) micrograph was reviewed in a blinded fashion by an investigator who quantified the degree of ultrastructural mitochondrial damage (on a scale of 0 to 5) based on the assessment of structural abnormalities in the cristae, mitochondrial swelling, membrane and cristae integrity, matrix density, and the presence of intramitochondrial deposits. A score of 0 was assigned to a healthy well-defined mitochondrion with clearly visible cristae and intermembrane space and no swelling, whereas a score of 5 indicated the most damaged mitochondrion with disrupted or lost cristae, extreme swelling, and signs of mitophagy. One-way ANOVA with Holm–Sidak post hoc was used for all comparisons. CTS-mut, ciliary targeting sequence-mutant; KD, knockdown; KO, knockout; OE, overexpressing.
Figure 4.
Figure 4.
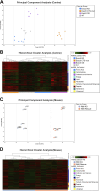
Each of the experimental conditions revealed distinct patterns. A: the data were collected as described in materials and methods and principal component analysis (PCA) was performed using the data from the Madin–Darby canine kidney (MDCK) cell lines [wild type (WT) as the control, Exoc5 knockdown (KD), Exoc5 overexpressing (OE), and Exoc5 ciliary targeting sequence-mutant (CTS-mut)], which demonstrated distinct metabolic profiles for each cell type. B: hierarchical clustering analysis (HCA) of the data was used to obtain a high-level view of the data sets and confirmed that each of the MDCK cell types were unique, especially with respect to the metabolic pathways listed to the right. C: PCA was performed from the data collected from the murine collecting duct cell lines (Ift88 KO and Ift88 rescue). D: HCA confirmed that each of the murine cell types were unique, especially with respect to the metabolic pathways listed to the right.
Figure 5.
Figure 5.
Altered metabolic pathways included the tryptophan pathway which had the most significant changes in the data set. A: the tryptophan metabolic pathway is shown. B: relative levels of tryptophan, and its metabolite kynurenine, are shown for the Madin–Darby canine kidney (MDCK) cell lines [wild type (WT), Exoc5 knockdown (KD), Exoc5 overexpressing (OE), and Exoc5 ciliary targeting sequence-mutant (CTS-mut)]. Tryptophan was very significantly increased in Exoc5 KD and Exoc5 CTS-mut cell lines, and decreased in Exoc5 OE, compared with WT cells. Concomitantly, kynurenine was decreased in Exoc5 KD and Exoc5 CTS-mut cell lines and increased in Exoc5 OE cells compared with WT cells. C: tryptophan was significantly increased in Ift88 KO compared with Ift88 rescue cells, whereas kynurenine was decreased in Ift88 KO compared with Ift88 rescue cells.
Figure 6.
Figure 6.
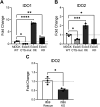
Indoleamine 2,3-dioxygenase (IDO1/2) gene expression is altered in ciliary mutants. Cells were grown in 10-cm cell culture dishes to confluency and harvested, RNA was isolated, and RT-qPCR gene expression analysis was performed. A: IDO1 gene expression in the Madin–Darby canine kidney (MDCK) wild-type (WT) cell line and in stable mutant cell lines with altered expression of the ciliary protein Exoc5: Exoc5 ciliary targeting sequence-mutant (CTS-mut), Exoc5 overexpressing (OE), and Exoc5. B: IDO2 gene expression in the MDCK background cell line and in stable mutant cell lines with altered expression of the ciliary protein Exoc5. C: IDO2 gene expression in mouse cells with loss of Ift88 [Ift88 knockout (KO)] or a rescue where Ift88 has been added back (Ift88 Rescue). Asterisks represent significance with one-way ANOVA (A and B) or a Student’s unpaired t test (C). The housekeeping gene used in both MDCK (canine) and Ift88 (mouse) cells was hypoxanthine phosphoribosyltransferase 1 (HPRT1), and the 2−ΔΔCt method was used to calculate fold change. Experiments were run in biological triplicate. *P < 0.05; **P < 0.01; ***P < 0.001; ****P < 0.0001.
Figure 7.
Figure 7.
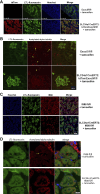
Proximal tubule-specific knockout (KO) of Exoc5 and Ift88 using the SLC34CreERT2 driver line. A: proximal tubule-specific Exoc5 KO mice (SLC34a1-CreERT2;tdTom-Exoc5fl/fl mice) and littermate (tdTom-Exoc5fl/fl or tdTom-Exoc5fl/+) control mice were identified by genotyping at 21 days after birth using PCR. At age 7 wk, tamoxifen was injected intraperitoneally to activate Cre recombinase. tdTomato has a lox-stop-lox cassette surrounding the Tomato reporter, allowing us to confirm Exoc5 KO by tdTomato expression (red color) and colocalization with the proximal tubule-specific Lotus tetragonolobus agglutinin (LTL) marker (green). Bar = 100 µm. B: proximal tubule-specific Exoc5 KO resulted in loss of primary cilia as determined using antibody against acetylated α-tubulin, which stains primary cilia, and LTL-fluorescein. Cilia are seen on LTL-positive (yellow arrow) and negative (arrowhead) cells in the control but not on the LTL-positive cells of the proximal tubule-specific Exoc5 KO mice. Bar = 10 µm. C: to confirm proximal tubule-specific KO of Ift88, we used antibody against Ift88 and LTL-fluorescein. Bar = 60 µm. D: loss of primary cilia in the proximal tubules was confirmed using LTL-fluorescein and acetylated α-tubulin. Cilia are seen on LTL-positive cells (yellow arrow) in the control but not on the LTL-positive cells of the proximal tubule-specific Ift88 KO mice. Bar = 10 µm.
Figure 8.
Figure 8.
Proximal tubule-specific knockout (KO) of Exoc5 and Ift88 using the SLC34CreERT2 driver line leads to decreased ATP synthase. Proximal tubule-specific Exoc5 and Ift88 KO mice and littermate control mice were identified by genotyping at 21 days after birth using PCR. At age 7 wk, tamoxifen was injected intraperitoneally to activate Cre recombinase. The mice were euthanized and staining of the kidney sections was performed with antibodies against ATP synthase (red), Lotus tetragonolobus (LTL) lectin (green), and Hoechst nuclear stain (blue). A: proximal tubule-specific Exoc5 KO (SLC34a1-CreERT2;Exoc5fl/fl) compared with Exoc5 control (Exoc5fl/fl) resulted in a significant loss of mitochondrial ATP synthase in the proximal tubules. There was similar staining intensity of ATP synthase in LTL-positive proximal tubules (#) compared with other tubular segments (*) in the Exoc5 control kidneys, whereas in the Exoc5 KO kidneys the ATP synthase staining intensity was decreased in LTL-positive proximal tubules (#) compared with other tubular segments (*). B: proximal tubule-specific Ift88 KO (SLC34a1-CreERT2;Ift88fl/fl) compared with Ift88 control (Ift88fl/fl) resulted in a significant loss of mitochondrial ATP synthase in the proximal tubules. There was similar staining intensity of ATP synthase in LTL-positive proximal tubules (#) compared with other tubular segments (*) in the Ift88 control kidneys, whereas in the Ift88 KO kidneys the staining intensity of ATP synthase was decreased in LTL-positive proximal tubules (#) compared with other tubular segments (*). Bar = 30 µm for A and B. The same confocal microscope imaging parameters (gain, zoom, objective) were used for each pair of mice (Exoc5 KO/control and Ift88 KO/control).
Figure 9.
Figure 9.
Proximal tubule-specific knockout (KO) of Exoc5 and Ift88 using the SLC34CreERT2 driver line leads to increased tryptophan staining. Proximal tubule-specific Exoc5 and Ift88 KO mice and littermate control mice were identified by genotyping at 21 days after birth using PCR. At age 7 wk, tamoxifen was injected intraperitoneally to activate Cre recombinase. The mice were euthanized and staining of the kidney sections was performed with l-tryptophan antibodies (red) and Lotus tetragonolobus (LTL) lectin (green). A: proximal tubule-specific Exoc5 KO (SLC34a1-CreERT2;Exoc5fl/fl) compared with Exoc5 control (Exoc5fl/fl) resulted in a significant increase in tryptophan staining in the proximal tubules. There was similar staining intensity of tryptophan in LTL-positive proximal tubules (#) compared with other tubular segments (*) in the Exoc5 control kidneys, whereas in the Exoc5 KO kidneys tryptophan staining intensity was increased in LTL-positive proximal tubules (#) compared with other tubular segments (*). B: proximal tubule-specific Ift88 KO (SLC34a1-CreERT2;Ift88fl/fl) compared with Ift88 control (Ift88fl/fl) resulted in a significant increase in tryptophan staining in the proximal tubules. The staining intensity of tryptophan was similar in LTL-positive proximal tubules (#) compared with other tubular segments (*) in the Ift88 control kidneys, whereas in the Ift88 KO kidneys the staining intensity of tryptophan was increased in LTL-positive proximal tubules (#) compared with other tubular segments (*). Bar = 30 µm for A and B. The same confocal microscope imaging parameters (gain, zoom, objective) were used for each pair of mice (Exoc5 KO/control and Ift88 KO/control).
Figure 10.
Figure 10.
Proximal tubule-specific Exoc5 knockout (KO) mice generated using the SLC34a1CreERT2 driver line suffer greater renal damage following ischemia-reperfusion (I/R) injury. A: representative image of hematoxylin and eosin staining of bisected kidneys in proximal tubule-specific Exoc5 KO (SLC34a1CreERT2:tdTomExoc5fl/fl + tamoxifen + I/R) and control (Exoc5fl/+ or Exoc5fl/fl + tamoxifen + I/R) mice showed greater kidney injury in the proximal tubule-specific Exoc5 mice 8 days following I/R. B: higher magnification view of the hematoxylin and eosin-stained kidney tissue. C: plasma creatinine levels were higher in the kidneys of Exoc5 proximal tubule-specific KO compared with control mice at days 1, 4, and 8 following I/R injury. **P = 0.005.
Figure 11.
Figure 11.
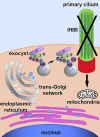
Model of how the exocyst and Ift88 are involved in ciliogenesis and how loss of cilia leads to mitochondrial defects. Genes are transcribed into mRNA in the nucleus and mRNA is translated into proteins in the endoplasmic reticulum. Proteins, such as Ift88, destined for the primary cilium are packaged in vesicles in the trans-Golgi network and trafficked to the primary cilium by the exocyst complex. The small GTPase Cdc42 helps localize the exocyst to the primary cilium. Exoc5 is a central exocyst member as it links Exoc6 (bound to the vesicles via Rab8) and the rest of the exocyst complex. Loss of primary cilia either by knockout of Exoc5 or Ift88 leads to mitochondrial defects and aberrant tryptophan metabolism, which, in turn, primes the cells for injury.

References

    1. Novick P, Field C, Schekman R. Identification of 23 complementation groups required for post-translational events in the yeast secretory pathway. Cell 21: 205–215, 1980. doi: 10.1016/0092-8674(80)90128-2. - DOI - PubMed
    1. Hsu SC, Ting AE, Hazuka CD, Davanger S, Kenny JW, Kee Y, Scheller RH. The mammalian brain rsec6/8 complex. Neuron 17: 1209–1219, 1996. doi: 10.1016/s0896-6273(00)80251-2. - DOI - PubMed
    1. Fogelgren B, Lin SY, Zuo X, Jaffe KM, Park KM, Reichert RJ, Bell PD, Burdine RD, Lipschutz JH. The exocyst protein Sec10 interacts with polycystin-2 and knockdown causes PKD-phenotypes. PLoS Genet 7: e1001361, 2011. doi: 10.1371/journal.pgen.1001361. - DOI - PMC - PubMed
    1. Lobo GP, Fulmer D, Guo L, Zuo X, Dang Y, Kim SH, Su Y, George K, Obert E, Fogelgren B, Nihalani D, Norris RA, Rohrer B, Lipschutz JH. The exocyst is required for photoreceptor ciliogenesis and retinal development. J Biol Chem 292: 14814–14826, 2017. doi: 10.1074/jbc.M117.795674. - DOI - PMC - PubMed
    1. Zuo X, Guo W, Lipschutz JH. The exocyst protein Sec10 is necessary for primary ciliogenesis and cystogenesis in vitro. Mol Biol Cell 20: 2522–2529, 2009. doi: 10.1091/mbc.e08-07-0772. - DOI - PMC - PubMed

MeSH terms

LinkOut - more resources