. 2024 Jul 1;17(7):dmm050191.
doi: 10.1242/dmm.050191. Epub 2024 Jul 3.

Functional exploration of copy number alterations in a Drosophila model of triple-negative breast cancer

Affiliations

Functional exploration of copy number alterations in a Drosophila model of triple-negative breast cancer

Jennifer E L Diaz et al. Dis Model Mech. .

Abstract

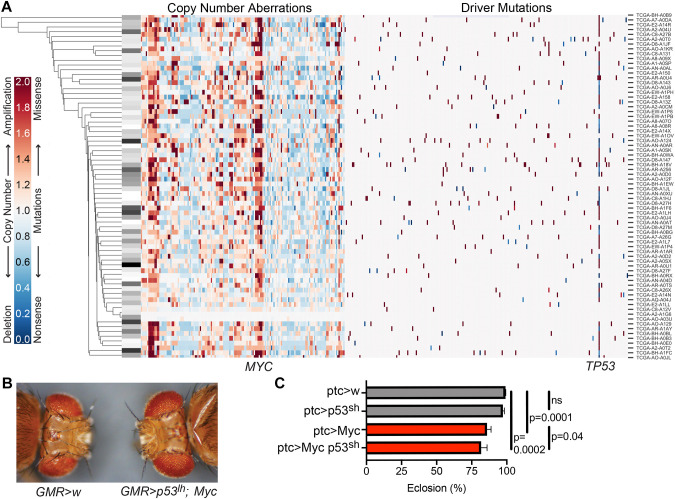
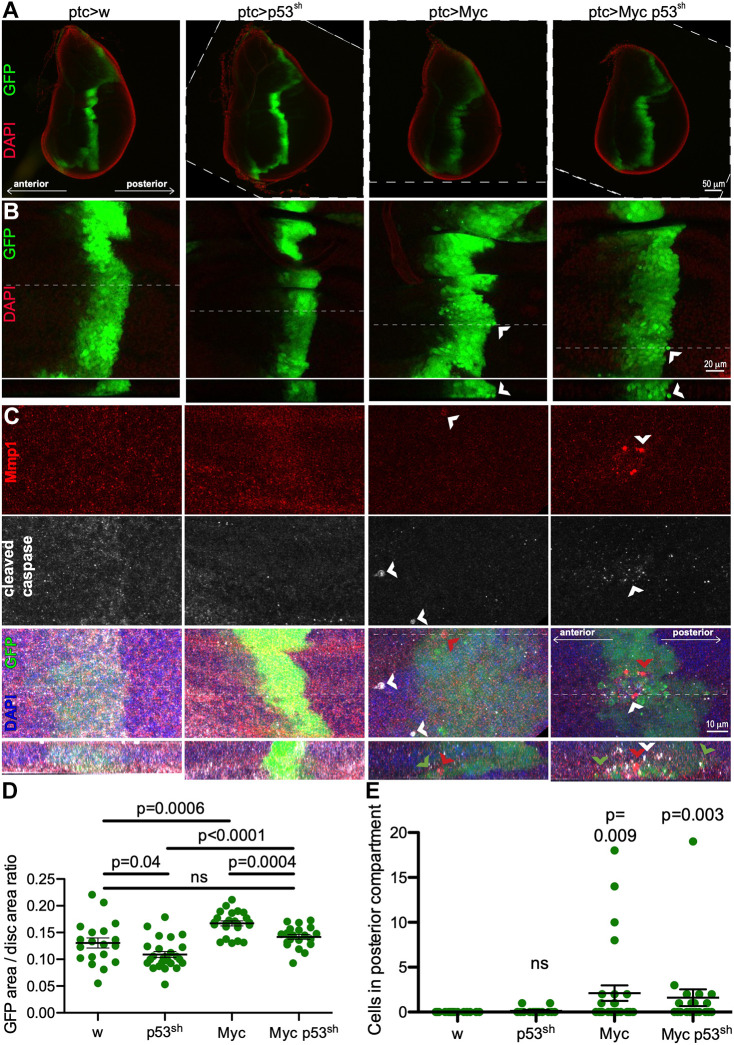
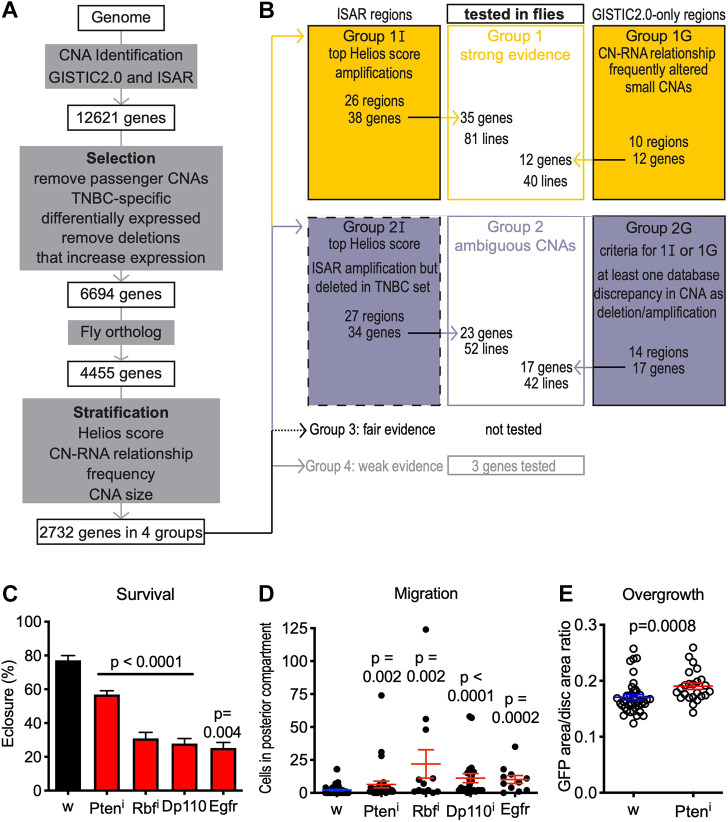
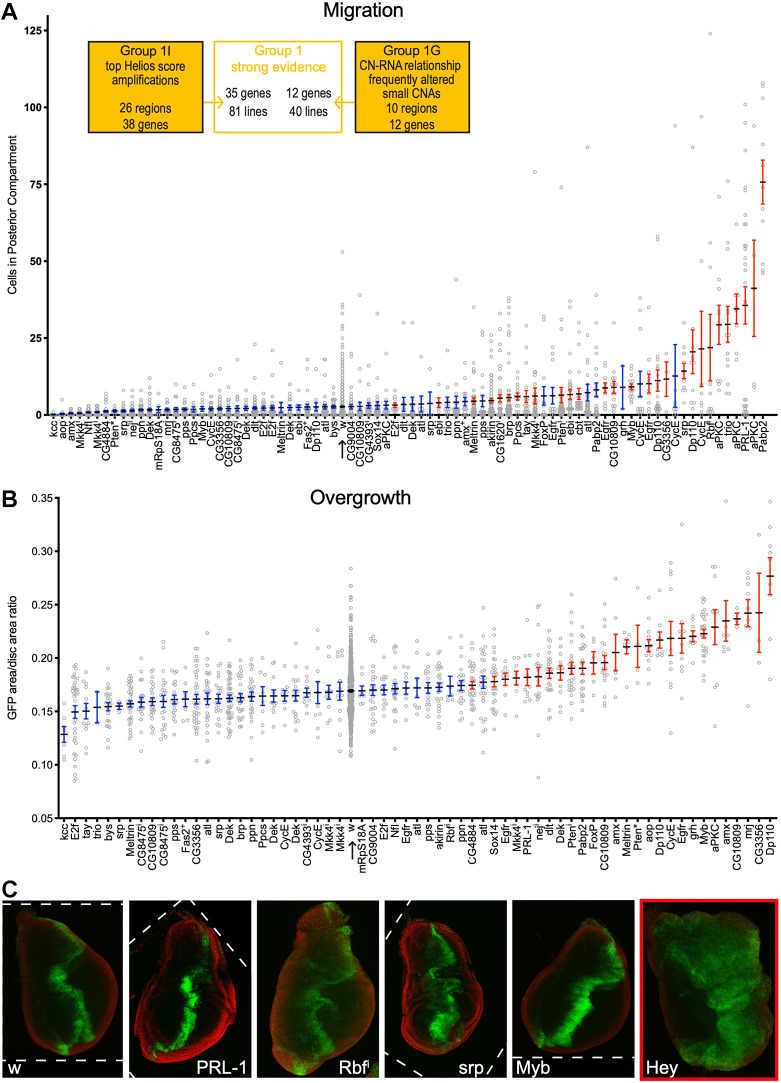
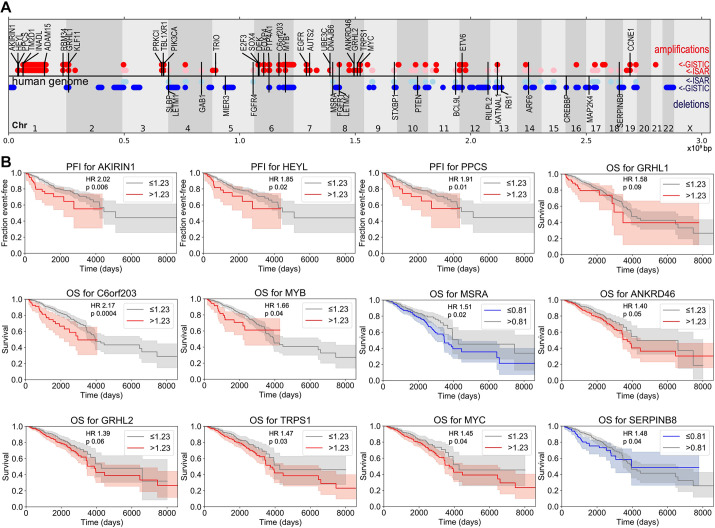
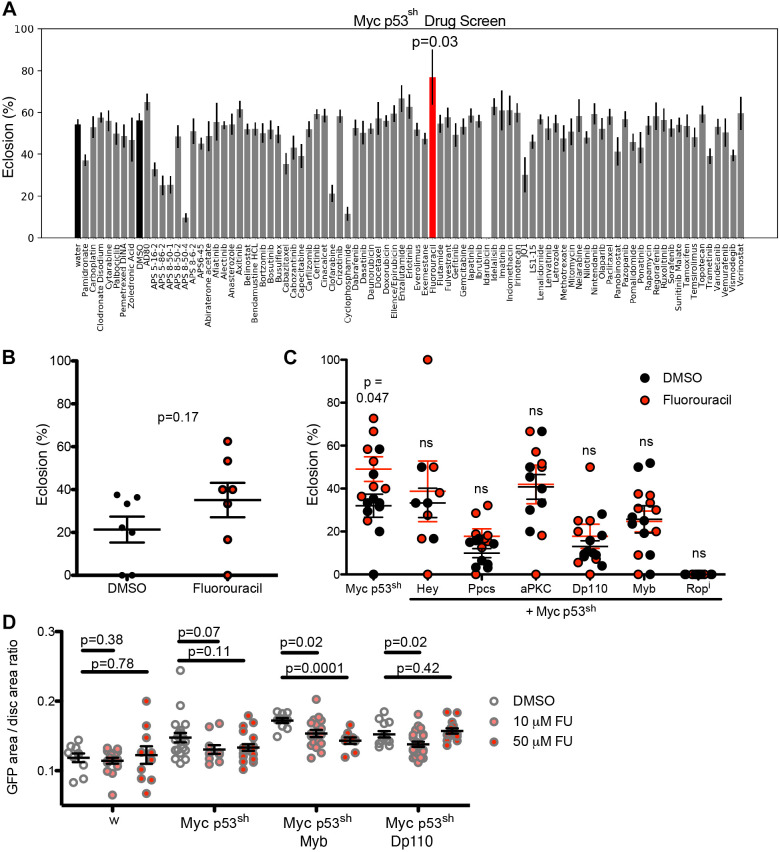
Accounting for 10-20% of breast cancer cases, triple-negative breast cancer (TNBC) is associated with a disproportionate number of breast cancer deaths. One challenge in studying TNBC is its genomic profile: with the exception of TP53 loss, most breast cancer tumors are characterized by a high number of copy number alterations (CNAs), making modeling the disease in whole animals challenging. We computationally analyzed 186 CNA regions previously identified in breast cancer tumors to rank genes within each region by likelihood of acting as a tumor driver. We then used a Drosophila p53-Myc TNBC model to identify 48 genes as functional drivers. To demonstrate the utility of this functional database, we established six 3-hit models; altering candidate genes led to increased aspects of transformation as well as resistance to the chemotherapeutic drug fluorouracil. Our work provides a functional database of CNA-associated TNBC drivers, and a template for an integrated computational/whole-animal approach to identify functional drivers of transformation and drug resistance within CNAs in other tumor types.

Keywords: Drosophila; Genomics; Triple-negative breast cancer.


Conflict of interest statement

Competing interests The authors declare no competing or financial interests.

Figures

Fig. 1.
Fig. 1.
Altered TP53 and MYC genes are present in TNBC tumors and reduce Drosophila survival. (A) Hierarchical clustering of TNBC primary tumors as listed in TCGA, based on CNA and mutation of putative driver genes. CNAs are shown in order of genomic location, mutated putative driver genes are listed in alphabetical order. Overall survival of each patient is shown coded at the left, with white representing the longest and black the shortest survival. n=72. (B) Heads of GMR>w (control) and GMR>p53lh;Myc flies. Eyes were enlarged when targeted by Myc overexpression plus p53 knockdown (p53lh; long hairpin). (C) Quantification of survival (shown as percent eclosion) of Myc-expressing flies in the presence (ptc>w and ptc>Myc) and absence (ptc>p53sh and ptc>Myc p53sh) of p53 knockdown (p53sh; short hairpin). Kruskal–Wallis test: P<0.0001. n=14. Error bars represent the +standard error of the mean (+s.e.m.) and do not reflect the paired nature of the data. Other P-values: Wilcoxon test. See also Fig. S1 and Table S2.
Fig. 2.
Fig. 2.
Overexpression of Myc promotes tissue expansion and cell translocation in Drosophila wing discs. (A) Representative wing discs of flies expressing combinations of Myc and p53sh as indicated. Genotypically white (ptc>w) flies served as controls. DAPI staining (red) highlights tissue boundary, GFP signal (green) demarcates transgene expression. Some images rotated for comparison with borders indicated by dashed lines. (B) Maximum projections of confocal z-stacks of the lower half of the wing discs as in shown in the respective images in A, dashed lines indicate the region of virtual sectioning shown in lower inset. (C) Maximum projections (upper three rows) and z-stacks (bottom row) of confocal stacks of the lower half of wing discs such as in A stained with antibodies against Mmp1 antibody (red) or cleaved-caspase (white), both indicative of cell translocation (Rudrapatna et al., 2013); dashed lines indicate the region of virtual sectioning shown in lower inset. Arrowheads in B and C mark delaminating cells. Brightness and contrast were uniformly increased to improve visualization. In A-C, anterior at left, posterior at right, apical at top, basal at bottom. (D) Quantification of transgenic tissue overgrowth in flies expressing Myc and p53sh driven by ptc-Gal4 alone or in combination. Kruskal–Wallis test: P<0.0001. Other P-values: Student's t-tests. (E) Quantification of cell translocation in transgenic tissue produced by flies expressing Myc and p53sh driven by ptc-Gal4 or in combination. Kruskal–Wallis test: P=0.0075. Other P-values: Mann–Whitney test compared to w controls. No significant differences were observed between flies expressing Myc and Myc,p53sh. See also Fig. S2.
Fig. 3.
Fig. 3.
Integrated computational-functional screen to assess potential TNBC driver genes. (A) Prioritization scheme of potential driver genes from CNAs based on TCGA data. (B) Prioritized groups of genes for functional testing. Computational evidence is weaker for Group 2I (dashed border) than Group 2G. (C-E) Validation of the screening results: reduced activity after using RNA-interference (Pteni, Rbfi) or increased activity after overexpression (Dp110, Egfr). Four known driver genes in trans to ptc>Myc,p53sh led to decreased viability (C) (n=4 for Egfr, n=8 otherwise), increased cell translocation (D) and increased overgrowth of transgenic tissue (Pteni shown as example in E) compared to ptc>Myc,p53sh alone. P-values reflect Student's t-test where data are normally distributed or, otherwise, Mann–Whitney test, compared to genotypically white (w) control flies (ptc>w). (w). See also Fig. S3 and Table S3.
Fig. 4.
Fig. 4.
Driver genes produce tissue phenotypes in the background of Myc and p53sh. (A) Quantification of cell translocation for high-priority genes based on their known link to cancer progression. genes. Altering genes marked in red directed a significant increase in translocation compared to ptc>w controls (arrow), measured as P<0.05 in the original experiment and false discovery rate (fdr)<0.1 in the aggregate analysis shown here. Reducing activity of individual genes from each Group in the context of ptc>Myc p53sh, 16/52 from Group1I and 7/21 from Group 1G were significant. (B) Quantification of transgenic tissue overgrowth for high-priority genes. Altering genes marked in red directed a significant increase compared to w (arrow), measured as P<0.05 in the original experiment and fdr<0.1 in the aggregate analysis shown here. Some genes that are significant in this figure were not significant in their respective experiments due to variation between experiments. i indicates RNA-interference mediated knockdown; * indicates a heterozygous null allele;+indicates a duplication. 15/23 from Group1I and 5/12 from Group 1G were significant. (C) Selected phenotypes produced by specific driver genes: cell translocation (PRL-1, Rbfi, srp), small overt mass (Rbfi), disruption of morphology (srp), transgenic tissue overgrowth (Myb, Hey), and large overt mass (Hey), all compared to w. DAPI staining (red) highlights tissue boundary, GFP signal (green) demarcates transgene expression. Some images were rotated for comparison; borders are indicated by dashed lines. Translocation and overgrowth were not quantified for Hey (last image on right) because the large overt mass phenotype was 100% penetrant. In all cases, each gene was placed in trans to ptc>Myc,p53sh and compared to ptc>Myc,p53sh alone. See also Fig. S4 and Tables S12, S13.
Fig. 5.
Fig. 5.
Known and novel driver genes in TNBC identified functionally. (A) Map of genomic regions that are amplified (red) and deleted (blue) in TNBC, and the location of functionally validated TNBC driver genes identified in our screen. Group 2I regions, representing some ambiguity, are represented in pink and light blue. Genes comprising an ambiguous CNA type are represented with a line extending through both amplified and deleted regions. Genes above the horizontal axis are oncogenes; genes below the axis are tumor suppressors. MYB (indicated by *) can function as both. (B) Kaplan–Meier curves of progression-free interval (PFI) or overall survival (OS) in the TCGA breast cancer dataset for CNA driver genes (log-rank P-value<0.1). Amplified genes in red; deleted genes in blue. HR=Cox hazard ratio. See also Tables S1, S5 and S7. Similar-appearing Kaplan–Meier curves for different genes reflect genes from the same CNA region that are likely to be altered in the same cohort of patients (see Discussion).
Fig. 6.
Fig. 6.
Genetic modifiers abrogate the response of p53sh Myc to fluorouracil. (A) ptc>Myc,p53sh Drosophila strains were cultured in medium containing screening-optimized doses of cancer drugs at 27°C. Viability was assessed and eclosion rate for each drug is shown in percent. DMSO was used as a control for drugs dissolved in DMSO and water was used as a control for drugs dissolved in water (black bars). Fluorouracil (red bar) significantly improved viability (Mann–Whitney U test versus DMSO: P=0.03). (B,C) Fluorouracil was tested on the ptc>Myc,p53sh line at 27°C (B) and the ptc>Myc,p53sh line plus six selected driver genes (Hey, Ppcs, aPKC, Dp110, Myb, Rop as indicated) at 27°C (C). In each case, addition of an additional driver led to loss of fluorouracil-mediated rescue. ns, not significant. (D) Fluorouracil was tested at two doses (10 or 50 µM) on control (ptc>w), ptc>Myc,p53sh (Myc p53sh), ptc>Myc,p53sh,Myb (Myc,p53sh Myb) and ptc>Myc,p53sh,Dp110 (Myc,p53sh Dp11) flies, and transgenic tissue overgrowth was quantified as described in Fig. 4B. Two-way ANOVA results were (C) genotype: P<0.0001, drug: ns, interaction: ns; (D) genotype: P<0.0001, drug: P=0.0054, interaction: P=0.0883. Displayed P-values reflect t-tests (see Materials and Methods). See also Table S8.

References

    1. Akavia, U. D., Litvin, O., Kim, J., Sanchez-Garcia, F., Kotliar, D., Causton, H. C., Pochanard, P., Mozes, E., Garraway, L. A. and Pe'er, D. (2010). An integrated approach to uncover drivers of cancer. Cell 143, 1005-1017. 10.1016/j.cell.2010.11.013 - DOI - PMC - PubMed
    1. Al-Lazikani, B., Banerji, U. and Workman, P. (2012). Combinatorial drug therapy for cancer in the post-genomic era. Nat. Biotechnol. 30, 679-692. 10.1038/nbt.2284 - DOI - PubMed
    1. Aran, D., Sirota, M. and Butte, A. J. (2017). Systematic pan-cancer analysis of tumour purity. Nat. Commun. 6, 8971. 10.1038/ncomms9971 - DOI - PMC - PubMed
    1. Aure, M. R., Steinfeld, I., Baumbusch, L. O., Liestøl, K., Lipson, D., Nyberg, S., Naume, B., Sahlberg, K. K., Kristensen, V. N., Børresen-Dale, A.-L., et al. (2013). Identifying in-trans process associated genes in breast cancer by integrated analysis of copy number and expression data. PLoS One 8, e53014. 10.1371/journal.pone.0053014 - DOI - PMC - PubMed
    1. Bangi, E., Murgia, C., Teague, A. G. S., Sansom, O. J. and Cagan, R. L. (2016). Functional exploration of colorectal cancer genomes using Drosophila. Nat. Commun. 7, 13615. 10.1038/ncomms13615 - DOI - PMC - PubMed

MeSH terms

LinkOut - more resources