. 2024 Jul;96(1):175-186.
doi: 10.1002/ana.26948. Epub 2024 May 9.

Electroencephalographic Correlates of Clinical Severity in the Natural history study of RTT and Related Disorders

Affiliations

Electroencephalographic Correlates of Clinical Severity in the Natural history study of RTT and Related Disorders

Joni N Saby et al. Ann Neurol. 2024 Jul.

Abstract

Objective: This study was undertaken to characterize quantitative electroencephalographic (EEG) features in participants from the Natural history study of RTT and Related Disorders and to assess the potential for these features to act as objective measures of cortical function for Rett syndrome (RTT).

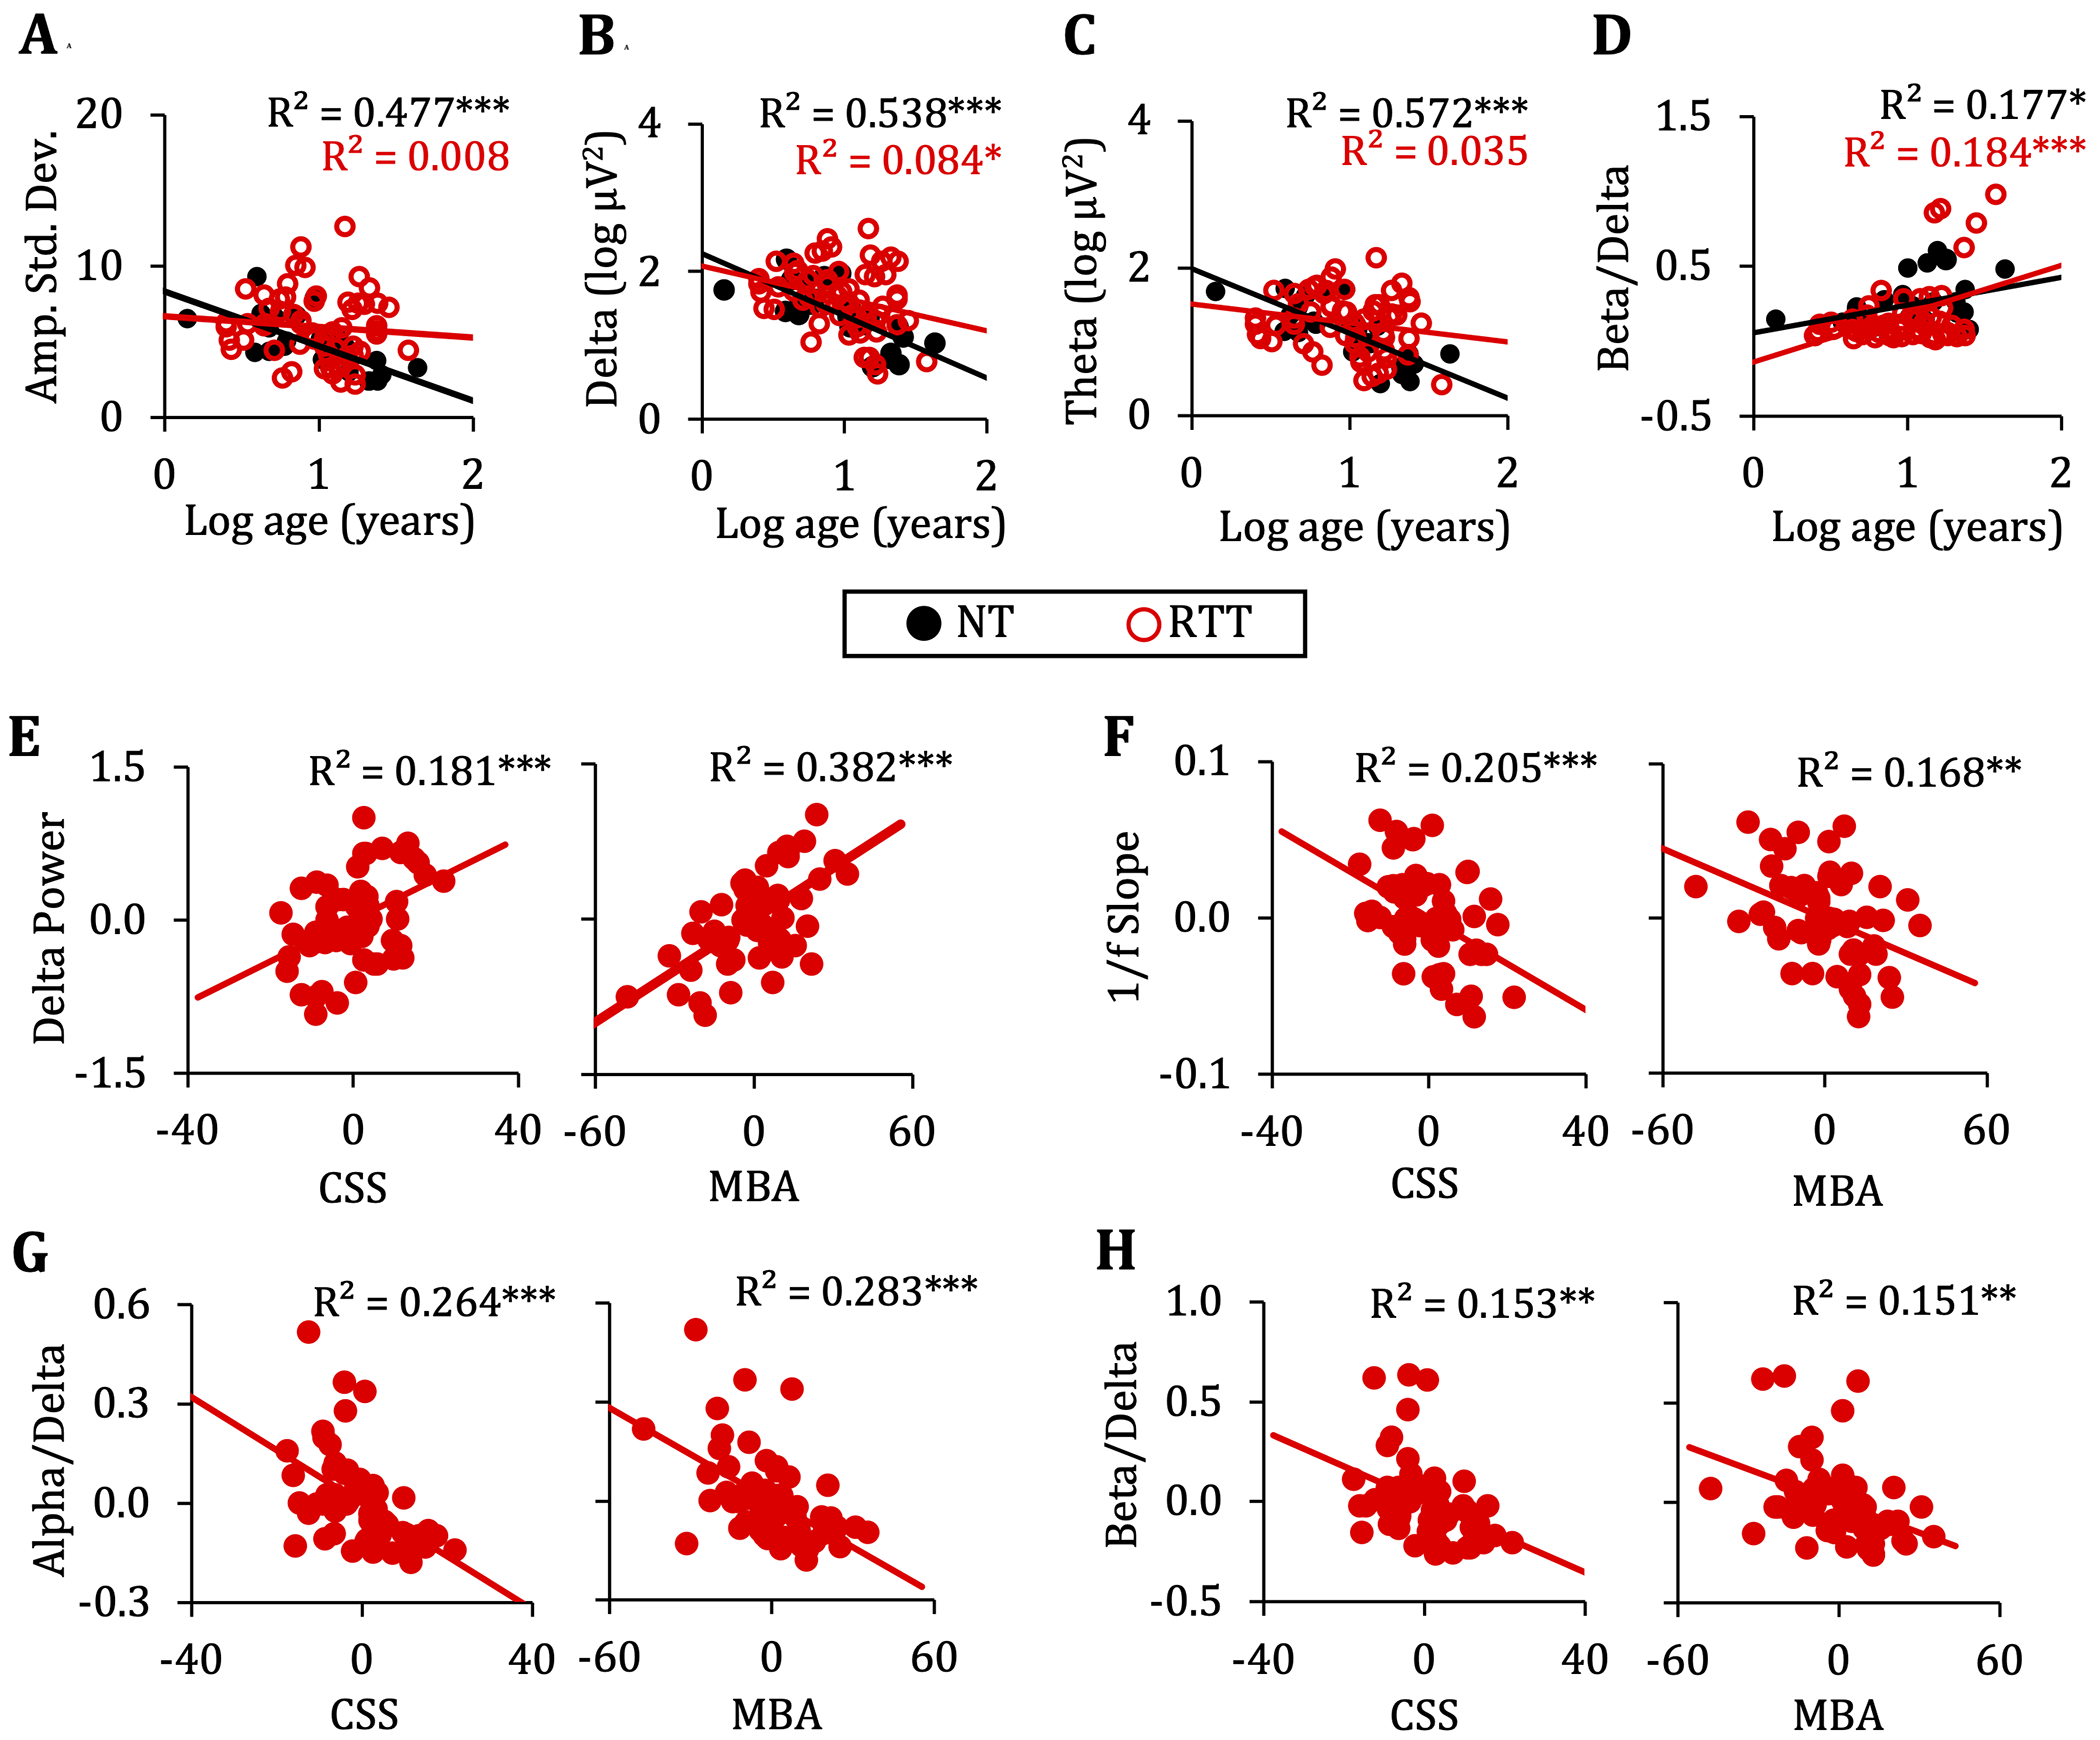
Methods: EEG amplitude and power features were derived from the resting EEG of 60 females with RTT (median age = 10.7 years) and 26 neurotypical females (median age = 10.6 years). Analyses focus on group differences and within the RTT group, associations between the EEG parameters and clinical severity. For a subset of participants (n = 20), follow-up data were available for assessing the reproducibility of the results and the stability in the parameters over 1 year.

Results: Compared to neurotypical participants, participants with RTT had greater amplitude variability and greater low-frequency activity as reflected by greater delta power, more negative 1/f slope, and lower theta/delta, alpha/delta, beta/delta, alpha/theta, and beta/theta ratios. Greater delta power, more negative 1/f slope, and lower power ratios were associated with greater severity. Analyses of year 1 data replicated the associations between 1/f slope and power ratios and clinical severity and demonstrated good within-subject consistency in these measures.

Interpretation: Overall, group comparisons reflected a greater predominance of lower versus higher frequency activity in participants with RTT, which is consistent with prior clinical interpretations of resting EEG in this population. The observed associations between the EEG power measures and clinical assessments and the repeatability of these measures underscore the potential for EEG to provide an objective measure of cortical function and clinical severity for RTT. ANN NEUROL 2024;96:175-186.


Conflict of interest statement

Potential Conflicts of Interest

Nothing to report.

Figures

Fig. 1.
Fig. 1.. Comparison of EEG parameters in NT and RTT participants.
Box plots illustrating greater amplitude standard deviation (A), greater amplitude kurtosis (B), and more negative 1/f slopes (C) in RTT (shown in red) compared to NT (shown in black) participants. (D) Power spectral density plot highlighting greater delta power and more negative 1/f slopes in RTT vs. NT participants. Shaded lines represent standard error. Box plots illustrating greater delta power (E) and lower theta/delta, alpha/delta, beta/delta, alpha/theta ratios (F) in RTT compared to NT participants. Statistical analyses were performed using Mann–Whitney U-tests. (***p<0.001, **p<0.01, *p<0.05).
Fig. 2.
Fig. 2.. Comparison of regional EEG power parameters in NT and RTT groups.
Topographical maps of EEG power for NT and RTT participants within delta, theta, alpha, and beta frequency bands (A). Box plots showing group differences in power for each frequency band for NT (shown in black) and RTT (shown in red) participants across each ROI (B). Compared to NT participants, participants with RTT had significantly higher delta power within frontal and temporal ROIs and lower alpha power in parietal and occipital ROIs. Box plots showing group differences in select power ratios for NT (shown in black) and RTT (shown in red) participants across each ROI (C). Group differences in power ratios across were observed across multiple ROIs. Alpha/delta and alpha/theta were significant across all regions. Comparisons were performed using Mann–Whitney U-tests. (***p<0.001, **p<0.01, *p<0.05).
Fig. 3.
Fig. 3.. Associations of EEG parameters with age and clinical severity.
(A-D) Scatterplots illustrating association between age and select EEG parameters for NT (shown in black) and RTT (shown in red) participants. (E-H) Scatterplots showing the associations between the clinical severity measures (CSS & MBA) and delta power (E), 1/f slope (F), alpha/delta ratio (G), and beta/delta ratio (H) for participants with RTT. Data for E-H is presented as partial plots showing the association between the EEG parameter and the clinical measure after accounting for the effect of age on the EEG parameter. (***p<0.001, **p<0.01, *p<0.05).
Fig. 4.
Fig. 4.. Heat map of standardized regression coefficients (β) from regression analyses for regional EEG parameters and clinical severity.
For each severity measure (CSS and MBA), data is presented for global computations and computations within each ROI. An adjusted p value of p<0.01 was used to account for comparisons across five brain regions. Darker colors indicate stronger associations. (**p<0.001, *p<0.01).
Fig. 5.
Fig. 5.. Group differences in EEG power parameters based on core clinical feature.
Box plots showing reduced theta/delta, alpha/delta, and beta/delta power ratios in participants unable to walk (shown in gray) compared to participants able to walk (shown in black) (A). Box plots showing greater delta power in participants unable to walk (gray) compared to participants able to walk (black) (B). Box plots showing reduced alpha/delta and beta/delta power ratios in participants with no functional hand use (gray) compared to participants with conserved or partially conserved hand use (black) (C). (***p<0.001, **p<0.01, *p<0.05).
Fig. 6.
Fig. 6.. Results from analysis of Year 1 EEG.
(A-C) Scatterplots illustrating the associations between clinical severity measures (CSS & MBA) and beta/delta ratio (A), 1/f slope (B), and alpha/delta ratio (C) at Year 1 (Y1). Data is presented as partial plots illustrating the association between the EEG parameter and CSS or MBA after accounting for the effect of age on the EEG parameter (*p<0.05). Intraclass correlation coefficients (ICC) for clinical measures (CSS/MBA) (D), EEG power parameters (E) and power ratios (F) between Baseline and Year 1. Error bars represent 95% confidence interval. Difference plots illustrating change in clinical measures and power parameters from Baseline to Year 1 for all participants with Year 1 data (n=20) (H).

References

    1. Amir RE, Van den Veyver IB, Wan M, Tran CQ, Francke U, Zoghbi HY. Rett syndrome is caused by mutations in X-linked MECP2, encoding methyl-CpG-binding protein 2. Nat Genet. Oct 1999;23(2):185–8. doi:10.1038/13810 - DOI - PubMed
    1. Neul JL, Kaufmann WE, Glaze DG, et al. Rett syndrome: revised diagnostic criteria and nomenclature. Ann Neurol. Dec 2010;68(6):944–50. doi:10.1002/ana.22124 - DOI - PMC - PubMed
    1. Glaze DG, Percy AK, Skinner S, et al. Epilepsy and the natural history of Rett syndrome. Neurology. Mar 16 2010;74(11):909–12. doi:10.1212/WNL.0b013e3181d6b852 - DOI - PMC - PubMed
    1. Percy AK, Neul JL, Glaze DG, et al. Rett syndrome diagnostic criteria: lessons from the Natural History Study. Ann Neurol. Dec 2010;68(6):951–5. doi:10.1002/ana.22154 - DOI - PMC - PubMed
    1. Guy J, Gan J, Selfridge J, Cobb S, Bird A. Reversal of neurological defects in a mouse model of Rett syndrome. Science. Feb 23 2007;315(5815):1143–7. doi:10.1126/science.1138389 - DOI - PMC - PubMed