. 2024 Jun 12;15(6):e0067624.
doi: 10.1128/mbio.00676-24. Epub 2024 May 9.

A human papillomavirus 16 E2-TopBP1 dependent SIRT1-p300 acetylation switch regulates mitotic viral and human protein levels and activates the DNA damage response

Affiliations

A human papillomavirus 16 E2-TopBP1 dependent SIRT1-p300 acetylation switch regulates mitotic viral and human protein levels and activates the DNA damage response

Apurva T Prabhakar et al. mBio. .

Abstract

An interaction between human papillomavirus 16 (HPV16) E2 and the cellular proteins TopBP1 and BRD4 is required for E2 plasmid segregation function. The E2-TopBP1 interaction promotes increased mitotic E2 protein levels in U2OS and N/Tert-1 cells, as well as in human foreskin keratinocytes immortalized by HPV16 (HFK + HPV16). SIRT1 deacetylation reduces E2 protein stability and here we demonstrate that increased E2 acetylation occurs during mitosis in a TopBP1 interacting-dependent manner, promoting E2 mitotic stabilization. p300 mediates E2 acetylation and acetylation is increased due to E2 switching off SIRT1 function during mitosis in a TopBP1 interacting-dependent manner, confirmed by increased p53 stability and acetylation on lysine 382, a known target for SIRT1 deacetylation. SIRT1 can complex with E2 in growing cells but is unable to do so during mitosis due to the E2-TopBP1 interaction; SIRT1 is also unable to complex with p53 in mitotic E2 wild-type cells but can complex with p53 outside of mitosis. E2 lysines 111 and 112 are highly conserved residues across all E2 proteins and we demonstrate that K111 hyper-acetylation occurs during mitosis, promoting E2 interaction with Topoisomerase 1 (Top1). We demonstrate that K112 ubiquitination promotes E2 proteasomal degradation during mitosis. E2-TopBP1 interaction promotes mitotic acetylation of CHK2, promoting phosphorylation and activation of the DNA damage response (DDR). The results present a new model in which the E2-TopBP1 complex inactivates SIRT1 during mitosis, and activates the DDR. This is a novel mechanism of HPV16 activation of the DDR, a requirement for the viral life cycle.

Importance: Human papillomaviruses (HPVs) are causative agents in around 5% of all human cancers. While there are prophylactic vaccines that will significantly alleviate HPV disease burden on future generations, there are currently no anti-viral strategies available for the treatment of HPV cancers. To generate such reagents, we must understand more about the HPV life cycle, and in particular about viral-host interactions. Here, we describe a novel mitotic complex generated by the HPV16 E2 protein interacting with the host protein TopBP1 that controls the function of the deacetylase SIRT1. The E2-TopBP1 interaction disrupts SIRT1 function during mitosis in order to enhance acetylation and stability of viral and host proteins. We also demonstrate that the E2-TopBP1 interaction activates the DDR. This novel complex is essential for the HPV16 life cycle and represents a novel anti-viral therapeutic target.

Keywords: E2; SIRT1; TopBP1; acetylation; cervical cancer; chromosome segregation; head and neck cancer; mitosis; p300; papillomavirus; switch.


Conflict of interest statement

The authors declare no conflict of interest.

Figures
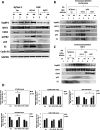
Fig 1
Fig 1
(A) Increased expression of E2, TopBP1, and p53 in mitotic enriched HFK + HPV16 cells. A. N/Tert-1 (lanes 1 and 2), HFK + HPV16 (lanes 3 and 4), and HFK + E6/E7 (lanes 5 and 6) were arrested by double thymidine block (DTB) (lanes 1, 3, and 5) and released for 16 h (N/Tert1, lane 2) or 19 h (HFK + HPV16 and HFK + E6/E7, lanes 4 and 6, respectively) to enrich for mitotic cells (confirmed by enhanced expression of cyclin B1). Western blotting demonstrated the expression of the indicated proteins. (B) The extracts in panel A were immunoprecipitated with an acetyl-lysine antibody (lanes 2–7) or an HA control antibody with HFK + HPV16 extract (lane 1). Western blotting demonstrated the level of acetyl-lysine pull-down of the indicated proteins. (C) The extracts in panel A were immunoprecipitated with a SIRT1 antibody (lanes 2–7) or an HA control antibody with HFK + HPV16 extract (lane 1). Western blotting demonstrated the level of SIRT1 pull-down of the indicated proteins. (D) RNA levels of the indicated genes were determined in DTB-arrested and mitotic-enriched cells. Significant changes are indicated with *, P value < 0.05.
Fig 2
Fig 2
An E2-TopBP1 interaction is required to turn-off SIRT1 function and increase acetylation during mitosis. (A) N/Tert-1 Vec (pcDNA vector control) (lanes 1 and 2), N/Tert-1 E2-WT (lanes 3 and 4), and N/Tert-1 E2-S23A (TopBP1 binding interacting mutant, lanes 5 and 6) were DTB (lanes 1, 3, and 5) and released for 16 h to enrich for mitotic cells (lanes 2, 4, and 6). Western blotting demonstrated the expression of the indicated proteins. Please note that the results are presented from two different blots, separated by the lane numbers. Therefore, there are two GAPDH control lanes. (B) The extracts in panel A were immunoprecipitated with an acetyl-lysine antibody (lanes 2–6) or an HA control antibody with E2-WT extracts (lane 1). Western blotting demonstrated the level of acetyl-lysine pull-down of the indicated proteins. (C) The extracts in panel A were immunoprecipitated with a SIRT1 antibody (lanes 2–7) or an HA control antibody with HFK + HPV16 extract (lane 1). Western blotting demonstrated the level of SIRT1 pull-down of the indicated proteins. Panels D–F represent a repeat of panels A–C in U2OS cells.
Fig 3
Fig 3
E2 lysine 111 (K111) and 112 (K112) regulate E2 stability during mitosis. (A) N/Tert-1 cells stably expressing the E2 proteins indicated were generated. (B) Cell lines were DTB treated (lanes 1, 3, 5, 7, 9, 11, 13, and 15) or DTB and released for 16 h to enrich for mitotic cells (lanes 2, 4, 6, 8, 10, 12, 14, and 16). Western blotting demonstrated the expression of the indicated proteins. (C) The extracts in panel B were immunoprecipitated with a TopBP1 antibody (lanes 2–9 and 11–18) or an HA control antibody with E2-WT extracts (lanes 1 and 10). Western blotting demonstrated the level of TopBP1 pull-down of the indicated proteins. (D) The extracts in panel B were immunoprecipitated with an acetyl-lysine antibody (lanes 2–9 and 11–18) or an HA control antibody with E2-WT extracts (lanes 1 and 10). Western blotting demonstrated the level of acetyl-lysine pull-down of the indicated proteins. (E) The extracts in panel B were immunoprecipitated with a Top1 antibody (lanes 2–9 and 11–18) or an HA control antibody with E2-WT extracts (lanes 1 and 10). Western blotting demonstrated the level of Top1 pull-down of the indicated proteins. (F) The indicated cell lines were DTB treated (lanes 1, 5, 9, and 13) or released for 16 h to enrich for mitotic cells (lanes 2, 6, 10, and 14). MG132 was added at 15 h (lanes 3, 4, 7, 8, 11, 12, 15, and 16) following DTB released and harvested either 1 h (lanes 3, 7, 11, and 15) or 3 h (lanes 4, 8, 12, and 16) later. Western blotting demonstrated the level of the indicated proteins. (G) The 16-h release samples from F + or – MG132 were tested for E2 ability to be ubiquitinated using a ubiquitin trap (see Materials and Methods).
Fig 4
Fig 4
Aberrant interaction of E2 lysine mutants with mitotic chromatin. (A) U2OS cells stably expressing the indicated E2 proteins were generated. Western blotting demonstrated the expression of the indicated proteins. (B) Cells were grown and fixed without enrichment for mitotic cells. Random mitotic cells are indicated with white arrows and E2 (green) and TopBP1 (red) staining carried out. (C) The number of mitotic bodies that retained E2 or TopBP1 expression was determined using a Keyence imaging system. (D) The Keyence system also determined the nuclear/cytosolic localization of the indicated E2 proteins. (E) The E2 K111Q mutant complexed with mitotic chromatin but removed TopBP1 generating chromatin bridges (quantitated in panel F). Significant changes are indicated with *, P value < 0.05.
Fig 5
Fig 5
p300 enhances E2 and TopBP1 acetylation in mitosis in N/Tert-1 cells. (A) N/Tert-1 Vec (lanes 1, 2, 5, and 6) and N/Tert-1 E2-WT (lanes 3, 4, 7, and 8) were DTB treated (lanes 1, 3, 5, and 7) or released for 16 h to enrich for mitotic cells (lanes 2, 4, 6, and 8). Cells were treated with control siRNA (lanes 1–4) or siRNA targeting p300 (lanes 5–8). Western blotting demonstrated the expression of the indicated proteins. (B) The extracts in panel A were immunoprecipitated with an acetyl-lysine antibody (lanes 2–9) or an HA control antibody with E2-WT extracts (lane 1). Western blotting demonstrated the level of acetyl-lysine pull-down of the indicated proteins.
Fig 6
Fig 6
p300 enhances E2 and TopBP1 acetylation in mitosis in HFK + HPV16 cells. (A) N/Tert-1 Vec (lanes 1, 2, 5, and 6) and HFK + HPV16 (lanes 3, 4, 7, and 8) were DTB treated (lanes 1, 3, 5, and 7) or released for 16 h (lanes 2 and 6) or 19 h (lanes 4 and 8) to enrich for mitotic cells. Cells were treated with control siRNA (lanes 1–4) or siRNA targeting p300 (lanes 5–8). Western blotting demonstrated the expression of the indicated proteins. (B) The extracts in (A) were immunoprecipitated with an acetyl-lysine antibody (lanes 2–9) or an HA control antibody with HFK + HPV16 extracts (lane 1). Western blotting demonstrated the level of acetyl-lysine pull-down of the indicated proteins. (C) Growing N/Tert-1+Vec and HFK + HPV16 cells were stained with the indicated antibodies and DAPI. Mitotic cells are highlighted by the white arrows.
Fig 7
Fig 7
The E2-TopBP1 interaction induces a global mitotic activation of the DDR. (A and B) The indicated protein extracts were western blotted with pS-T/Q (top panels) and GAPDH (bottom panels).
Fig 8
Fig 8
A model explaining the regulation of E2 stability during mitosis. See text for details.

Update of

References

    1. Doorbar J, Quint W, Banks L, Bravo IG, Stoler M, Broker TR, Stanley MA. 2012. The biology and life-cycle of human papillomaviruses. Vaccine 30 Suppl 5:F55–70. doi:10.1016/j.vaccine.2012.06.083 - DOI - PubMed
    1. zur Hausen H. 2009. Papillomaviruses in the causation of human cancers - a brief historical account. Virology 384:260–265. doi:10.1016/j.virol.2008.11.046 - DOI - PubMed
    1. Galloway DA, Laimins LA. 2015. Human papillomaviruses: shared and distinct pathways for pathogenesis. Curr Opin Virol 14:87–92. doi:10.1016/j.coviro.2015.09.001 - DOI - PMC - PubMed
    1. Hoppe-Seyler K, Bossler F, Braun JA, Herrmann AL, Hoppe-Seyler F. 2018. The HPV E6/E7 oncogenes: Key factors for viral carcinogenesis and therapeutic targets. Trends Microbiol 26:158–168. doi:10.1016/j.tim.2017.07.007 - DOI - PubMed
    1. McBride AA. 2013. The papillomavirus E2 proteins. Virology 445:57–79. doi:10.1016/j.virol.2013.06.006 - DOI - PMC - PubMed

MeSH terms

LinkOut - more resources