. 2024 Jul 1;223(7):e202308003.
doi: 10.1083/jcb.202308003. Epub 2024 May 9.

HERC3 facilitates ERAD of select membrane proteins by recognizing membrane-spanning domains

Affiliations

HERC3 facilitates ERAD of select membrane proteins by recognizing membrane-spanning domains

Yuka Kamada et al. J Cell Biol. .

Abstract

Aberrant proteins located in the endoplasmic reticulum (ER) undergo rapid ubiquitination by multiple ubiquitin (Ub) E3 ligases and are retrotranslocated to the cytosol as part of the ER-associated degradation (ERAD). Despite several ERAD branches involving different Ub E3 ligases, the molecular machinery responsible for these ERAD branches in mammalian cells remains not fully understood. Through a series of multiplex knockdown/knockout experiments with real-time kinetic measurements, we demonstrate that HERC3 operates independently of the ER-embedded ubiquitin ligases RNF5 and RNF185 (RNF5/185) to mediate the retrotranslocation and ERAD of misfolded CFTR. While RNF5/185 participates in the ERAD process of both misfolded ABCB1 and CFTR, HERC3 uniquely promotes CFTR ERAD. In vitro assay revealed that HERC3 directly interacts with the exposed membrane-spanning domains (MSDs) of CFTR but not with the MSDs embedded in liposomes. Therefore, HERC3 could play a role in the quality control of MSDs in the cytoplasm and might be crucial for the ERAD pathway of select membrane proteins.


Conflict of interest statement

Disclosures: The authors declare no competing interests exist.

Figures

Figure 1.
Figure 1.
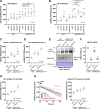
HERC3 participates in the ubiquitination and ERAD of ∆F508-CFTR. (A) The PM density of r∆F508-CFTR-HRP in CFBE Teton cells transfected with 50 nM siNT or siHERC3, as indicated (n = 9–12). Each independent experiment, consisting of three to four biological replicates (n), is color-coded. (B) Quantitative PCR analysis assessed HERC3 KD efficiency in CFBE Teton ∆F508-CFTR-HRP cells (n = 3). Each biological replicate (n) is color-coded: the averages from three technical replicates are shown in triangles. (C) The channel function of r∆F508-CFTR-3HA in CFBE Teton cells transfected with 50 nM siNT or siHERC3 pool was measured by YFP quenching assay. The initial YFP quenching rate was quantified as the CFTR function (right, n = 19). Each independent experiment, consisting of four to eight biological replicates (n), is color-coded. (D) Western blotting analyzed steady-state levels of ∆F508-CFTR-3HA with (r∆F508) or without 26°C rescue (∆F508) in CFBE Teton cells transfected with 50 nM siNT or siHERC3 pool. Na+/K+ ATPase (ATPase) was used as a loading control. B, immature form; C, mature form. Western blotting also confirmed HERC3 KD in CFBE Teton ΔF508-CFTR-3HA cells. Ponceau staining was used as a loading control. A filled triangle indicates HERC3. (E) Cellular ∆F508-CFTR-3HA stability in CFBE Teton cells transfected with 50 nM siNT or siHERC3 pool was measured by cell-based ELISA using an anti-HA antibody after CHX treatment (n = 12). (F) The PM stability of r∆F508-CFTR-3HA in CFBE cells transfected with 50 nM siNT, siRFFL pool, or siHERC3 pool was measured by PM ELISA (n = 12 biological replicates). (G) Ubiquitination levels of HBH-∆F508-CFTR-3HA in CFBE Teton cells were measured by Neutravidin (NA) pull-down under denaturing conditions (NA pull-down) and Western blotting. The CFTR ubiquitination level was quantified by densitometry and normalized to CFTR in precipitates (right, n = 4). (H) A schematic diagram of the HERC3 domain composition with the residue numbers at the domain boundaries. HERC3 mutants used in this study are also shown. (I) The effects of overexpressed Myc-HERC3 variants on the steady-state level of ∆F508-CFTR-3HA were analyzed by Western blotting in co-transfected COS-7 cells. The immature ∆F508-CFTR (B band) was quantified by densitometry (right, n = 4). (J) The interaction of Myc-HERC3 variants with HBH-∆F508-CFTR-3HA in BHK cells was analyzed by NA pull-down and Western blotting. ∆F508-CFTR was rescued at 26°C incubation for 2 days, followed by a 1-h incubation at 37°C (A–D and F). Statistical significance was assessed by one-way ANOVA (A), or one-way repeated-measures (RM) ANOVA (B and I) with Dunnett’s multiple comparison tests, a two-tailed unpaired (C), or paired Student’s t test (G), or two-way ANOVA (E and F). Data distribution was assumed to be normal but was not formally tested. Data represent mean ± SD. *P < 0.05, **P < 0.01, ***P < 0.001, ****P < 0.0001, ns, not significant. Source data are available for this figure: SourceData F1.
Figure 2.
Figure 2.
HERC3 and RNF5/185 additively reduce ∆F508-CFTR. (A and B) The cellular level of ∆F508-CFTR-3HA (A, n = 10) and PM level of r∆F508-CFTR-HRP (B, n = 8) in CFBE Teton cells transfected with 50 nM siRNA indicated was measured by cell-based ELISA using an anti-HA antibody and HRP assay, respectively. (C and D) The cellular level of ∆F508-CFTR-3HA (C, n = 15) and PM levels of r∆F508-CFTR-HRP induced by 26°C rescue (D, n = 8) in CFBE Teton cells transfected with 50 nM siRNA were measured by ELISA using an anti-HA antibody (C) and HRP assay (D), respectively. (E and F) Western blotting analyzed steady-state levels of r∆F508-CFTR-3HA in CFBE Teton cells transfected with 50 nM siRNA indicated (E). Ponceau staining was used as a loading control. B, immature form; C, mature form. The anti-RNF185 antibody detected both RNF5 and RNF185 because of the cross-reactivity. HERC3 KD was confirmed by quantitative PCR (F, n = 3). Each biological replicate (n) is color-coded: the averages from three technical replicates are shown in triangles. (G) The PM levels of r∆F508-CFTR-HRP induced by 3 µM VX-809 treatment at 37°C for 24 h in CFBE Teton cells transfected with 50 nM siRNA indicated (n = 8). (H) Representative traces (left) of the YFP fluorescence and quantification of the initial YFP quenching rate (right, n = 12) as a measure of rΔF508-CFTR function in CFBE cells transfected with 50 nM siRNA, as indicated. Each independent experiment consisting of 4 (B, D, and G), 5 (A and C), or 6 (H) biological replicates (n) is color-coded. Statistical significance was assessed by one-way RM ANOVA with Dunnett’s multiple comparison tests (F) or two-way ANOVA with Holm–Sidak multiple comparison tests, which revealed a significant main effect of HERC3 KD or RNF5/185 DKD, but no interaction between them (Pint > 0.05, C, D, and H) except for G (Pint = 0.012). Data distribution was assumed to be normal but was not formally tested. Data represent mean ± SD. **P < 0.01, ***P < 0.001, ****P < 0.0001, ns, not significant. Source data are available for this figure: SourceData F2.
Figure 3.
Figure 3.
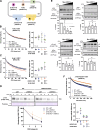
HERC3 and RNF5/185 additively facilitate ∆F508-CFTR ERAD. (A) A schematic diagram of the HiBiT degradation assay, where ∆F508-CFTR-HiBiT(CT) and cytosolic LgBiT were co-expressed. The luminescence signal generated by the interaction of the HiBiT tag and LgBiT was measured in living cells. (B) A typical measurement of ∆F508-CFTR-HiBiT(CT) ERAD in 293MSR cells. The luminescence signal during the CHX chase was measured as the remaining ∆F508-CFTR during the CHX chase, with or without 10 µM MG-132. (C) The metabolic stability of ∆F508-CFTR-HiBiT(CT) was assessed through a CHX chase at 37°C, followed by Western blotting using an anti-HiBiT antibody in 293MSR cells (n = 2). The remaining ∆F508-CFTR was expressed as a percentage of time 0, and one-phase exponential decay curves were fitted. (D) Western blotting confirmed the ablation of RNF5, and RNF185 in the WT and RNF5/185 DKO 293MSR cells transfected with siRNA indicated. Ponceau staining was used as a loading control. (E) HERC3 KD in 293MSR WT and RNF5/185 DKO cells was confirmed through quantitative PCR (n = 3). (F) Kinetic degradation of ∆F508-CFTR-HiBiT(CT) in 293MSR WT and RNF5/185 KO cells transfected with 50 nM siNT or siHERC3. Luminescence was continuously monitored over 180 min in the presence of CHX and plotted normalized to the non-treated cells. The ERAD rate of ∆F508-CFTR-HiBiT(CT) was calculated by fitting the initial degradation portion of each kinetic degradation curve (right, n = 3). (G–I) Kinetic degradation of ∆F508-CFTR-Nluc(CT) in 293MSR (G, n = 4), BEAS-2B (H, n = 3), and CFBE (I, n = 12) cells transfected with 50 nM siRNA as indicated. The ERAD rate of ∆F508-CFTR-Nluc(CT) was calculated as F. Each biological replicate (n) is color-coded: the averages from three to four technical replicates are shown in triangles (E–H). Statistical significance was assessed by one-way RM ANOVA with Dunnett’s multiple comparison tests (E) or two-way RM ANOVA which revealed a significant main effect of HERC3 or RNF5/185 ablation, but no interaction between them (F–I, Pint> 0.05). Data distribution was assumed to be normal but was not formally tested. Data represent mean ± SD. *P < 0.05, **P < 0.01, ***P < 0.001, ****P < 0.0001, ns, not significant. Source data are available for this figure: SourceData F3.
Figure S1.
Figure S1.
Establishment of RNF5/185 DKO 293MSR cells. (A and B) Schematic representation of the RNF5 (A) and RNF185 (B) -targeting gRNA sequences. Arrows indicate primer positions. PAM, protospacer adjacent motif. The locations of each start codon, stop codon and the catalytic cysteine residues of RNF5 (C42) and RNF185 (C39, C42) are also indicated. The sequences analyzed for each KO cell line are shown along with the deleted sequences.
Figure 4.
Figure 4.
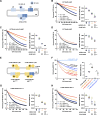
HERC3 and RNF5/185 facilitate ∆F508-CFTR retrotranslocation. (A) A schematic diagram of the HiBiT retrotranslocation assay, where ∆F508-CFTR-HiBiT(Ex) and cytosolic LgBiT were co-expressed. The luminescence signal generated by the interaction of LgBiT and the HiBiT tag exposed in the cytosol after retrotranslocation was measured in living cells during MG-132 treatment. (B) A typical measurement of ∆F508-CFTR-HiBiT(Ex) retrotranslocation in 293MSR cells. The luminescence signal was measured in living cells upon treatment with 10 µM MG-132, with or without 10 µM DBeQ. (C) Kinetic retrotranslocation of ∆F508-CFTR-HiBiT(Ex) in 293MSR cells treated with DMSO (0.3%) or Trikafta (3 µM VX-661, 3 µM VX-445, 1 µM VX-770) for 24 h at 37°C. Luminescence was continuously monitored in the presence of MG-132 with or without CHX. The signal increased by the MG-132 treatment was plotted as retrotranslocated CFTR. The retrotranslocation rate of ∆F508-CFTR-HiBiT(Ex) was calculated by linear fitting of the signal until 60 min (right, n = 4). Two-way RM ANOVA revealed a significant main effect of Trikafta or CHX, but no interaction between them (Pint > 0.05). (D) Kinetic retrotranslocation of ∆F508-CFTR-HiBiT(Ex) in 293MSR WT and RNF5/185 KO cells transfected with 50 nM siNT or siHERC3. Luminescence was continuously monitored over 60 min in the presence of MG-132. The signal increased by the MG-132 treatment was plotted as retrotranslocated CFTR. The retrotranslocation rate of ∆F508-CFTR-HiBiT(Ex) was calculated by linear fitting (right, n = 3). Two-way RM ANOVA revealed a significant main effect of HERC3 KD or RNF5/185 DKO, but no interaction between them (Pint > 0.05). (E) A schematic diagram of the HiBiT ER disappearance assay, where ∆F508-CFTR-HiBiT(Ex) and ER-luminal LgBiT (ER LgBiT) were coexpressed. The luminescence signal generated by the interaction of LgBiT and the HiBiT tag in the ER was measured in living cells during the CHX chase. (F) Kinetic ER disappearance of ∆F508-CFTR-HiBiT(Ex) in 293MSR WT and RNF5/185 KO cells transfected with 50 nM siNT or siHERC3. Luminescence was continuously monitored over 180 min in the presence of CHX and plotted normalized to the non-treated cells as remaining CFTR at the ER (%). The ER disappearance rate of ∆F508-CFTR-HiBiT(Ex) was calculated by fitting the kinetic ER disappearance curve (right, n = 3). Two-way RM ANOVA with Holm–Sidak multiple comparison tests revealed a significant main effect of RNF5/185 DKO and no interaction between HERC3 KD and RNF5/185 DKO (Pint > 0.05). Data distribution was assumed to be normal but was not formally tested. Each biological replicate (n) is color-coded: the averages from three or four technical replicates are shown in triangles (D and F). Data represent mean ± SD. *P < 0.05, **P < 0.01, ***P < 0.001, ****P < 0.0001, ns, not significant.
Figure S2.
Figure S2.
A representative luminescence trace from the ∆F508-CFTR-HiBiT(Ex) retrotranslocation assay. 293MSR cells were transiently transfected with LgBiT, with or without ∆F508-CFTR-HiBiT(Ex), followed by Endurazine loading. Luminescence was continuously monitored in live cells during treatment with or without 10 µM MG-132. This figure is associated with Fig. 4 B.
Figure S3.
Figure S3.
The correlation analysis. (A) The relationship between CFTR ERAD (Fig. 3 F) and the retrotranslocation rates of ∆F508-CFTR (Fig. 4 D) was analyzed for correlation. (B) Correlation analysis was performed to examine the connection between CFTR ER disappearance (Fig. 4 F) and the retrotranslocation rates of ∆F508-CFTR (Fig. 4 D). (C) The correlation between CFTR K48-linked polyubiquitination (Fig. 5 B) and K63-linked polyubiquitination (Fig. 5 C). (D) The correlation between CFTR K48-linked polyubiquitination (Fig. 5 B) and the ERAD rate (Fig. 3 F). (E) The correlation between CFTR K63-linked polyubiquitination (Fig. 5 C) and the ERAD rate (Fig. 3 F). (F) The correlation between CFTR K48-linked polyubiquitination (Fig. 5 B) and the retrotranslocation rate of ∆F508-CFTR (Fig. 4 D). (G) The correlation between CFTR K63-linked polyubiquitination (Fig. 5 C) and the retrotranslocation rate of ∆F508-CFTR (Fig. 4 D). (H) The correlation between the CFTR K48-linked polyubiquitination (Fig. 5 B) and UBQLN2 binding (Fig. 6 D). (I) The correlation between the CFTR K63-linked polyubiquitination (Fig. 5 C) and UBQLN2 binding (Fig. 6 D). (J) The correlation between the CFTR ERAD (Fig. 3 F) and UBQLN2 binding (Fig. 6 D). (K) The correlation between the retrotranslocation (Fig. 4 D) and UBQLN2 binding (Fig. 6 D).
Figure 5.
Figure 5.
HERC3 and RNF5/185 facilitate ∆F508-CFTR ubiquitination. (A) Ubiquitination levels of HBH-∆F508-CFTR-3HA in 293MSR WT and RNF5/185 DKO cells were measured by Neutravidin pull-down under denaturing conditions (NA pull-down) and Western blotting. The CFTR ubiquitination level was quantified by densitometry and normalized to CFTR in precipitates (right, n = 3). Two-way RM ANOVA revealed a significant main effect of RNF5/185 DKO and no interaction between HERC3 KD and RNF5/185 DKO (Pint > 0.05). (B and C) K48 (B, n = 3) and K63-linked polyubiquitination (C, n = 3) of HBH-∆F508-CFTR in 293MSR WT and RNF5/185 DKO cells transfected with 50 nM siNT or siHERC3 were quantified by Ub ELISA using Ub linkage-specific antibodies. 10 µM MG-132 was treated for 3 h at 37°C. The ubiquitination level was normalized by the CFTR amount quantitated by ELISA using an anti-HA antibody. Two-way RM ANOVA revealed significant main effects of HERC3 KD or RNF5/185 DKO and a significant interaction between them in H, but not in G (Pint > 0.05). (D) The effect of HERC3 KD on K48 and K63-linked poly-ubiquitination of HBH-∆F508-CFTR in RNF5/185 DKO cells was measured by Ub ELISA using higher amounts of cell lysate. Statistical significance was assessed by a two-tailed paired t test (n = 3). Each biological replicate (n) is color-coded: the averages from three or four technical replicates are shown in triangles (B–D). Data distribution was assumed to be normal but was not formally tested. Data represent mean ± SD. *P < 0.05, **P < 0.01, ***P < 0.001, ****P < 0.0001, ns, not significant. Source data are available for this figure: SourceData F5.
Figure 6.
Figure 6.
HERC3 facilitates ∆F508-CFTR interaction with UBQLN2. (A) Western blotting showed the steady-state level of ΔF508-CFTR-3HA under OE of FLAG-UBQLN1 or FLAG-UBQLN2 in transiently coexpressed COS-7 cells. The CFTR level was quantified by densitometry (right, n = 4). Na+/K+ ATPase (ATPase) was used as a loading control. B, immature form. (B) The interaction between FLAG-UBQLN2 and HBH-∆F508-CFTR-3HA in BHK cells transfected with or without Myc-HERC3 was assessed using NA pull-down and Western blotting. The amount of UBQLN2 bound to HBH-∆F508-CFTR-3HA was quantified by densitometry and normalized to CFTR levels in the precipitates (right, n = 3). (C) The effect of Myc-HERC3 OE on the FLAG-UBQLN2 and HBH-∆F508-CFTR-3HA interaction in 293MSR WT cells was measured by ELISA using an anti-FLAG antibody. The level of FLAG-UBQLN2 binding was normalized to the CFTR level, which was measured by ELISA using an anti-HA antibody (n = 5). (D and E) The interaction between FLAG-UBQLN2 and HBH-∆F508-CFTR-3HA in 293MSR WT and RNF5/185 DKO cells transfected with 50 nM siNT or siHERC3 was measured by ELISA as C (D, n = 4). Additionally, under conditions of increased FLAG-UBQLN2 expression, the UBQLN2 binding to HBH-∆F508-CFTR-3HA in RNF5/185 DKO cells was quantified by ELISA (E, n = 3). (F) The association of HBH-∆F508-CFTR with endogenous UBQLN2 in 293MSR WT or RNF5/185 DKO cells transfected with 50 nM siNT or siHERC3 was analyzed by NA pull-down after DSP cross-linking. The quantities of UBQLN2 and ∆F508-CFTR in the precipitates were measured using densitometry and expressed as a percentage of the control. The quantities of CFTR-bound UBQLN2 were normalized to CFTR levels as UBQLN2/CFTR and expressed as a percentage of the control. (G) The level of endogenous UBQLN2 in the microsomes of 293MSR WT and RNF5/185 DKO cells transfected with 50 nM siNT or siHERC3 was measured. Cells were treated with or without 10 µM MG-132 for 3 h before subcellular fractionation. Microsomes enriched with ER membranes were confirmed using an anti-calnexin (CNX) antibody. The quantities of the ER-recruited UBQLN2 were quantified by subtracting the amount of UBQLN2 before MG-132 treatment from the amount after MG-132 treatment and were expressed as a percentage of the control (n = 4, right). Each biological replicate (n) is color-coded: the averages from three technical replicates are shown in triangles (C–E). Statistical significance was assessed by one-way RM ANOVA with Dunnett’s multiple comparison tests (A and C), a two-tailed paired t test (B and E), or two-way RM ANOVA (D and G). Data distribution was assumed to be normal but was not formally tested. Data represent mean ± SD. *P < 0.05, ***P < 0.001, ****P < 0.0001, ns, not significant. Source data are available for this figure: SourceData F6.
Figure S4.
Figure S4.
Effects of UBQLN single KD on the CFTR ERAD, triple KD on CFTR retrotranslocation, and establishment of TCRα-HiBiT and Insig-1-HiBiT ERAD assay. (A) The kinetic degradation of ∆F508-CFTR-HiBiT(CT) in 293MSR WT cells transfected with 50 nM siNT or siUNQLN1, 2, or 4. The ERAD rate was calculated by fitting the initial degradation portion of each kinetic degradation curve (right, n = 2). Each biological replicate (n) is color-coded: the averages from four technical replicates are shown in triangles. Data represent mean. (B) The retrotranslocation of ∆F508-CFTR-HiBiT(Ex) in 293MSR cells upon UBQLN1/2/4 triple KD was measured during the MG-132 and CHX chase (n = 3, unpaired t test). (C and D) The HiBiT degradation assay confirmed the proteasomal degradation of TCRα-HiBiT (C, n = 4) and Insig-1-HiBiT (D, n = 3) in 293MSR cells. Data represent mean ± SD. **P < 0.01.
Figure 7.
Figure 7.
UBQLN proteins facilitate ∆F508-CFTR retrotranslocation and ERAD. (A) Western blotting confirmed the triple KD of UBQLN1, 2, and 4 in 293MSR cells transfected with 50 nM siRNA as indicated. Ponceau staining was used as a loading control. (B) Kinetic degradation of ∆F508-CFTR-HiBiT(CT) in 293MSR WT cells transfected with 50 nM siNT or siUBQLN1/2/4. The ERAD rate was calculated by fitting the initial degradation portion of each kinetic degradation curve (right, n = 3). (C) Kinetic retrotranslocation of ∆F508-CFTR-HiBiT(Ex) in 293MSR cells upon UBQLN triple KD. The retrotranslocation was calculated by linear fitting (right, n = 3). (D) Kinetic ER disappearance of ∆F508-CFTR-HiBiT(Ex) in 293MSR cells upon UBQLN triple KD. The ER disappearance rate was calculated by fitting the kinetic ER disappearance curve (right, n = 3). (E) The detergent NP-40 solubility of ∆F508-CFTR-HiBiT(CT) in 293MSR cells was assessed following UBQLN1/2/4 triple KD or MG-132 treatment (10 µM, 3 h) using Western blotting with an anti-HiBiT antibody (n = 3). The soluble (100 µg) and insoluble (40 µg) fractions were analyzed. (F) The effects of overexpressed FLAG-UBQLN2 variants on the steady-state level of ∆F508-CFTR-3HA were analyzed by Western blotting in co-transfected COS-7 cells. The immature ∆F508-CFTR (B band) was quantified by densitometry (right, n = 3). A schematic diagram of the UBQLN2 domain composition with the residue numbers at the domain boundaries. UBQLN2 mutants used in this study are also shown. (G) The interaction of FLAG-UBQLN2 variants with HBH-∆F508-CFTR-3HA in BHK cells was analyzed by NA pull-down and Western blotting. Cells were treated with 10 µM MG-132 for 3 h before cell lysis. Statistical significance was assessed by a two-tailed paired t test (B–D), or one-way RM ANOVA with Dunnett’s multiple comparison tests (E and F). Each biological replicate (n) is color-coded: the averages from four technical replicates are shown in triangles (B–D). Data distribution was assumed to be normal but was not formally tested. Data represent mean ± SD. *P < 0.05, ns, not significant. Source data are available for this figure: SourceData F7.
Figure 8.
Figure 8.
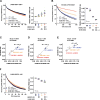
The substrate selectivity of HERC3 in ERAD. (A) A schematic diagram of the ERAD substrate models used in this study. The misfolded region is indicated by a star. The HiBiT tag was fused in the cytoplasmic region except for D18G-TTR. (B and C) The HiBiT degradation assay measured the ERAD of TCRα-HiBiT (B, n = 4) and Insig-1-HiBiT (C, n = 3) in 293MSR WT and RNF5/185 KO cells transfected with 50 nM siNT or siHERC3, as indicated. (D) The metabolic stability of D18G-TTR was measured by CHX chase at 37°C and Western blotting with an anti-TTR antibody in 293MSR WT and RNF5/185 KO cells transfected with 50 nM siNT or siHERC3 as indicated. The remaining TTR was quantified by densitometry and expressed as a percentage of the initial amount (right, n = 3). (E) Western blotting analyzed the effects of Myc-HERC3 OE on co-transfected ∆F508-CFTR-3HA, TCRα-HA, D18G-TTR-FLAG, or WT-CFTR-3HA in COS-7 cells. The immature ∆F508-CFTR (B band), TCRα, D18G-TTR, and total WT-CFTR (B and C bands) were quantified by densitometry (n = 3). (F) The HiBiT degradation assay measured the ERAD of ∆Y490-ABCB1-HiBiT (E, n = 3) in 293MSR WT and RNF5/185 KO cells as B and C. Each biological replicate (n) is color-coded: the averages from four technical replicates are shown in triangles (B, C, and F). Statistical significance was assessed by a one-way RM ANOVA with Dunnett’s multiple comparison tests (E) or two-way RM ANOVA revealed no significant main effect of HERC3 KD or RNF5/185 DKO, and no interaction between them (Pint > 0.05), except for a significant main effect of RNF5/185 DKO in F. Data distribution was assumed to be normal but was not formally tested. Data represent mean ± SD. *P < 0.05, **P < 0.01, ns, not significant. Source data are available for this figure: SourceData F8.
Figure 9.
Figure 9.
HERC3 selectively facilitates ERAD by interacting with the CFTR-MSDs. (A) A schematic diagram of the CFTR fragment models used in this study. The misfolded region is indicated by a star. M1; MSD1, M1-N1(∆F); MSD1 and NBD1 with ∆F508 mutation, M2; MSD2, N1(∆F); NBD1 with ∆F508 mutation. ∆Y490-ABCB1-MSD1CFTR and ∆Y490-ABCB1-MSD2CFTR are the chimeras in which the MSD1 and MSD2 of ABCB1 were replaced with respective MSDs of CFTR. The HiBiT tag was fused in the C-terminal region located in the cytoplasm. (B–D) The HiBiT degradation assay measured the ERAD of M1-HiBiT (B, n = 3), M1-N1(∆F)-HiBiT (C, n = 3), and M2-HiBiT (D, n = 3) in 293MSR WT and RNF5/185 KO cells transfected with 50 nM siNT or siHERC3, as indicated. (E and F) The HiBiT degradation assay measured the ERAD of ∆Y490-ABCB1, ∆Y490-ABCB1-∆M1, ∆Y490-ABCB1-∆M2, ∆Y490-ABCB1-M1CFTR, and ∆Y490-ABCB1-M2CFTR in 293MSR WT cells (F, n = 3). The ABCB1-HiBiT constructs analyzed were illustrated in E. (G and H) The HiBiT degradation assay measured the ERAD of ∆Y490-ABCB1-M1CFTR (G, n = 4) and ∆Y490-ABCB1-M2CFTR (H, n = 4) in 293MSR WT and RNF5/185 KO cells transfected with 50 nM siNT or siHERC3, as indicated. Statistical significance was assessed using a two-tailed paired t test (F) or two-way RM ANOVA (B–D, G, and H) which revealed a significant main effect of HERC3 KD or RNF5/185 DKO, but no significant interaction between them (Pint > 0.05), except for C. Each biological replicate (n) is color-coded, and the averages from four technical replicates are represented by triangles. Data distribution was assumed to be normal but was not formally tested. Data represent mean ± SD. *P < 0.05, **P < 0.01, ***P < 0.001, ****P < 0.0001, ns, not significant.
Figure S5.
Figure S5.
Effects of ablation of HERC3 and/or RNF5/185 on the ERAD of ∆F508-NBD1, N1303K-CFTR, and ∆Y490-ABCB1-∆M1, correlation of the ERAD between ∆F508-CFTR and CFTR fragments. (A and B) The HiBiT degradation assay measured the ERAD of ∆F508-NBD1-HiBiT (A, n = 4) and N1303K-CFTR-HiBiT (B, n = 3) in 293MSR WT and RNF5/185 KO cells transfected with 50 nM siNT or siHERC3 as indicated. Two-way RM ANOVA revealed a significant main effect of HERC3 KD (A and B) or RNF5/185 DKO (B), but no interaction between them (Pint > 0.05, in A and B). (C–E) The correlation of ERAD rates between ∆F508-CFTR (Fig. 3 F) and M1 (C, Fig. 9 B), M1-N1(∆F) (D, Fig. 9 C), or M2 (E, Fig. 9 D) in 293MSR WT and RNF5/185 KO cells transfected with 50 nM siNT or siHERC3. (F) The HiBiT degradation assay measured the ERAD of ∆Y490-ABCB1-∆M1-HiBiT in 293MSR WT and RNF5/185 KO cells transfected with 50 nM siNT or siHERC3 as indicated (n = 3). Two-way RM ANOVA revealed a significant main effect of RNF5/185 DKO, but not that of HERC3 KD, and no interaction between them. Each biological replicate (n) is color-coded: the averages from four technical replicates are shown in triangles (A, B, and F). Data represent mean ± SD. *P < 0.05, **P < 0.01, ****P < 0.0001, ns, not significant.
Figure 10.
Figure 10.
HERC3 directly interacts with the exposed CFTR-MSDs in vitro. (A) Western blotting confirmed the synthesis of FLAG-HERC3 (left) and biotinylated CFTR full-length (FL), M1, and M2 (right) using a wheat cell-free synthesis system in the presence or absence of asolectin liposomes. (B and C) AlphaScreen was employed to evaluate the direct binding of FLAG-HERC3 and biotinylated CFTR synthesized in the presence or absence of asolectin liposomes. FLAG- DHFR served as a negative control. The specific binding signal of FLAG-HERC3, subtracted by the DHFR binding, was measured in C. (D) The proposed model illustrates the function of HERC3 in the CFTR ERQC. HERC3 appears to selectively interact with specific regions of MSDs, typically embedded in the ER membrane. It is speculated that HERC3 monitors the MSDs of select membrane proteins at the ER membrane’s surface and facilitates the ERAD when the TM segments become exposed to the cytosol. Source data are available for this figure: SourceData F10.

Comment in

References

    1. Baldridge, R.D., and Rapoport T.A.. 2016. Autoubiquitination of the Hrd1 ligase triggers protein retrotranslocation in ERAD. Cell. 166:394–407. 10.1016/j.cell.2016.05.048 - DOI - PMC - PubMed
    1. Boucher, R.C. 2004. New concepts of the pathogenesis of cystic fibrosis lung disease. Eur. Respir. J. 23:146–158. 10.1183/09031936.03.00057003 - DOI - PubMed
    1. Capurro, V., Tomati V., Sondo E., Renda M., Borrelli A., Pastorino C., Guidone D., Venturini A., Giraudo A., Mandrup Bertozzi S., et al. . 2021. Partial rescue of F508del-CFTR stability and trafficking defects by double corrector treatment. Int. J. Mol. Sci. 22:5262. 10.3390/ijms22105262 - DOI - PMC - PubMed
    1. Carlson, E.J., Pitonzo D., and Skach W.R.. 2006. p97 functions as an auxiliary factor to facilitate TM domain extraction during CFTR ER-associated degradation. EMBO J. 25:4557–4566. 10.1038/sj.emboj.7601307 - DOI - PMC - PubMed
    1. Chen, B., Mariano J., Tsai Y.C., Chan A.H., Cohen M., and Weissman A.M.. 2006. The activity of a human endoplasmic reticulum-associated degradation E3, gp78, requires its Cue domain, RING finger, and an E2-binding site. Proc. Natl. Acad. Sci. USA. 103:341–346. 10.1073/pnas.0506618103 - DOI - PMC - PubMed

Publication types

MeSH terms

Substances

LinkOut - more resources