. 2024 Jul 1;223(7):e202309097.
doi: 10.1083/jcb.202309097. Epub 2024 May 9.

Prolonged depletion of profilin 1 or F-actin causes an adaptive response in microtubules

Affiliations

Prolonged depletion of profilin 1 or F-actin causes an adaptive response in microtubules

Bruno A Cisterna et al. J Cell Biol. .

Abstract

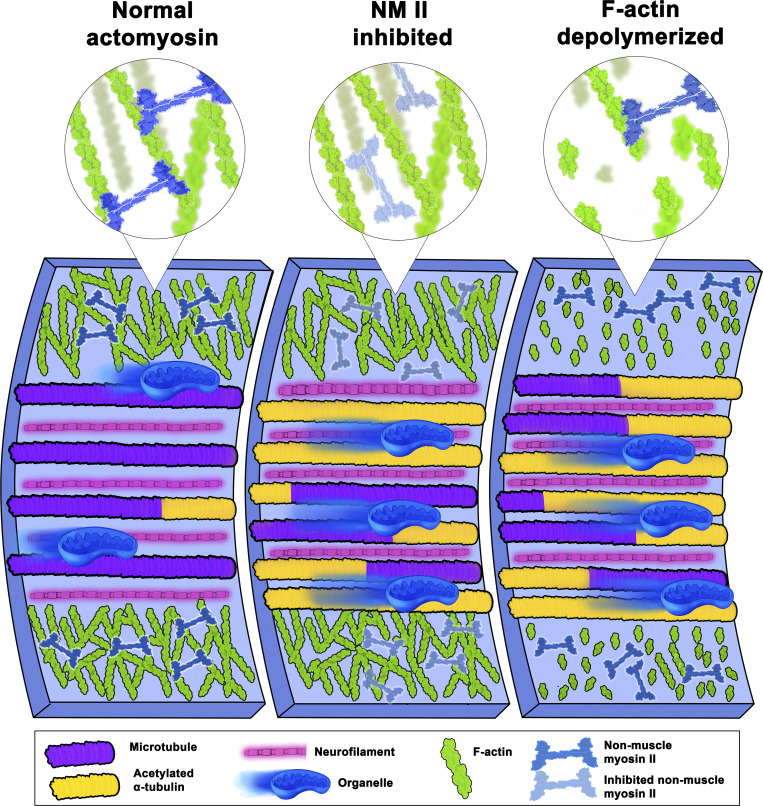
In addition to its well-established role in actin assembly, profilin 1 (PFN1) has been shown to bind to tubulin and alter microtubule growth. However, whether PFN1's predominant control over microtubules in cells occurs through direct regulation of tubulin or indirectly through the polymerization of actin has yet to be determined. Here, we manipulated PFN1 expression, actin filament assembly, and actomyosin contractility and showed that reducing any of these parameters for extended periods of time caused an adaptive response in the microtubule cytoskeleton, with the effect being significantly more pronounced in neuronal processes. All the observed changes to microtubules were reversible if actomyosin was restored, arguing that PFN1's regulation of microtubules occurs principally through actin. Moreover, the cytoskeletal modifications resulting from PFN1 depletion in neuronal processes affected microtubule-based transport and mimicked phenotypes that are linked to neurodegenerative disease. This demonstrates how defects in actin can cause compensatory responses in other cytoskeleton components, which in turn significantly alter cellular function.


Conflict of interest statement

Disclosures: The authors declare no competing interests exist.

Figures

None
Graphical abstract
Figure 1.
Figure 1.
PFN1 KO causes an adaptive response in the microtubule cytoskeleton. (A) Representative images of ⍺-tubulin in Control and PFN1 KO CAD cells. Scale bar: 10 µm. (B) Quantification of mean ⍺-tubulin fluorescence intensities in A. Data are normalized to Control (Ctrl) and plotted as mean ± 95% CI. n = 97 cells for Control and n = 96 cells for PFN1 KO. Significance was calculated using a two-sided Student’s t test. (C) Correlation between F-actin and ⍺-tubulin intensities for cells in A. Intensities were normalized to the mean of each dataset. (D and E) Representative images of F-actin (D) and β-tubulin (E) in PFN1 KO CAD cells transfected with GFP, GFP-PFN1WT (PFN1WT), GFP-PFN1R88E (PFN1R88E), GFP-PFN1M114T (PFN1M114T), GFP-PFN1E117G (PFN1E117G), or GFP-PFN1G118V (PFN1G118V). Insets in D highlight F-actin at the leading edge and cell body. Scale bar: 10 µm. Inset scale bar: 5 µm. (F) Quantification of mean F-actin and β-tubulin fluorescence intensities in E. Data were normalized to GFP and plotted as mean ± 95% CI. n = 120 cells for each transfection. Significance was calculated against GFP using ANOVA and Dunnett’s post hoc test. (G) Correlation between F-actin and β-tubulin intensities for cells in F. Intensities were normalized to the mean of each dataset. **** indicates P < 0.0001, * indicates P = 0.034, ns = not significant (P > 0.05).
Figure S1.
Figure S1.
Knocking out PFN1 in mouse embryonic fibroblasts increases the number and acetylation of microtubules. (A) From top to bottom, representative images of F-actin, ⍺-tubulin, acetyl ⍺-tubulin, and merge (F-actin: yellow; ⍺-tubulin: magenta; acetyl ⍺-tubulin: cyan) in Control and PFN1 KO mouse embryonic fibroblasts (MEFs) cells. Scale bar: 10 µm. (B) Quantification of the mean fluorescence intensities in A. From top to bottom, F-actin, ⍺-tubulin, acetyl ⍺-tubulin, and acetyl ⍺-tubulin/⍺-tubulin ratio. Data are normalized to Ctrl (F-actin, ⍺-tubulin, and acetyl ⍺-tubulin) and plotted as mean ± 95% CI. n = 41 cells for each condition. Significance was calculated using Student’s t test. **** indicates P < 0.0001, * indicates P < 0.05.
Figure 2.
Figure 2.
Prolonged depletion of F-actin can reproduce the adaptive response in microtubules caused by knocking out PFN1. (A) Representative images of ⍺-tubulin in Control CAD cells incubated with 0 or 10 nM Latrunculin A (Lat A) for 16 h and PFN1 KO CAD cells. Scale bar: 10 µm. (B and C) Quantification of mean fluorescence intensities in A. F-actin (B) and ⍺-tubulin (C). Data are normalized to Control and plotted as mean ± 95% CI. n = 101 cells for each condition. Significance was calculated against control using ANOVA and Dunnett’s post hoc test. (D) Representative images of acetyl ⍺-tubulin at the top and merge images of DAPI (yellow), ⍺-tubulin (magenta), and acetyl ⍺-tubulin (cyan) at the bottom in control and PFN1 KO CAD cells. Scale bar: 10 µm. (E) Quantification of mean fluorescence intensities in D. Acetyl ⍺-tubulin is at the top, and the acetyl ⍺-tubulin/⍺-tubulin ratio is at the bottom. Data are normalized to control (Ctrl) and plotted as mean ± 95% CI. n = 96 cells for Ctrl and PFN1 KO. Significance was calculated using a two-sided Student’s t test. (F) Western blot of acetyl ⍺-tubulin and GAPDH in Control CAD cells incubated with 0, 10 nM, or 20 nM Lat A for 16 h, and PFN1 KO CAD cells are at the top, and quantification of levels expression at the bottom. Individual data normalized to control and plotted as mean ± 95% CI. n = 3 independent experiments. Significance was calculated against control using ANOVA and Dunnett’s post hoc test. **** indicates P < 0.0001, ** indicates P < 0.01. Source data are available for this figure: SourceData F2.
Figure 3.
Figure 3.
The increase in acetylated microtubules caused by PFN1 KO is enhanced in the neuron-like processes of differentiated CAD cells and alters the active transport of organelles. (A) Representative images of the F-actin in the processes of differentiated Control and PFN1 KO CAD cells. Scale bar: 4 µm. (B) Quantifications of mean F-actin fluorescence intensity and process width of A. F-actin intensities were normalized to control (Ctrl). Data are plotted as mean ± 95% CI. For F-actin intensity quantification, n = 200 processes for control and n = 120 for PFN1 KO. For process width quantification, n = 200 processes for control and n = 180 for PFN1 KO. Significance was calculated using a two-sided Student’s t test. (C) Quantifications of filopodia length and density in A. For filopodia length quantification, n = 1,534 processes for control and n = 806 for PFN1 KO. For filopodia density quantification, n = 39 processes for control and n = 40 for PFN1 KO. Significance was calculated using a Mann–Whitney U test for filopodia length and a two-sided Student’s t test for filopodia density. (D) Representative images of the ⍺-tubulin at the top and merged images of ⍺-tubulin (magenta) and acetyl ⍺-tubulin (cyan) at the bottom in the processes of differentiated control and PNF1 KO CAD cells. Scale bar: 15 µm. Inset scale bar: 5 µm. (E) Mean fluorescence intensities in D. ⍺-tTubulin intensity is at the top, acetyl ⍺-tubulin intensity is in the middle, and the acetyl ⍺-tubulin/⍺-tubulin ratio is at the bottom. Data are normalized to Ctrl (⍺-tubulin and acetyl ⍺-tubulin) and plotted as mean ± 95% CI. N = 101 fields for Control and PNF1 KO cells. Significance was calculated using a two-sided Student’s t test. (F) Representative merge images of F-actin (yellow), ⍺-tubulin (magenta), and acetyl ⍺-tubulin (cyan) in the processes of differentiated PFN1 KO cells transfected with GFP, GFP-PFN1WT (PFN1WT), and GFP-PFN1R88E (PFN1R88E). Scale bar: 4 µm. (G) Quantification of mean of ⍺-tubulin and acetyl ⍺-tubulin fluorescence intensities in F. Data were normalized to GFP and plotted as mean ± 95% CI. N = 31 processes for GFP, n = 28 processes for PFN1WT and PFN1R88E. Significance was calculated against GFP using ANOVA and Dunnett’s post hoc test. (H and I) Western blot of ⍺-tubulin (H) and acetyl ⍺-tubulin (I) in Ctrl and PFN1 KO CAD cells at the top and quantification of levels expression at the bottom. Individual data were normalized to Ctrl and plotted as mean ± 95% CI. n = 4 independent experiments. Significance was calculated using a two-sided Student’s t test. (J) Representative images of F-actin (orange), TOM20 (cyan), and β-tubulin (magenta) in processes of differentiated Control and PFN1 KO CAD cells. Scale bar: 4 µm. (K and M) Kymographs from mitochondria (Mitotracker) (K) and lysosome (Lysotracker) (M) in processes of differentiated Control and PFN1 KO CAD cells. Vertical scale bar: 5 s and horizontal scale bar: 5 µm. (L and N) Kymograph quantifications. Run length at the top and average velocity at the bottom for Mitotracker (L), and Lysotracker (N). Data are plotted as mean ± 95% CI. For Mitotracker run length quantification, n = 7,376 for Control and n = 26,016 for PFN1 KO. For Mitotracker average velocity quantification, n = 24,441 for Control and n = 42,989 for PFN1 KO. For Lyostracker run length quantification, n = 4,888 for Control and n = 7,534 for PFN1 KO. For Lysotracker average velocity quantification, n = 4,937 for Control and n = 7,612 for PFN1 KO. **** indicates P < 0.0001, ** indicates P < 0.01. Significance was calculated using Mann–Whitney U test. **** indicates P < 0.0001, ** indicates P < 0.01. Source data are available for this figure: SourceData F3.
Figure S2.
Figure S2.
PFN1 KO CAD cells have an elevated expression of neurofilament heavy chain. (A) Representative images of F-actin at the top, neurofilament heavy chain (Neurofilament H) in the middle, and merge images (F-actin: yellow; Neurofilament H: magenta) at the bottom in control, PFN1 KO CAD cells, and HeLa cells, which were used a non-neuronal control. Scale bar: 10 µm. (B) Representative images of F-actin, Neurofilament H, and merge images in the processes of differentiated Control and PFN1 KO CAD cells. Scale bar: 4 µm. (C) Quantification of mean fluorescence intensities of cells in A. Data are normalized to control and plotted as mean ± 95% CI. n = 80 cells for control and n = 82 cells for PFN1 KO. Significance was calculated using Student’s t test. (D) Quantification of mean fluorescence intensities of neuron-like processes of differentiated CAD cells in B. Data are normalized to control and plotted as mean ± 95% CI. n = 73 processes for control and PFN1 KO. Four independent experiments Significance was calculated using Student’s t test. **** indicates P < 0.0001.
Figure 4.
Figure 4.
Prolonged depletion of F-actin increases the number and acetylation of microtubules in the processes of hippocampal neurons. (A) From top to bottom, representative images of F-actin, ⍺-tubulin, acetyl ⍺-tubulin, and merge images (acetyl ⍺-tubulin: cyan; ⍺-tubulin: magenta) in hippocampal neurons incubated with 0, 50, 100, or 500 nM Latrunculin A (Lat A) for 16 h. Scale bar: 15 µm. Inset scale bar: 5 µm. (B) Quantification of the mean fluorescence intensities in A. From left to right, F-actin, ⍺-tubulin, acetyl ⍺-tubulin, and acetyl ⍺-tubulin/⍺-tubulin ratio. Data are normalized to Ctrl (F-actin, ⍺-tubulin, and acetyl ⍺-tubulin) and plotted as mean ± 95% CI. n = 50 fields for each condition. Significance was calculated against control using ANOVA and Dunnett’s post hoc test. (C and D) Correlation between fluorescence intensities for neurites in A. F-actin versus ⍺-tubulin (C), and F-actin versus acetyl ⍺-tubulin (D). Intensities were normalized to the mean of each dataset. **** indicates P < 0.0001, ns = not significant (P > 0.05).
Figure S3.
Figure S3.
Manipulating myosin activity has no effect on tubulin acetylation in PFN1 KO or F-actin depleted CAD cells. (A) Representative bright field images of CAD cells incubated with 0, 15 µM Blebbistatin (Blebb) for 24 h, or Blebb for 24 h and then washed and incubated with fresh medium for 24 h. Scale bar: 20 µm. (B) Western blot of acetyl ⍺-tubulin and GAPDH in CAD cells incubated with 0, 15 µM Blebb for 24 h (B), or Blebb for 24 h and then washed and incubated with fresh medium for 24 h (B+W) at the top, and quantification of levels expression at the bottom. Data are normalized to control and plotted as mean ± 95% CI. Four independent experiments. Significance was calculated against control using ANOVA and Dunnett’s post hoc test. (C) Representative merge images of F-actin (yellow), ⍺-tubulin (magenta), and acetyl ⍺-tubulin (cyan) in PFN1 KO CAD cells incubated with 0, 15 µM Blebb for 24 h, or Blebb for 24 h and then washed and incubated with fresh medium for 24 h. Scale bar: 10 µm. (D) Quantification of mean acetyl ⍺-tubulin intensities in C. Data are normalized to Ctrl and plotted as mean ± 95% CI. n = 80 cells for PFN1 KO, n = 72 cells for Blebb (B), and n = 60 cells for B+W. Significance was calculated against control using ANOVA and Dunnett’s post hoc test. (E) Representative merge images of F-actin, ⍺-tubulin, acetyl ⍺-tubulin in CAD cells incubated with 0, 10 nM Lat A for 24 h, or cells incubated with Lat A for 48 h where Blebb was added after the first 24 h. Scale bar: 10 µm. (F) Quantification of mean fluorescence intensities in E. F-actin and ⍺-tubulin at the top, and acetyl ⍺-tubulin in the bottom. Data are normalized to Ctrl and plotted as mean ± 95% CI. n = 21 cells for Control and Lat A plus Blebb, and n = 35 cells for Lat A. Significance was calculated using ANOVA and Tukey’s post hoc test. (G) Representative images of F-actin in CAD cells incubated with 0 or 5 nM Calyculin A (Cal A) for 16 h. Scale bar: 10 µm. (H) Representative merge images of F-actin, ⍺-tubulin, and acetyl ⍺-tubulin in PFN1 KO CAD cells incubated with 0 or 5 nM Cal A for 16 h. Scale bar: 10 µm. (I) Quantification of mean ⍺-tubulin and acetyl ⍺-tubulin intensities in H. Data are normalized to control and plotted as mean ± 95% CI. n = 50 cells for all conditions. Significance was calculated using Student’s t test. **** indicates P < 0.0001, ns = not significant (P > 0.05). Source data are available for this figure: SourceData FS3.
Figure 5.
Figure 5.
Prolonged inhibition of actomyosin contractility increases the number and acetylation of microtubules without depolymerizing F-actin in hippocampal neuron processes. (A) From top to bottom, representative images of F-actin, ⍺-tubulin, acetyl ⍺-tubulin, and merge images (F-actin: yellow; ⍺-tubulin: magenta) in hippocampal neurons incubated with 0, 15 µM Blebbistatin (Blebb) for 24 h, or Blebb for 24 h and then washed and incubated with fresh medium for 24 h. Scale bar: 15 µm. Inset scale bar: 5 µm. (B) Quantification of the mean fluorescence intensities in A. From top to bottom, F-actin, ⍺-tubulin, acetyl ⍺-tubulin, and acetyl ⍺-tubulin/⍺-tubulin ratio. Data are normalized to Ctrl (F-actin, ⍺-tubulin, and acetyl ⍺-tubulin) and plotted as mean ± 95% CI. n = 50 fields for control and Blebb (24 h) + Wash-out (24 h) (B+W), n = 53 fields for Blebbistatin for 24 h (B). Significance was calculated against control using ANOVA and Dunnett’s post hoc test. (C) Correlations between F-actin and ⍺-tubulin intensities for neurites in A. Intensities were normalized to the mean of each dataset. **** indicates P < 0.0001, ns = not significant (P > 0.05).

Update of

Comment in

References

    1. Alper, J.D., Decker F., Agana B., and Howard J.. 2014. The motility of axonemal dynein is regulated by the tubulin code. Biophys. J. 107:2872–2880. 10.1016/j.bpj.2014.10.061 - DOI - PMC - PubMed
    1. Balabanian, L., Berger C.L., and Hendricks A.G.. 2017. Acetylated microtubules are preferentially bundled leading to enhanced Kinesin-1 motility. Biophys. J. 113:1551–1560. 10.1016/j.bpj.2017.08.009 - DOI - PMC - PubMed
    1. Bender, M., Stritt S., Nurden P., van Eeuwijk J.M., Zieger B., Kentouche K., Schulze H., Morbach H., Stegner D., Heinze K.G., et al. . 2014. Megakaryocyte-specific Profilin1-deficiency alters microtubule stability and causes a Wiskott-Aldrich syndrome-like platelet defect. Nat. Commun. 5:4746. 10.1038/ncomms5746 - DOI - PubMed
    1. Blagov, A.V., Grechko A.V., Nikiforov N.G., Borisov E.E., Sadykhov N.K., and Orekhov A.N.. 2022. Role of impaired mitochondrial dynamics processes in the pathogenesis of Alzheimer’s disease. Int. J. Mol. Sci. 23:6954. 10.3390/ijms23136954 - DOI - PMC - PubMed
    1. Breuer, A.C., Lynn M.P., Atkinson M.B., Chou S.M., Wilbourn A.J., Marks K.E., Culver J.E., and Fleegler E.J.. 1987. Fast axonal transport in amyotrophic lateral sclerosis: An intra-axonal organelle traffic analysis. Neurology. 37:738–748. 10.1212/WNL.37.5.738 - DOI - PubMed

Publication types