. 2024 May 9;147(1):82.
doi: 10.1007/s00401-024-02733-x.

Physiological aging and inflammation-induced cellular senescence may contribute to oligodendroglial dysfunction in MS

Affiliations

Physiological aging and inflammation-induced cellular senescence may contribute to oligodendroglial dysfunction in MS

Farina Windener et al. Acta Neuropathol. .

Abstract

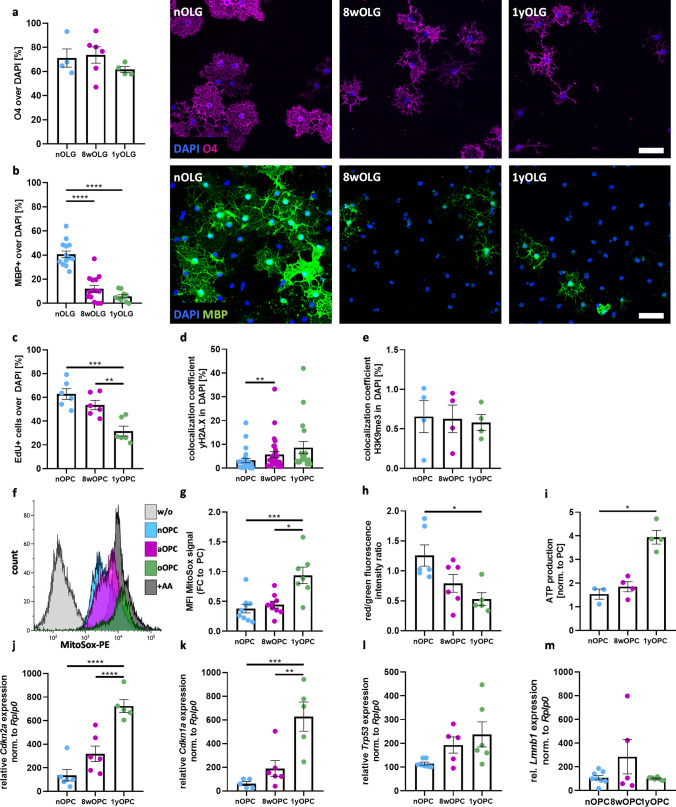
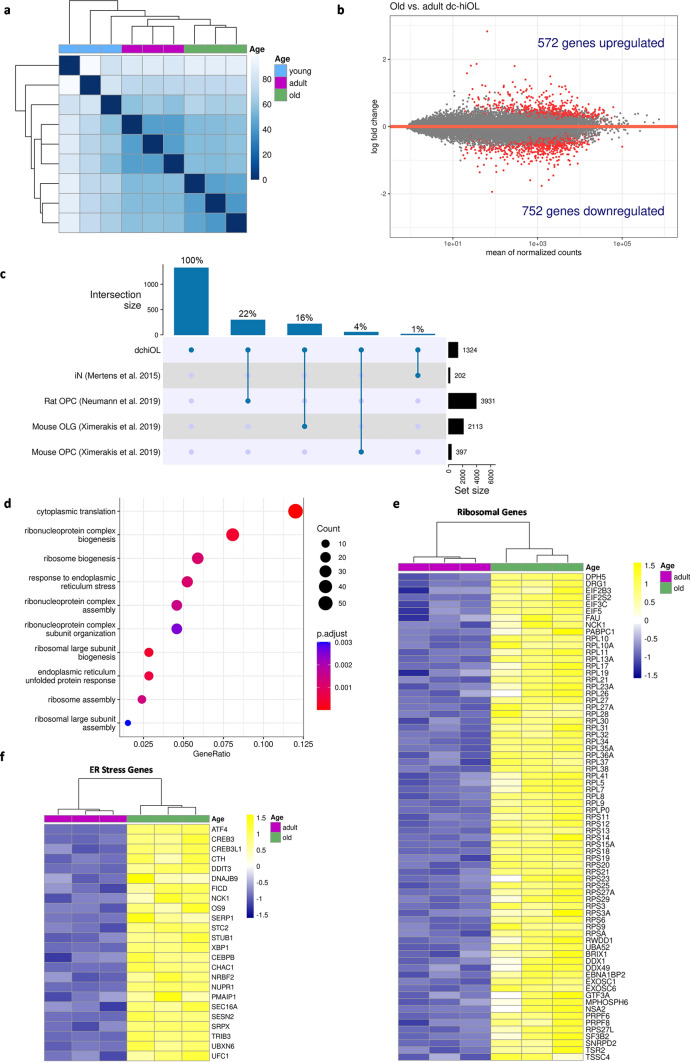
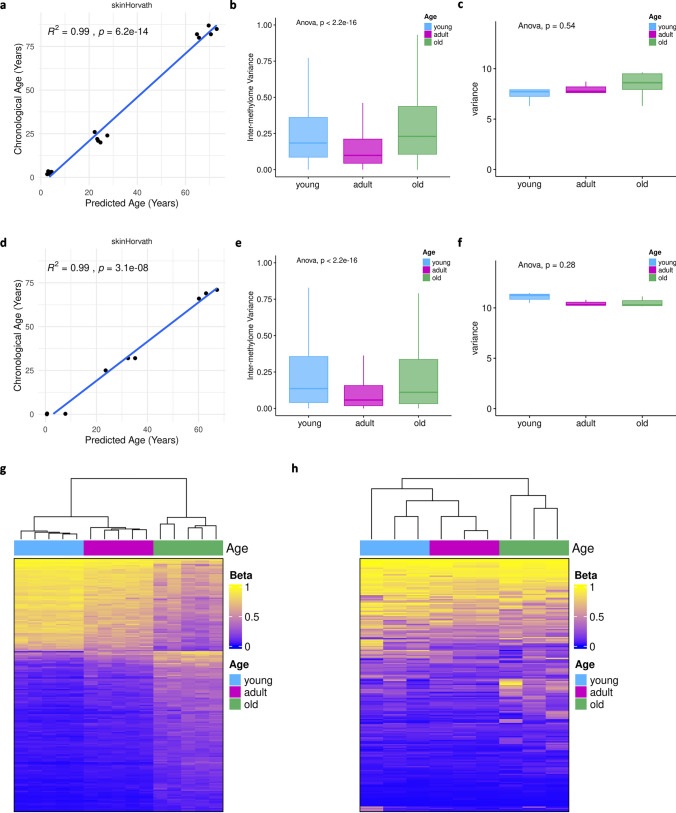
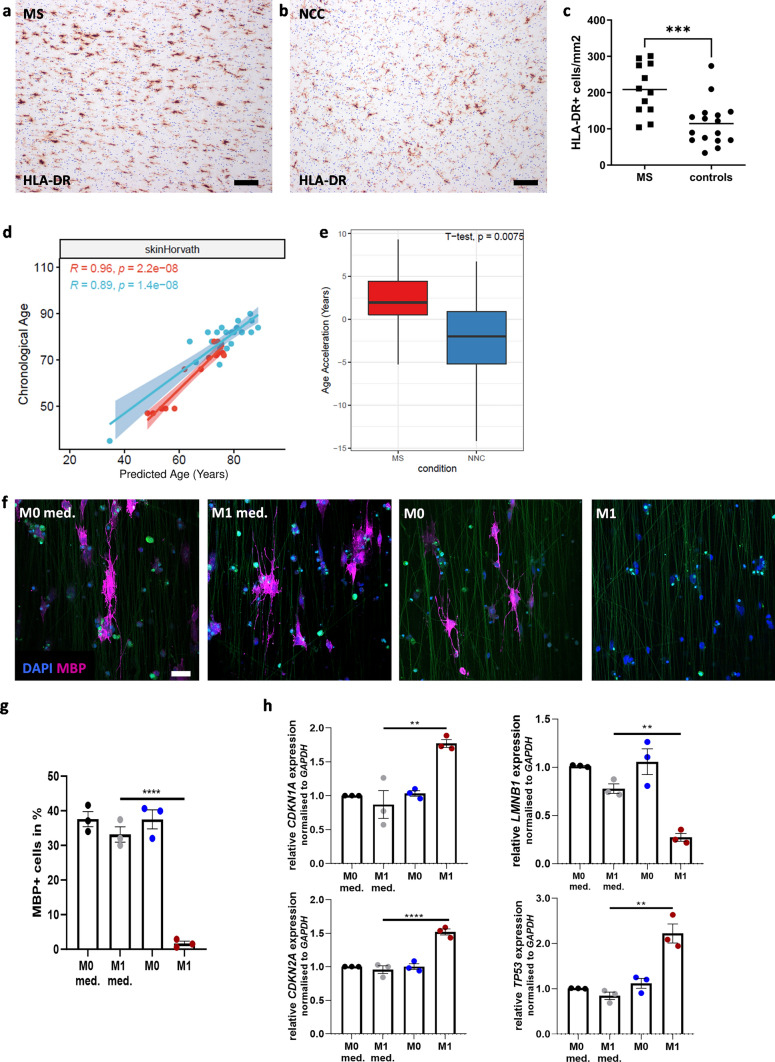
Aging affects all cell types in the CNS and plays an important role in CNS diseases. However, the underlying molecular mechanisms driving these age-associated changes and their contribution to diseases are only poorly understood. The white matter in the aging brain as well as in diseases, such as Multiple sclerosis is characterized by subtle abnormalities in myelin sheaths and paranodes, suggesting that oligodendrocytes, the myelin-maintaining cells of the CNS, lose the capacity to preserve a proper myelin structure and potentially function in age and certain diseases. Here, we made use of directly converted oligodendrocytes (dchiOL) from young, adult and old human donors to study age-associated changes. dchiOL from all three age groups differentiated in an comparable manner into O4 + immature oligodendrocytes, but the proportion of MBP + mature dchiOL decreased with increasing donor age. This was associated with an increased ROS production and upregulation of cellular senescence markers such as CDKN1A, CDKN2A in old dchiOL. Comparison of the transcriptomic profiles of dchiOL from adult and old donors revealed 1324 differentially regulated genes with limited overlap with transcriptomic profiles of the donors' fibroblasts or published data sets from directly converted human neurons or primary rodent oligodendroglial lineage cells. Methylome analyses of dchiOL and human white matter tissue samples demonstrate that chronological and epigenetic age correlate in CNS white matter as well as in dchiOL and resulted in the identification of an age-specific epigenetic signature. Furthermore, we observed an accelerated epigenetic aging of the myelinated, normal appearing white matter of multiple sclerosis (MS) patients compared to healthy individuals. Impaired differentiation and upregulation of cellular senescence markers could be induced in young dchiOL in vitro using supernatants from pro-inflammatory microglia. In summary, our data suggest that physiological aging as well as inflammation-induced cellular senescence contribute to oligodendroglial pathology in inflammatory demyelinating diseases such as MS.

Keywords: Aging; Direct conversion; Human oligodendrocytes; Multiple sclerosis.


Conflict of interest statement

TK received research funding from the German Research Foundation, Interdisciplinary Center for Clinical Research (IZKF) Münster, National MS Society, German MS Society and Novartis. She received compensation for serving on scientific advisory boards (Novartis, Sanofi, Merck) and speaker honoraria from Novartis, Biogen and Roche.

Figures

Fig. 1
Fig. 1
Aging phenotype of primary mouse OPC. (a) Maturation into O4+ oligodendrocytes showed no significant difference. (b) Amount of mature MBP+ cells decreased in 8wOLG and 1yOLG. (c) Proliferative oligodendroglial precursor cells are identified by EdU. Decrease in cell division can be seen between 8wOPC and 1yOPC to nOPC. (d) Identification of yH2A.X loci in primary OPC was based on ICC and analyzed via the co-localization coefficient. (e) No changes in the repressive histone marks H3K9me3 in 1yOPC were detected. (f, g) Within aged OPC, an increase in superoxide is detected. Superoxide was measured using flow cytometry and MitoSox™Red. (h) The mitochondrial membrane potential is slightly decreased in 1yOPC as detected by the red/green fluorescence ration of JC-1 reagent. (i) Celltiter-Glo® assay reveals increased ATP level in aged OPC. (jm) Expression of aging marker measured by RT-qPCR. Scale bar in ab = 50 µm, identify outlier ROUT test (1%), followed by one-way ANOVA and Tukeys Multiple comparisons test
Fig. 2
Fig. 2
Aging phenotype of dchiOL. (a) Representative images and quantification of O4 + dchiOLs showed no significant difference between the three age groups. Differentiation of fibroblasts into O4+-dchiOL (O4+ over DAPI + cells). (b) Representative pictures and quantification of mature MBP+ dchiOL showed a significant decreased in old compared to young dchiOL. (c) Seahorse measurements of mitochondrial performance of young, adult and old dchiOL under the influence of different stressors. (d) basal respiration is not altered in adult and old dchiOL compared to young dchiOL. (e) maximal respiration is increased in adult and old dchiOL compared to young dchiOL. (f) spare respiratory capacity is increased in adult and old dchiOL compared to young. (g) ATP production is higher in old dchiOL compared to young and adult dchiOL (h) old dchiOL showed an increase in superoxide (measured by flow cytometry using MitoSox™Red). (i) Expression of repressive histone marks H3K9me3 decreased in old compared to young dchiOL. (jm) Heatmaps showing scaled and normalized expression values of age-associated genes (j), mitochondrial genes (k), senescence associated genes (l) and genes related to the inflammatory response (m) in young, adult and old dchiOL. Scale bar in ab = 100 µm
Fig. 3
Fig. 3
Age-associated transcriptomic changes in dchiOL. (a) Heatmap of the sample-to-sample distances showing that old and adult individuals cluster closely together and apart from young samples. (b) MA plot showing the results of differential expression analysis comparing old vs. adult dchiOL. In old dchiOL 572 genes are significantly upregulated, whereas 752 genes are significantly downregulated (adjusted p value < 0.05). (c) Upset plot showing the overlap of the 1324 differentially regulated genes between old and adult dchiOL and aging-associated genes found in directly converted induced neurons (iN), rat OPCs, mouse OPCs and mouse oligodendrocytes (OLGs). (d) GO term enrichment analysis of the 572 upregulated genes in old versus adult dchiOL. Dot size represents enriched gene counts and color code indicates the adjusted p values. (e) Heatmap showing scaled and normalized expression values of individual genes related to the GO terms “cytoplasmatic translation”, “ribonucleoprotein complex biogenensis” and “ribonucleoprotein complex assembly”. (f) Heatmap showing scaled and normalized expression values of individual genes related to the GO terms “endoplasmic reticulum unfolded protein response” and “response to endoplasmic reticulum stress”
Fig. 4
Fig. 4
Age-associated epigenetic changes in human white matter and dchiOL. (a) Comparison of chronological and epigenetic age determined by DNA methylation profiles from 15 white matter samples using the skinHorvath clock shows a high degree of correlation (R2 = 0.99, p = 6.2 × 10–14). (b) Box plots showing differences of inter-methylome variance of white matter samples across three age groups with higher variability in old individuals (ANOVA, p < 2.2 × 10–16). (c) The dynamic range of intra-methylome variation shows no differences across age groups in white matter samples (ANOVA, p = 0.54). (d) Comparison of chronological and epigenetic age determined by DNA methylation profiles from 9 dchiOL using the skinHorvath clock shows a high degree of correlation (R2 = 0.99, p = 3.1 × 10–8). (e) Box plots showing differences of inter-methylome variance of dchiOL across three age groups with higher variability in old individuals (ANOVA, p < 2.2 × 10–16). (f) The dynamic range of intra-methylome variation shows no differences across age groups in dchiOL (ANOVA, p = 0.28). (g) Heatmap showing clustering of white matter methylation values based on 194 CpGs significantly associated with age in a linear model (p < 0.001). (h) Heatmap based on the same set of 194 CpGs results in a similar clustering of dchiOL according to the age group
Fig. 5
Fig. 5
Young dchiOL acquire some age-associated properties after exposure to pro-inflammatory supernatants. (a and b) Immunohistochemistry for the myeloid cell marker HLA-DR (brown) in the non-demyelinated white matter depicted exemplarily a MS and non-neurological controls (NNC) tissue samples. (c) Quantification of HLA-DR + myeloid cells reveals significantly higher myeloid cell densities in the non-demyelinated white matter in MS tissue samples compared to NNC (p = 0.0006, Mann–Whitney test). (d) Scatter plot showing the relation of chronological age with epigenetic age determined by DNA methylation profiles from NAWM of MS patients (red) and NNC (blue). Regression lines are plotted for NAWM and NNC individually showing high correlation in both groups but a shift towards older epigenetic age in NAWM from MS patients. (e) Box plots showing the age acceleration of NAWM samples (red) and NNC (blue) as defined by the absolute difference of epigenetic and chronological age. NAWM samples from MS patients show a significantly higher age acceleration (p = 0.0075, t-test). (f) Representative images of MBP+ cells in young dciOL cultured on nanofibers treated with either supernatants from non-polarized primary human microglia (M0), proinflammatory primary human microglia (M1) or control medium (M0 medium, M1 medium). (g) Quantification of MBP+ cells in young dciOL cultured on Nanofibers treated with pro-inflammatory primary human microglia supernatants (M1) compared to unstimulated microglia supernatants (M0) and respective media controls (M0 med./M1 med.). (h) qRT-PCR analysis of age- and senescence-associated genes revealed a senescent phenotype of young dchiOL treated with M1 supernatants compared to M0 supernatants and respective media controls (M0 med./M1 med.). Identify outlier ROUT test (1%), followed by one-way ANOVA and Tukeys Multiple comparisons test. Scale bars in a and b: 50 µm, scale bar in f = 100 µm

References

    1. Yeung MS, Zdunek S, Bergmann O, Bernard S, Salehpour M, Alkass K, Perl S, Tisdale J, Possnert G, Brundin L, et al. Dynamics of oligodendrocyte generation and myelination in the human brain. Cell. 2014;159:766–774. doi: 10.1016/j.cell.2014.10.011. - DOI - PubMed
    1. Fields RD. White matter in learning, cognition and psychiatric disorders. Trends Neurosci. 2008;31:361–370. doi: 10.1016/j.tins.2008.04.001. - DOI - PMC - PubMed
    1. Bartzokis G, Lu PH, Tingus K, Mendez MF, Richard A, Peters DG, Oluwadara B, Barrall KA, Finn JP, Villablanca P, et al. Lifespan trajectory of myelin integrity and maximum motor speed. Neurobiol Aging. 2010;31:1554–1562. doi: 10.1016/j.neurobiolaging.2008.08.015. - DOI - PMC - PubMed
    1. Cox SR, Ritchie SJ, Tucker-Drob EM, Liewald DC, Hagenaars SP, Davies G, Wardlaw JM, Gale CR, Bastin ME, Deary IJ. Ageing and brain white matter structure in 3,513 UK Biobank participants. Nat Commun. 2016;7:13629. doi: 10.1038/ncomms13629. - DOI - PMC - PubMed
    1. Wang S, Young KM. White matter plasticity in adulthood. Neuroscience. 2014;276:148–160. doi: 10.1016/j.neuroscience.2013.10.018. - DOI - PubMed

Publication types

Substances