. 2024 May 9;134(13):e165482.
doi: 10.1172/JCI165482.

Mitochondria regulate proliferation in adult cardiac myocytes

Affiliations

Mitochondria regulate proliferation in adult cardiac myocytes

Gregory B Waypa et al. J Clin Invest. .

Abstract

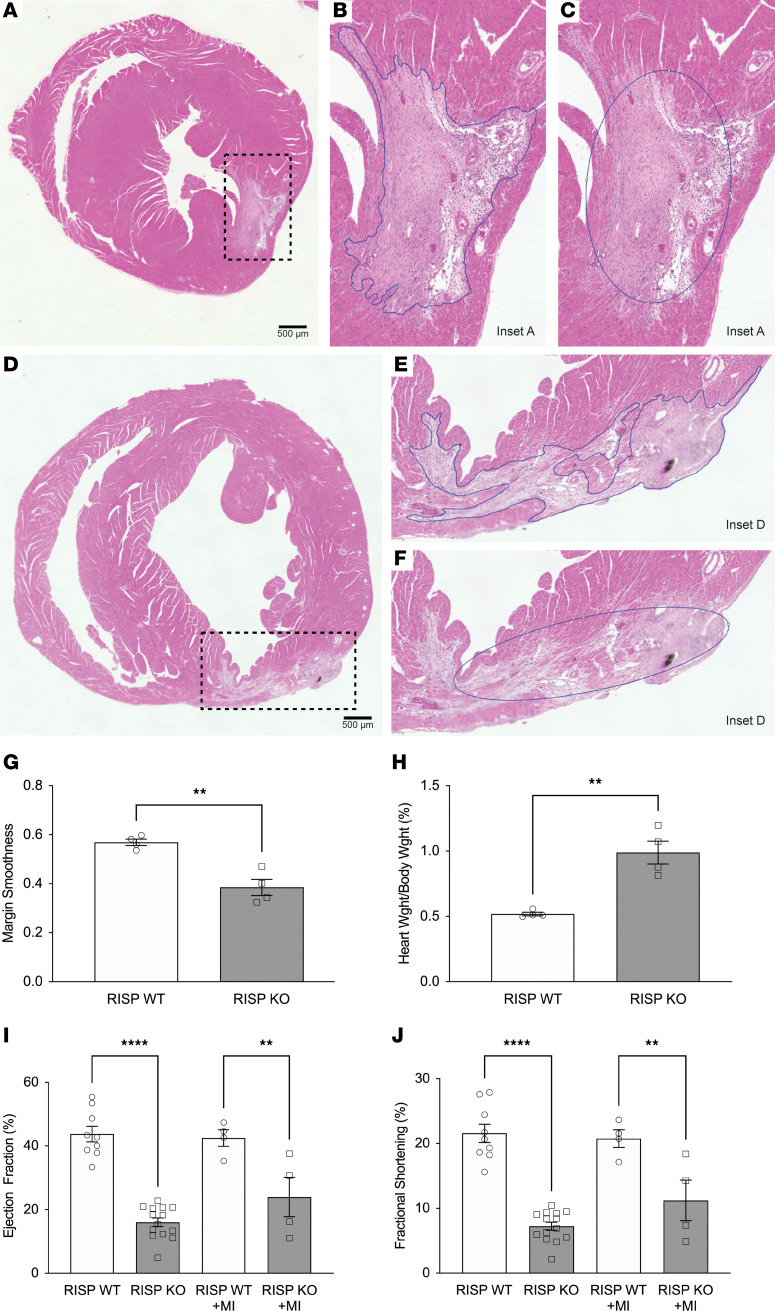
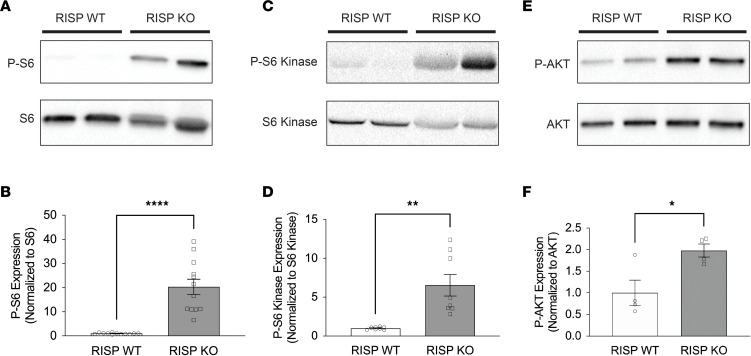
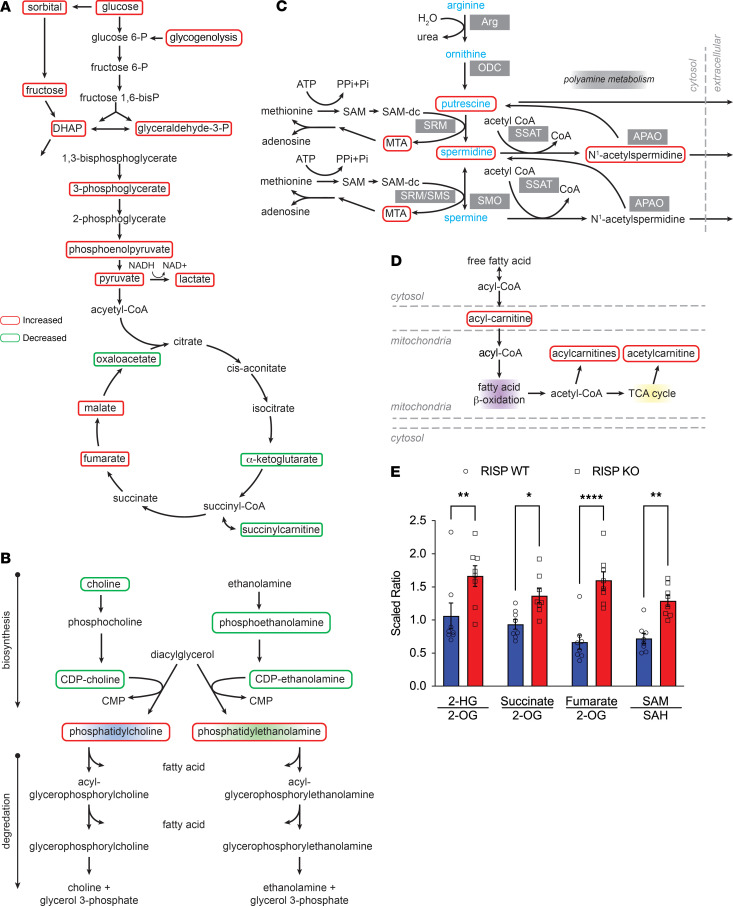
Newborn mammalian cardiomyocytes quickly transition from a fetal to an adult phenotype that utilizes mitochondrial oxidative phosphorylation but loses mitotic capacity. We tested whether forced reversal of adult cardiomyocytes back to a fetal glycolytic phenotype would restore proliferative capacity. We deleted Uqcrfs1 (mitochondrial Rieske iron-sulfur protein, RISP) in hearts of adult mice. As RISP protein decreased, heart mitochondrial function declined, and glucose utilization increased. Simultaneously, the hearts underwent hyperplastic remodeling during which cardiomyocyte number doubled without cellular hypertrophy. Cellular energy supply was preserved, AMPK activation was absent, and mTOR activation was evident. In ischemic hearts with RISP deletion, new cardiomyocytes migrated into the infarcted region, suggesting the potential for therapeutic cardiac regeneration. RNA sequencing revealed upregulation of genes associated with cardiac development and proliferation. Metabolomic analysis revealed a decrease in α-ketoglutarate (required for TET-mediated demethylation) and an increase in S-adenosylmethionine (required for methyltransferase activity). Analysis revealed an increase in methylated CpGs near gene transcriptional start sites. Genes that were both differentially expressed and differentially methylated were linked to upregulated cardiac developmental pathways. We conclude that decreased mitochondrial function and increased glucose utilization can restore mitotic capacity in adult cardiomyocytes, resulting in the generation of new heart cells, potentially through the modification of substrates that regulate epigenetic modification of genes required for proliferation.

Keywords: Bioenergetics; Cardiology; Cardiovascular disease; Metabolism; Mitochondria.


Conflict of interest statement

Conflict of interest: The authors have declared that no conflict of interest exists.

Figures

Figure 1
Figure 1. Cardiac RISP KO and energy supply in mice.
(A) Adult mT/mG reporter mice carrying the Myh6-Cre transgene were given tamoxifen. After 14 days, liver and heart were removed and analyzed for evidence of Cre-mediated conversion from red to green fluorescent protein. Liver expressed only red fluorescence, whereas cardiac myocytes expressed green, indicating Cre activity. Scale bars: 50 μm. (B) RISP-KO and -WT mice were given tamoxifen and then evaluated at 30, 60, and 75 days. (C and D) Immunoblotting heart lysates for RISP protein revealed a progressive loss, with virtually complete depletion by 60 days; n = 4 mice per condition, mean ± SEM, 2-way ANOVA with a Holm-Šídák multiple-comparison test (2W-ANOVA-Šidák’s). (E and F) Representative FDG-PET assessment in RISP-WT and -KO mouse hearts. (G) Quantitative analysis of FDG utilization. The percentage injected dose (%ID) of FDG for each tissue was calculated by division of the total PET signal found in the region of interest by the injected dose for each mouse; n = 4–5 mice per condition, mean ± SEM, unpaired 2-tailed t test. (H) Adenine nucleotide levels in snap-frozen hearts from RISP-WT and -KO mice at 60 and 75 days after tamoxifen; n = 4 mice per condition, mean ± SEM, 2W-ANOVA-Šidák’s. (I) Adenine nucleotide energy charge in snap-frozen hearts from RISP-WT and -KO mice at 60 and 75 days after tamoxifen; n = 4 mice per condition, mean ± SEM, 2W-ANOVA-Šidák’s. (J and K) Assessment of AMPK activation in snap-frozen hearts from RISP-WT and -KO mice at 60 and 75 days after tamoxifen. Positive control was rapidly excised and cooled before freezing, rather than snap-frozen in situ; n = 4 mice per condition, mean ± SEM, unpaired 2-tailed t test. **P < 0.01, ***P < 0.001.
Figure 2
Figure 2. Cardiac RISP KO and subsequent remodeling in adult mice.
(A) Heart size increased significantly at 75 days after tamoxifen in RISP-KO mice compared with WT controls. Scale bars: 5 mm. (B) HW/BW increased at 60 and 75 days after tamoxifen in RISP-KO mice compared with WT controls; n = 6–9 mice per condition, mean ± SEM, 2W-ANOVA-Šidák’s. (C) LV weight increased at 60 and 75 days after tamoxifen compared with WT; n = 6–9 mice per condition, mean ± SEM, 2W-ANOVA-Šidák’s. (D) Heart size was significantly increased in RISP-KO mice compared with WT, while cell morphology was indistinguishable between groups. Scale bars: 2 mm or 50 μm. (E) Cardiac fibrosis (Masson’s trichrome stain) was absent in RISP-KO hearts at 75 days after tamoxifen, and indistinguishable from WT. Cell diameter was assessed in PAS-stained heart sections. Scale bars: 50 μm. (F) Representative heart sections stained for DAPI, myosin light chain (LC), and Ki-67 in RISP-WT and -KO hearts 60 days after tamoxifen. Yellow and magenta arrowheads denote Ki-67–positive nuclei. In hearts from RISP-WT mice, most Ki-67–positive nuclei were colocalized to regions between cardiomyocytes and therefore not counted (magenta arrowheads). In RISP-KO hearts, only Ki-67–positive nuclei that colocalized with cardiomyocytes were counted (yellow arrowheads). Scale bars: 50 μm. (G) Ki-67–positive nuclei were more abundant in RISP-KO hearts at 60 days after tamoxifen compared with WT; n = 8–18 mice per condition, mean ± SEM, 2W-ANOVA-Šidák’s. (H) Phospho-H3–positive nuclei were more abundant in RISP-KO hearts at 60 days after tamoxifen compared with WT; n = 8–18 mice per condition, mean ± SEM, 2W-ANOVA-Šidák’s. (I) EdU-positive nuclei in cardiac sections from RISP-WT and -KO mice at 60 days after tamoxifen. EdU was administered by subcutaneous micro-osmotic pump, inserted at day 30; n = 3–6 mice per condition, mean ± SEM, unpaired 2-tailed t test. *P < 0.05, ***P < 0.001, ****P < 0.0001.
Figure 3
Figure 3. Cardiac RISP deletion causes cardiac hyperplasia.
(A) Isolated, individual cardiomyocytes from mT/mG-RISP-WT or -KO mice 60 days after tamoxifen were stained with DAPI. Cardiomyocytes from mT/mG-RISP-WT mice maintained red fluorescence (mT), while cardiomyocytes from mT/mG-RISP-KO mice expressed green fluorescence (mG). The length and width of Cre-activated cardiomyocytes expressing mG were measured (ImageJ). Scale bars: 25 μm. (B and C) Cardiomyocyte length (B) and width (C). RISP KO had no effect on the size of cardiomyocytes compared with WT. (D) RISP KO caused cardiac hyperplasia compared with WT, as assessed by number of cardiomyocytes in hearts. Cardiomyocytes were counted and extrapolated to determine the number in the whole heart; n = 6–10 mice per condition, mean ± SEM, unpaired 2-tailed t test. (E) RISP KO increased the percentage of mononucleated and decreased the percentage of binucleated cardiomyocytes compared with WT. DAPI-stained cardiomyocytes were imaged and designated as mononucleated, binucleated, or polynucleated. Nuclei count is reported as percentage of assessed cardiomyocytes. (F) RISP KO increased the total number of nuclei compared with WT. Graph represents total number of nuclei per mouse heart and distribution of those nuclei across mono-, bi-, and polynucleated cardiomyocytes. For B, C, E, and F, approximately 40–45 cardiomyocytes per mouse were measured and averaged; n = 6–10 mice per condition, mean ± SEM, unpaired 2-tailed t test. ****P < 0.0001. (G) Diagram illustrating why cardiac wall thickness did not increase markedly in RISP-KO hearts undergoing hyperplastic remodeling. Cardiomyocytes appear to divide and grow in an end-to-end direction rather than side to side (with no difference in cell lengths), resulting in greater circumference of the heart wall without a large increase in LV wall thickness, a significant increase in the widths of cells, or an increase in number of cells across the LV free wall.
Figure 4
Figure 4. Cardiac function studies.
(A) LV fractional shortening, assessed by echocardiography, decreased at 60 and 75 days after tamoxifen in RISP-KO hearts compared with WT; n = 14–31 mice per condition, mean ± SEM, 2W-ANOVA-Šidák’s. (B) LV ejection fraction decreased at 60 and 75 days after tamoxifen in RISP-KO compared with WT; n = 14–31 mice per condition, mean ± SEM, 2W-ANOVA-Šidák’s. (C) LV end-diastolic diameter increased at 60 and 75 days after tamoxifen in RISP-KO compared with WT; n = 11–20 mice per condition, mean ± SEM, 2W-ANOVA-Šidák’s. (D) LV end-systolic diameter increased at 60 and 75 days after tamoxifen in RISP-KO compared with WT; n = 11–20 mice per condition, mean ± SEM, 2W-ANOVA-Šidák’s. (E) Heart rate in RISP-WT and RISP-KO mice undergoing echocardiography at 30, 60, and 75 days after tamoxifen; n = 11–20 mice per condition, mean ± SEM, 2W-ANOVA-Šidák’s. (F) Stroke volume in RISP-WT and -KO mice at 30, 60, and 75 days after tamoxifen; n = 11–20 mice per condition, mean ± SEM, 2W-ANOVA-Šidák’s. (G) Cardiac output (product of heart rate and end-diastolic minus end-systolic diameter) was not different between RISP-WT and -KO hearts; n = 11–20 mice per condition, mean ± SEM, 2W-ANOVA-Šidák’s. (H) Hematocrit in RISP-WT and -KO mice at 30, 60, and 75 days after tamoxifen; n = 4–9 mice per condition, mean ± SEM, 2W-ANOVA-Šidák’s. **P < 0.01, ***P < 0.001, ****P < 0.0001.
Figure 5
Figure 5. New cardiomyocytes in RISP KO infiltrate regions of ischemic damage after myocardial infarction.
The left anterior descending coronary artery was permanently ligated 45 days after tamoxifen, creating a myocardial infarction (MI) in the LV. At 60 days, hearts were harvested, fixed, and serially sliced from apex to base. (A and D) Representative H&E-stained heart slices illustrating MI-induced scar regions in LV of RISP-WT and -KO mice, respectively. Scale bars: 500 μm. (B and E) Insets of A and D, respectively. ImageJ was used to trace the boundary between necrotic and non-necrotic tissue to appreciate the geometry of the necrotic tissue. Finger-like projections of dividing cardiomyocytes into the damaged tissue were observed in RISP-KO hearts (E) compared with RISP-WT hearts (B). (C and F) Representative ellipses generated by ImageJ designating the best-fit ellipse based on the boundaries traced in B and E, respectively. (G) Quantitative analysis of the smoothness of boundaries designating scar tissue, calculated by division of the measured parameters of the ellipses generated in C and F by the measured parameters traced in B and E, respectively. Boundaries traced in RISP-KO hearts were markedly rougher, with more finger-like projections into the injured regions. Injured regions were traced in 6–8 heart slices per mouse with n = 4 mice per condition, mean ± SEM, unpaired 2-tailed t test. (H) HW/BW of mice in MI studies demonstrated that MI did not affect hyperplastic remodeling induced by RISP KO; n = 4 mice per condition, mean ± SEM, unpaired 2-tailed t test. (I and J) Differences in LV ejection fraction (I) and fractional shortening (J) between RISP-WT and -KO mice were unaffected by the MI; n = 4–14 mice per condition, mean ± SEM, unpaired 2-tailed t test. **P < 0.01, ****P < 0.0001.
Figure 6
Figure 6. mTOR phosphorylation of protein targets is consistent with the observation of proliferating cardiomyocytes.
(A) Representative immunoblots of phosphorylated ribosomal S6 and ribosomal S6 from snap-frozen heart homogenates from RISP-WT and -KO mice at 60 days after tamoxifen. (B) Band density analysis of phosphorylated ribosomal S6 and ribosomal S6 from RISP-WT and -KO mice at 60 days after tamoxifen; n = 12 mice per condition, mean ± SEM, unpaired 2-tailed t test. (C) Representative immunoblots of phosphorylated S6 kinase and S6 kinase from RISP-WT and -KO mice at 60 days after tamoxifen. (D) Band density analysis of phosphorylated S6 kinase and S6 kinase from RISP-WT and -KO mice at 60 days after tamoxifen; n = 8 mice per condition, mean ± SEM, unpaired 2-tailed t test. (E) Representative immunoblots of phosphorylated Akt (p-Akt) and total Akt from RISP-WT and -KO mice at 60 days after tamoxifen. (F) Band density analysis of p-Akt and total Akt from RISP-WT and -KO mice at 60 days after tamoxifen; n = 4 mice per condition, mean ± SEM, unpaired 2-tailed t test. *P < 0.05, **P < 0.01, ****P < 0.0001.
Figure 7
Figure 7. Transcriptomic responses in RISP-WT and -KO hearts at 60 days after tamoxifen.
(A) Principal component analysis of RNA-Seq data from RISP-WT and -KO hearts. (B) K-means clustering of gene expression values for 1,355 differentially expressed genes in RISP WT (n = 4 mice, left columns) and KO (n = 4 mice, right columns) (adjusted P < 0.05, edgeR analysis) (red: increased expression relative to blue).
Figure 8
Figure 8. Decline in cardiac function because of decreased expression of proteins sustaining contractility.
(A) Ca2+ measurements in paced cardiomyocytes revealed that the initial rise in Ca2+ was indistinguishable between RISP-WT and -KO mice. However, sequestration of Ca2+ was faster in the KO cardiomyocytes compared with WT. Further analysis of Ca2+ dynamics is presented in Supplemental Figure 9, A–H. (B) Immunoblotting for MyLK3 protein revealed a decrease in RISP-KO compared with WT hearts at 60 days after tamoxifen. (C) Band density analysis of immunoblots of MyLK3 and GAPDH in RISP-WT and -KO hearts at 60 days after tamoxifen; n = 7 mice per condition, mean ± SEM, unpaired 2-tailed t test. ***P < 0.001.
Figure 9
Figure 9. Metabolomic responses in RISP-WT and -KO hearts at 60 days after tamoxifen.
(A) Analysis of glycolytic and TCA cycle biomolecules revealed significant increases in glycolytic intermediates (red) and decreased abundance of TCA cycle components (green) in RISP-KO compared with WT hearts (P < 0.05, 2-tailed Welch’s 2-sample t test). (B) Analysis of biomolecules involved in membrane synthesis revealed increases in phosphatidylcholine and phosphatidylethanolamine (red), along with decreases in substrates feeding into their synthesis (green), in RISP-KO compared with WT hearts (P < 0.05, 2-tailed Welch’s 2-sample t test). (C) Analysis of polyamines revealed increases in putrescine, spermidine, 5-methylthioadenosine (MTA), and N-acetylspermidine (red) in RISP-KO compared with WT hearts (P < 0.05, 2-tailed Welch’s 2-sample t test). (D) Analysis of fatty acid oxidation intermediates revealed increases in acyl-carnitines (red) in RISP-KO compared with WT hearts (P < 0.05, 2-tailed Welch’s 2-sample t test). (E) Scaled ratio of biochemical factors that promote DNA methylation in RISP-WT (blue) and -KO hearts (red); n = 8 mice per condition, mean ± SEM, unpaired 2-tailed t test. *P < 0.05, **P < 0.01, ****P < 0.0001.
Figure 10
Figure 10. Epigenetic analysis of RISP-WT and -KO hearts.
(A) Left: Cumulative distribution of DNA CpG methylation in RISP-WT (blue) and -KO (red) hearts. Right: Box-and-whisker plot showing significant increase in DNA CpG methylation (DMC) in RISP-KO compared with WT hearts (P < 0.0001, Kolmogorov-Smirnov test). Box plots show the interquartile range, median (line), and minimum and maximum (whiskers). (B) Venn diagram comparing differentially expressed genes (DEGs) and differentially methylated DNA CpG sites located in regulatory regions of genes reveals an overlap of 115 genes. (C) K-means clustering of RNA-Seq identification of 115 DEG and DMC genes showing directional change (upregulated, red, versus downregulated, blue) in RISP-KO (n = 4) versus WT hearts (n = 4). (D) K-means clustering after filtering was applied to restrict the data set to CpGs with 25% higher methylation in lower expression groups compared with higher expression groups. This identified 93 DEG and DMC genes in RISP-KO (n = 4) versus WT hearts. (E) DNA CpG methylation status of 93 DEGs and DMCs showing that downregulated genes are more highly methylated (green) in regulatory regions, while upregulated genes are less highly methylated (violet), in RISP KO compared with WT. For CE, DEGs were determined by a generalized linear model and ANOVA-like testing with FDR q value less than 0.05, and DMCs were determined by a β-binomial regression model with an arcsine link function fitted using the generalized least-squares method and Wald test FDR q value less than 0.05.

References

    1. Chandel NS, et al. Mitochondrial reactive oxygen species trigger hypoxia-induced transcription. Proc Natl Acad Sci U S A. 1998;95(20):11715–11720. doi: 10.1073/pnas.95.20.11715. - DOI - PMC - PubMed
    1. Chen WW, et al. Absolute quantification of matrix metabolites reveals the dynamics of mitochondrial metabolism. Cell. 2016;166(5):1324–1337. doi: 10.1016/j.cell.2016.07.040. - DOI - PMC - PubMed
    1. Raffaello A, et al. Calcium at the center of cell signaling: interplay between endoplasmic reticulum, mitochondria, and lysosomes. Trends Biochem Sci. 2016;41(12):1035–1049. doi: 10.1016/j.tibs.2016.09.001. - DOI - PMC - PubMed
    1. Berendzen KM, et al. Neuroendocrine coordination of mitochondrial stress signaling and proteostasis. Cell. 2016;166(6):1553–1563. doi: 10.1016/j.cell.2016.08.042. - DOI - PMC - PubMed
    1. Yun J, Finkel T. Mitohormesis. Cell Metab. 2014;19(5):757–766. doi: 10.1016/j.cmet.2014.01.011. - DOI - PMC - PubMed