. 2024 Sep 2;120(10):1202-1217.
doi: 10.1093/cvr/cvae093.

Adenosine kinase inhibition protects mice from abdominal aortic aneurysm via epigenetic modulation of VSMC inflammation

Affiliations

Adenosine kinase inhibition protects mice from abdominal aortic aneurysm via epigenetic modulation of VSMC inflammation

Jiean Xu et al. Cardiovasc Res. .

Abstract

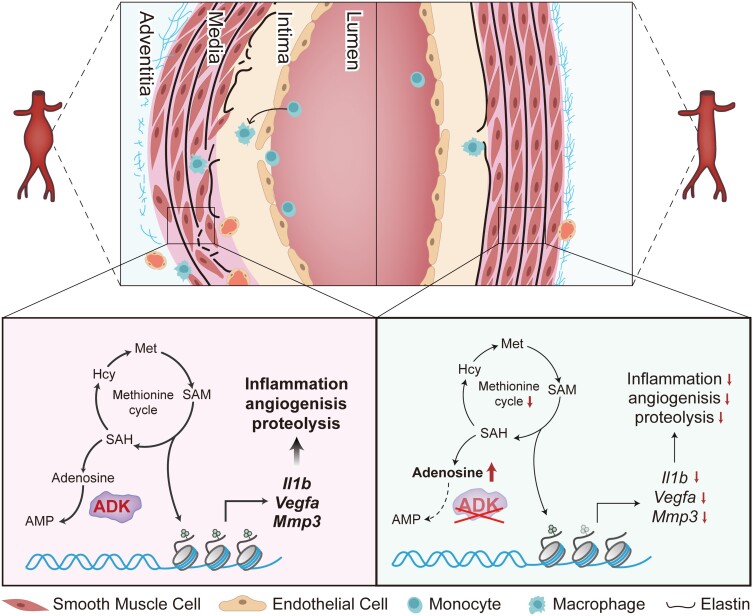
Aims: Abdominal aortic aneurysm (AAA) is a common, serious vascular disease with no effective pharmacological treatment. The nucleoside adenosine plays an important role in modulating vascular homeostasis, which prompted us to determine whether adenosine kinase (ADK), an adenosine metabolizing enzyme, modulates AAA formation via control of the intracellular adenosine level, and to investigate the underlying mechanisms.

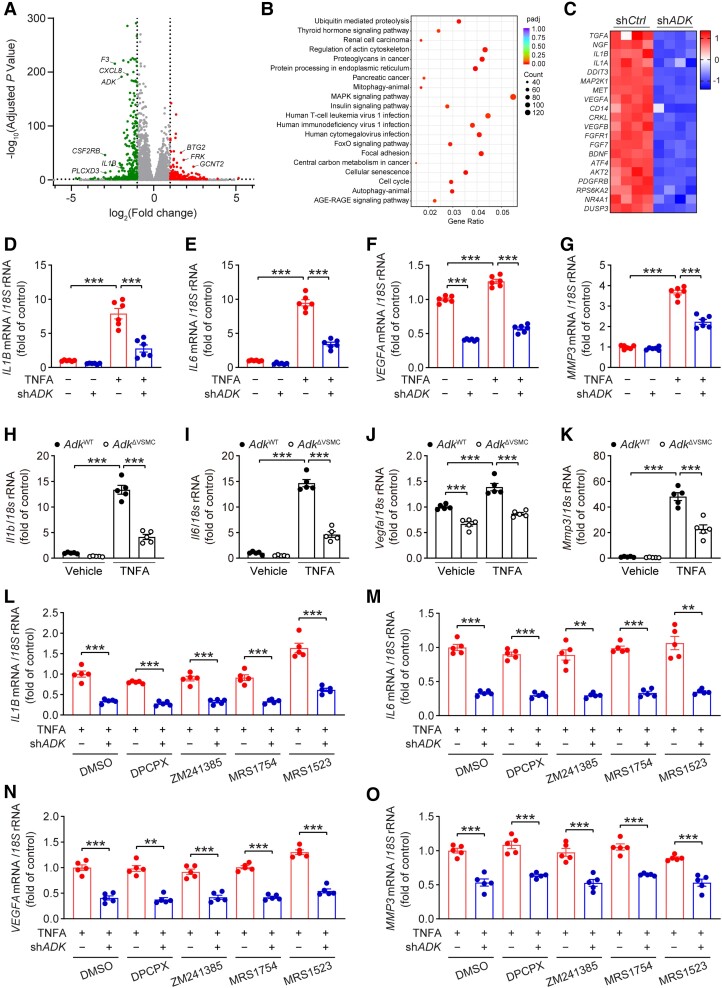
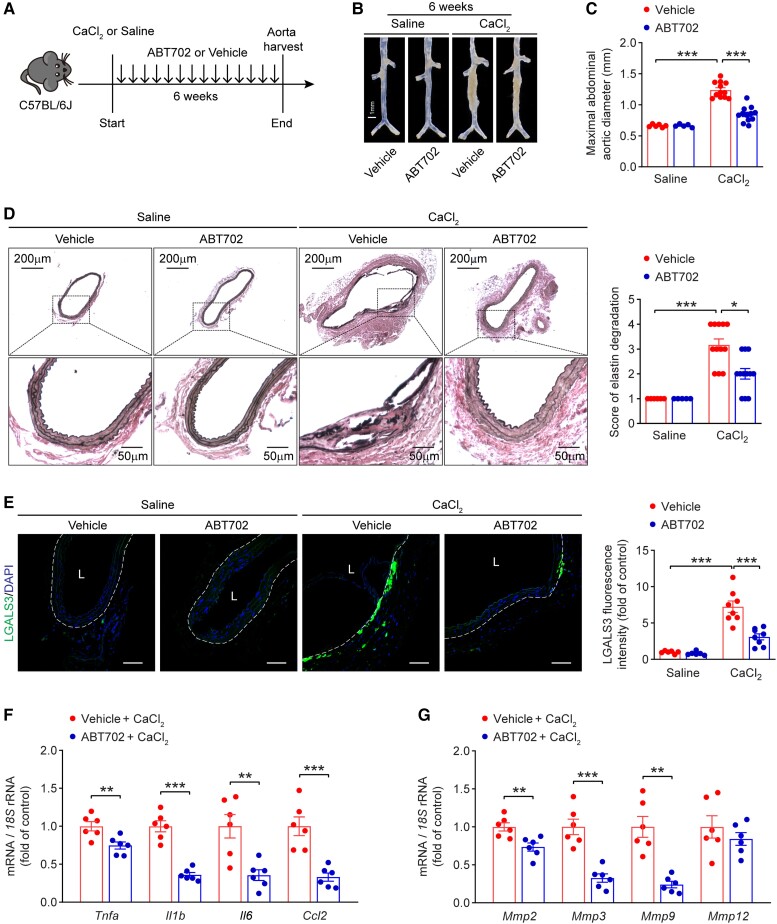
Methods and results: We used a combination of genetic and pharmacological approaches in murine models of AAA induced by calcium chloride (CaCl2) application or angiotensin II (Ang II) infusion to study the role of ADK in the development of AAA. In vitro functional assays were performed by knocking down ADK with adenovirus-short hairpin RNA in human vascular smooth muscle cells (VSMCs), and the molecular mechanisms underlying ADK function were investigated using RNA-sequencing, isotope tracing, and chromatin immunoprecipitation quantitative polymerase chain reaction (ChIP-qPCR). The heterozygous deficiency of ADK protected mice from CaCl2- and Ang II-induced AAA formation. Moreover, specific knockout of ADK in VSMCs prevented Ang II-induced AAA formation, as evidenced by reduced aortic extracellular elastin fragmentation, neovascularization, and aortic inflammation. Mechanistically, ADK knockdown in VSMCs markedly suppressed the expression of inflammatory genes associated with AAA formation, and these effects were independent of adenosine receptors. The metabolic flux and ChIP-qPCR results showed that ADK knockdown in VSMCs decreased S-adenosylmethionine (SAM)-dependent transmethylation, thereby reducing H3K4me3 binding to the promoter regions of the genes that are associated with inflammation, angiogenesis, and extracellular elastin fragmentation. Furthermore, the ADK inhibitor ABT702 protected mice from CaCl2-induced aortic inflammation, extracellular elastin fragmentation, and AAA formation.

Conclusion: Our findings reveal a novel role for ADK inhibition in attenuating AAA via epigenetic modulation of key inflammatory genes linked to AAA pathogenesis.

Keywords: Abdominal aortic aneurysm; Adenosine kinase; Histone methylation; Inflammation; Smooth muscle cells.


Conflict of interest statement

Conflict of interest: none declared.

Figures

Graphical Abstract
Graphical Abstract
Figure 1
Figure 1
ADK deficiency inhibits CaCl2-induced AAA formation in mice. (A) Experimental schematic representation of CaCl2-induced AAA in male ADK+/+/Rosa26Cre/ERT2 and ADKF/+/Rosa26Cre/ERT2 mice. (B) Representative images of abdominal aortas from ADK+/+/Rosa26Cre/ERT2 and ADKF/+/Rosa26Cre/ERT2 mice at 6 weeks after saline or CaCl2 application. (C) Maximal abdominal aortic diameter in ADK+/+/Rosa26Cre/ERT2 and ADKF/+/Rosa26Cre/ERT2 mice at 6 weeks after saline or CaCl2 application (n = 5–12). (D) Representative staining with elastin (left) and elastin fragmentation score (right) in abdominal aortas from ADK+/+/Rosa26Cre/ERT2 and ADKF/+/Rosa26Cre/ERT2 mice at 6 weeks after saline or CaCl2 application (n = 5–12). (E) Representative images (left) and quantification (right) of LGALS3 immunofluorescent staining of abdominal aortas from ADK+/+/Rosa26Cre/ERT2 and ADKF/+/Rosa26Cre/ERT2 mice at 6 weeks after CaCl2 application (n = 5–6), L: lumen, scale bar = 50 μm. (F, G) qPCR analysis of inflammatory cytokines (F) and MMPs (G) in abdominal aortas from ADK+/+/Rosa26Cre/ERT2 and ADKF/+/Rosa26Cre/ERT2 mice at 6 weeks after CaCl2 application (n = 6). Two-way ANOVA followed by Tukey post hoc test for (C) and (E), Kruskal–Wallis test followed by Dunn’s post hoc test for (D), two-tailed unpaired Student’s t-test for (F) and (G, Mmp2), two-tailed unpaired Student’s t-test with Welch’s correction for (G, Mmp3, and Mmp9), and Mann–Whitney U test for (G, Mmp12). All data are represented as mean ± SEM. *P < 0.05, **P < 0.01, and ***P < 0.001 for indicated comparisons.
Figure 2
Figure 2
ADK deficiency suppresses Ang II-induced AAA formation in Apoe−/− mice. (A) Systolic blood pressure of male ADK+/+/Rosa26Cre/ERT2/Apoe−/− and ADKF/+/Rosa26Cre/ERT2/Apoe−/− mice during Ang II infusion (n = 6–9). (B) The incidence of Ang II-induced AAA in male ADK+/+/Rosa26Cre/ERT2/Apoe−/− and ADKF/+/Rosa26Cre/ERT2/Apoe−/− mice (n = 10–12). (C) Representative images of whole aortas from male ADK+/+/Rosa26Cre/ERT2/Apoe−/− and ADKF/+/Rosa26Cre/ERT2/Apoe−/− mice following 4 weeks of saline or Ang II infusion. (D) Maximal abdominal aortic diameter in male ADK+/+/Rosa26Cre/ERT2/Apoe−/− and ADKF/+/Rosa26Cre/ERT2/Apoe−/− mice following 4 weeks of saline or Ang II infusion (n = 8–12). (E) Representative staining with elastin (left) and elastin fragmentation score (right) in abdominal aortas from male ADK+/+/Rosa26Cre/ERT2/Apoe−/− and ADKF/+/Rosa26Cre/ERT2/Apoe−/− mice following 4 weeks of saline or Ang II infusion (n = 5–12). (F) Representative images (left) and quantification (right) of LGALS3 immunofluorescent staining of abdominal aortas from male ADK+/+/Rosa26Cre/ERT2/Apoe−/− and ADKF/+/Rosa26Cre/ERT2/Apoe−/− mice following 4 weeks of saline or Ang II infusion (n = 6–8), L: lumen, scale bar = 50 μm. (G, H) qPCR analysis of inflammatory cytokines (G) and MMPs (H) in abdominal aortas from male ADK+/+/Rosa26Cre/ERT2/Apoe−/− and ADKF/+/Rosa26Cre/ERT2/Apoe−/− mice following 4 weeks of Ang II infusion (n = 6). Mixed-effects model followed by Bonferroni’s post hoc test for (A), two-sided Fisher’s exact test for (B), two-way ANOVA followed by Tukey post hoc test for (D) and (F), Kruskal–Wallis test followed by Dunn’s post hoc test for (E), two-tailed unpaired Student’s t-test for (G, Tnfa, Il6, and Ccl2) and (H), and two-tailed unpaired Student’s t-test with Welch’s correction for (G, Il1b). All data are represented as mean ± SEM *P < 0.05, **P < 0.01, and ***P < 0.001 for indicated comparisons.
Figure 3
Figure 3
ADK deficiency in VSMCs reduces Ang II-induced AAA formation in Apoe−/− mice. (A) Uniform Manifold Approximation and Projection visualization of cell types present in mouse infrarenal abdominal aortas treated with elastase for 0, 7, and 14 days (left) and the expression of ADK (middle) and Myh11 (right) revealed by scRNA-seq (GSE152583). (B) Representative images (left) of triple immunofluorescence for ADK, ACTA2, and nuclei (DAPI, 4',6-diamidino-2-phenylindole), and quantification (right) of ADK expression in the media and the adventitia of abdominal aortas from male Apoe−/− mice after 4 weeks of Ang II infusion (n = 8), L: lumen, scale bar = 50 μm. (C) Representative images of triple immunofluorescence for ADK, ACTA2, and nuclei (DAPI) on sections of human AAA, scale bar = 20 μm. (D) The survival curve of Ang II-induced AAA in ADKWT/Apoe−/− and ADKΔVSMC/Apoe−/− mice (n = 31–32). (E) The incidence of Ang II-induced AAA in male ADKWT/Apoe−/− and ADKΔVSMC/Apoe−/− mice (n = 10–15). (F, G) Representative colour Doppler ultrasound images of aortic flow (F) and M-mode pictures of abdominal aortas (G) from male ADKWT/Apoe−/− and ADKΔVSMC/Apoe−/− mice following 4 weeks of saline or Ang II infusion. (H) Representative images of whole aortas from male ADKWT/Apoe−/− and ADKΔVSMC/Apoe−/− mice following 4 weeks of saline or Ang II infusion. (I) Maximal abdominal aortic diameter in male ADKWT/Apoe−/− and ADKΔVSMC/Apoe−/− mice following 4 weeks of saline or Ang II infusion (n = 6–15). Two-tailed unpaired Student’s t-test for (B), Mantel–Cox test for (D), two-sided Fisher’s exact test for (E), and Kruskal–Wallis test followed by Dunn’s post hoc test for (I). All data are represented as mean ±SEM *P < 0.05 and ***P < 0.001 for indicated comparisons.
Figure 4
Figure 4
Vascular smooth muscle cell-specific ADK ablation decreases Ang II-induced abdominal aortic pathological changes in Apoe−/− mice. (A) Representative staining with elastin (left) and elastin fragmentation score (right) in abdominal aortas from male ADKWT/Apoe−/− and ADKΔVSMC/Apoe−/− mice following 4 weeks of saline or Ang II infusion (n = 5–8). (BD) Representative images (left) and corresponding quantification (right) of PECAM1 (B), CD68 (C), and MMP3 (D) immunofluorescent staining of abdominal aortas from male ADKWT/Apoe−/− and ADKΔVSMC/Apoe−/− mice after 4 weeks of saline or Ang II infusion (n = 5–8), L: lumen, scale bar = 50 μm. (E) MMP3 catalytic activity in abdominal aortas from male ADKWT/Apoe−/− and ADKΔVSMC/Apoe−/− mice after 4 weeks of saline or Ang II infusion (n = 5). (FH) qPCR analysis of Mmp3 (F), Il1b (G), and Il6 (H) in abdominal aortas from male ADKWT/Apoe−/− and ADKΔVSMC/Apoe−/− mice following 4 weeks of Ang II infusion (n = 6). Kruskal–Wallis test followed by Dunn’s post hoc test for (A), two-way ANOVA followed by Tukey post hoc test for (B–D), Brown–Forsythe ANOVA and Welch’s ANOVA test with Dunnett’s T3 multiple comparison for (E), and two-tailed unpaired Student’s t-test for (F–H). All data are represented as mean ±SEM *P < 0.05, **P < 0.01, and ***P < 0.001 for indicated comparisons.
Figure 5
Figure 5
ADK knockdown attenuates inflammatory responses in HASMCs independent of adenosine receptors. (A) Volcano plot with up- or down-regulated genes in ADK-knockdown HASMCs highlighted in red or green, respectively. (B) Scatter plot of the top 20 KEGG pathways of all DEGs in ADK-knockdown HASMCs. The colour of the dot represents the adjusted P value, and the size of the dot represents the number of DEGs. (C) Heatmap analysis of the top 20 down-regulated genes in the MAPK signalling pathway in ADK-knockdown HASMCs. (D) qPCR analysis of mRNA levels of IL1B, (E)IL6, (F) VEGFA, and (G) MMP3 in TNFA-treated (10 ng/mL for 12 h) control and ADK-knockdown HASMCs (n = 6). (H) qPCR analysis of mRNA levels of Il1b, (I) Il6, (J) Vegfa, and (K) Mmp3 in TNFA-treated (10 ng/mL for 24 h) control and Adk-knockout abdominal aortic SMCs (n = 5). (L) qPCR analysis of mRNA levels of IL1B, (M) IL6, (N) VEGFA , and (O) MMP3 in TNFA-treated (10 ng/mL for 12 h) control or ADK-knockdown HASMCs pre-treated for 30 min with 5 μM DPCPX, 5 μM ZM241385, 5 μM MRS1754, or 5 μM MRS1523 (n = 5). Two-way ANOVA followed by Tukey post hoc test for (D–K), two-tailed unpaired Student’s t-test for (L, DPCPX, ZM241385, and MRS1523), (M, DMSO (dimethyl sulfoxide), DPCPX, and MRS1754), (N, DMSO, ZM241385, MRS1754, and MRS1523), and (O, DMSO, ZM241385, and MRS1523), two-tailed unpaired Student’s t-test with Welch’s correction for (L, DMSO, and MRS1754), (M, ZM241385, and MRS1523), and (O, DPCPX, and MRS1754), and Mann–Whitney U test for (N, DPCPX). All data are represented as mean ± SEM **P < 0.01 and ***P < 0.001 for indicated comparisons.
Figure 6
Figure 6
ADK knockdown decreases inflammatory responses in HASMCs via histone methylation. (A) Liquid chromatography–mass spectrometry (LC–MS) analysis of intracellular methionine, (B) SAM, (C) SAH, and (D) SAM/SAH in HASMCs treated with TNFA (10 ng/mL) for 4 h (n = 3). (E) Schematic diagram of the expected isotopologues of methionine cycle metabolites produced during 13C6-glucose tracing. The transmethylation of SAM can be monitored with the ratio of labelled SAH (m + 5) to labelled SAM (m + 5). (F–G) Mass isotopomer distribution of adenosine (m + 5) (F) and the SAH (m + 5):SAM (m + 5) ratio (G) in control or ADK-knockdown HASMCs treated with or without TNFA (10 ng/mL) for 4 h in a medium containing 13C6-glucose (22 mM) (n = 3). (H–L) Representative western blot results of H3K4me3, H3K9me2, H3K36me2, H3K79me3, and total H3 (H) in TNFA-treated (10 ng/mL for 4 h) control or ADK-knockdown HASMCs and relative ratio of H3K4me3/H3 (I), H3K9me2/H3 (J), H3K36me2/H3 (K), and H3K79me3/H3 (L) were quantitated by densitometric analysis of the corresponding western blots (n = 6). (M–P) ChIP analysis of H3K4me3 on promoter of IL1B (M), IL6 (N), VEGFA (O), and MMP3 (P) in TNFA-treated (10 ng/mL for 4 h) control or ADK-knockdown HASMCs. Enrichment of the indicated gene promoters was assessed by qPCR (n = 5). (Q) Representative images (left) and quantification (right) of H3K4me3 immunofluorescent staining of abdominal aortas from ADKWT/Apoe−/− and ADKΔVSMC/Apoe−/− mice after 7 days of Ang II infusion (n = 5), L: lumen, scale bar = 50 μm. Two-tailed unpaired Student’s t-test for (A–D), (G), (I–M), (O), and (Q), one-way ANOVA with Bonferroni’s post hoc test for (F), and two-tailed unpaired Student’s t-test with Welch’s correction for (N) and (P). All data are represented as mean ± SEM *P < 0.05, **P < 0.01, and ***P < 0.001 for indicated comparisons.
Figure 7
Figure 7
Adenosine kinase inhibitor ABT702 reduces CaCl2-induced AAA in mice. (A) Experimental schematic representation of CaCl2-induced AAA in wild-type male mice treated with vehicle or ABT702. (B) Representative images of abdominal aortas from vehicle- and ABT702-treated mice at 6 weeks after saline or CaCl2 application. (C) Maximal abdominal aortic diameter in vehicle- and ABT702-treated mice at 6 weeks after saline or CaCl2 application (n = 5–12). (D) Representative staining with elastin (left) and elastin fragmentation score (right) in abdominal aortas from vehicle- and ABT702-treated mice at 6 weeks after saline or CaCl2 application (n = 5–12). (E) Representative images of LGALS3 immunofluorescent staining (left) and quantification of LGALS3+ cells (right) in abdominal aortas from vehicle- and ABT702-treated mice at 6 weeks after saline or CaCl2 application (n = 6–8), L: lumen, scale bar = 50 μm. (F) qPCR analysis of inflammatory cytokines and (G) MMPs in abdominal aortas from vehicle- and ABT702-treated mice at 6 weeks after CaCl2 application (n = 6). Two-way ANOVA followed by Tukey post hoc test for (C) and (E), Kruskal–Wallis test followed by Dunn’s post hoc test for (D), two-tailed unpaired Student’s t-test for (F) and (G, Mmp2, Mmp3, and Mmp12), and two-tailed unpaired Student’s t-test with Welch’s correction for (G, Mmp9). All data are represented as mean ± SEM *P < 0.05, **P < 0.01, and ***P < 0.001 for indicated comparisons.

References

    1. Nordon IM, Hinchliffe RJ, Loftus IM, Thompson MM. Pathophysiology and epidemiology of abdominal aortic aneurysms. Nat Rev Cardiol 2011;8:92–102. - PubMed
    1. Golledge J. Abdominal aortic aneurysm: update on pathogenesis and medical treatments. Nat Rev Cardiol 2019;16:225–242. - PubMed
    1. Sakalihasan N, Michel JB, Katsargyris A, Kuivaniemi H, Defraigne JO, Nchimi A, Powell JT, Yoshimura K, Hultgren R. Abdominal aortic aneurysms. Nat Rev Dis Primers 2018;4:34. - PubMed
    1. Newby D, Forsythe R, McBride O, Robson J, Vesey A, Chalmers R, Burns P, Garden OJ, Semple S, Dweck M, Gray C, MacGillivray T, Wang C, Koutraki YG, Mitchard N, Cooper A, van Beek E, McKillop G, Ho W, Fraser L, Cuthbert H, Hoskins P, Doyle B, Conlisk N, Stuart W, Berry C, Roditi G, Murdoch L, Holdsworth R, Scott E, Milne L, Strachan F, Wee F, Oatey K, Graham C, Murray G, Milne G, Bucukoglu M, Goodman K, Kaczynski J, Shah A, Tambyraja A, Brittenden J, Houston G, Lambie R, Norrie J. Aortic wall inflammation predicts abdominal aortic aneurysm expansion, rupture, and need for surgical repair. Circulation 2017;136:787–797. - PMC - PubMed
    1. Rush C, Nyara M, Moxon JV, Trollope A, Cullen B, Golledge J. Whole genome expression analysis within the angiotensin II-apolipoprotein E deficient mouse model of abdominal aortic aneurysm. BMC Genomics 2009;10:298. - PMC - PubMed

Publication types

MeSH terms