. 2024 May 9;20(5):e1012214.
doi: 10.1371/journal.ppat.1012214. eCollection 2024 May.

Serine protease Rv2569c facilitates transmission of Mycobacterium tuberculosis via disrupting the epithelial barrier by cleaving E-cadherin

Affiliations

Serine protease Rv2569c facilitates transmission of Mycobacterium tuberculosis via disrupting the epithelial barrier by cleaving E-cadherin

Xinxin Zang et al. PLoS Pathog. .

Abstract

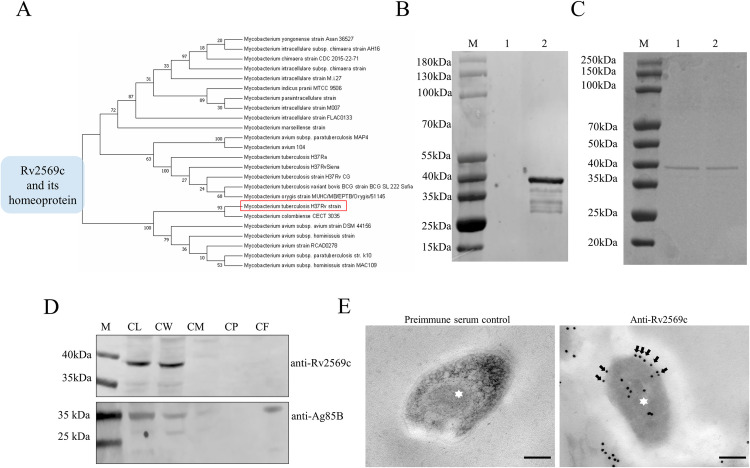
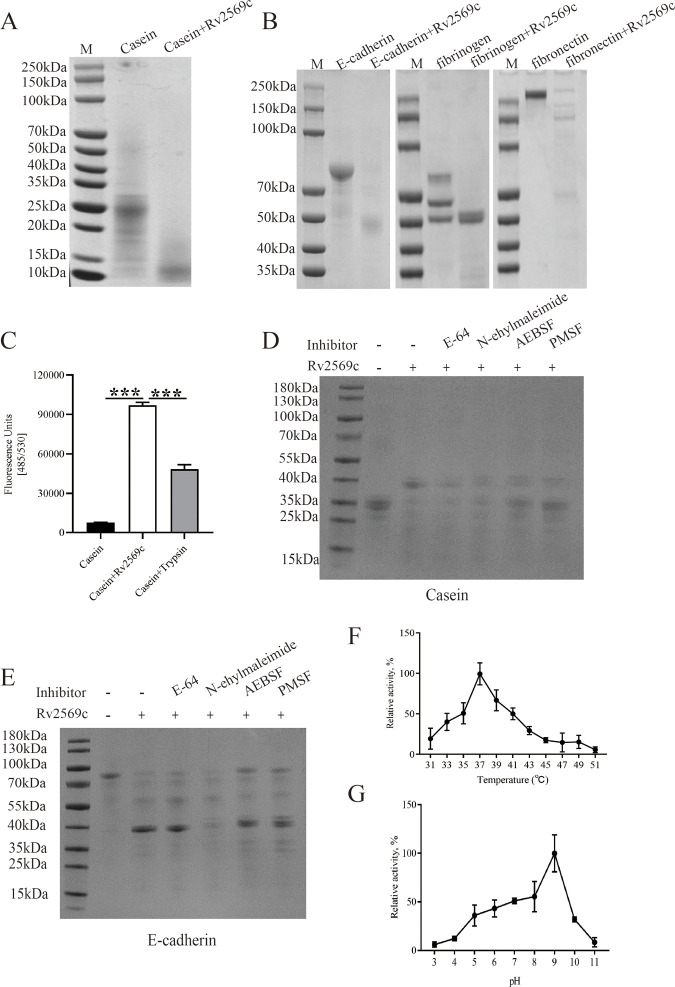
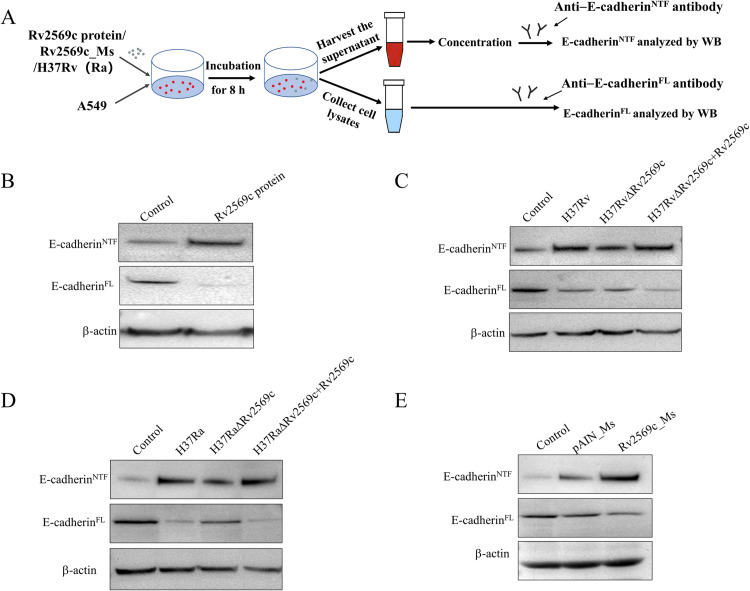
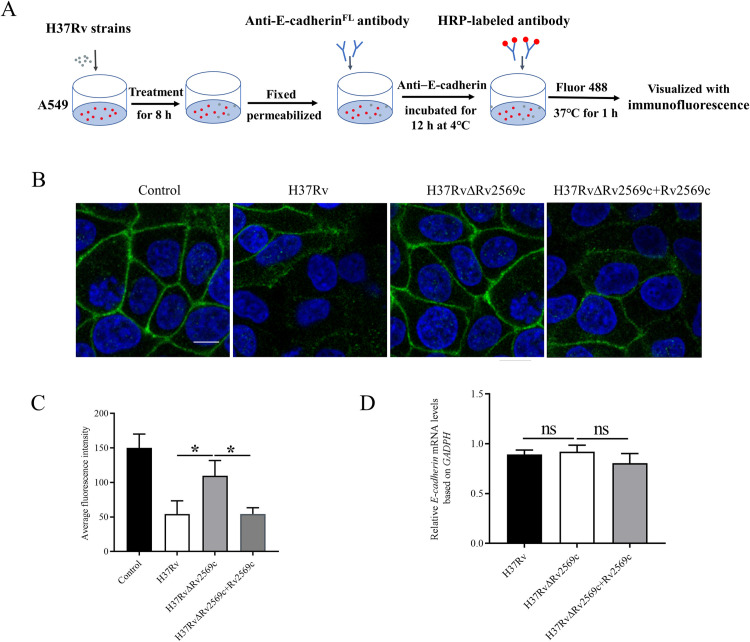
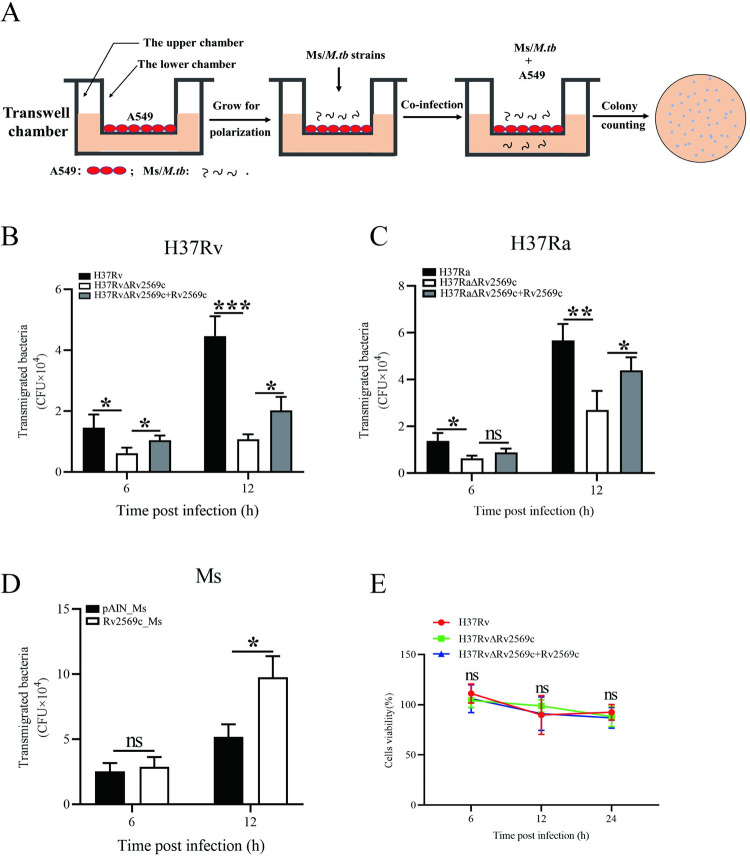
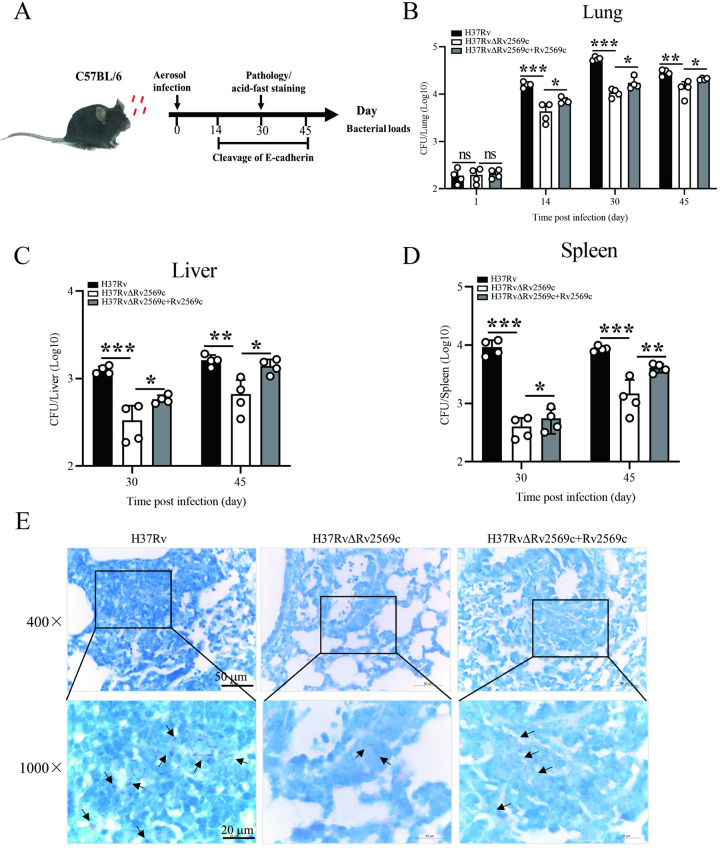
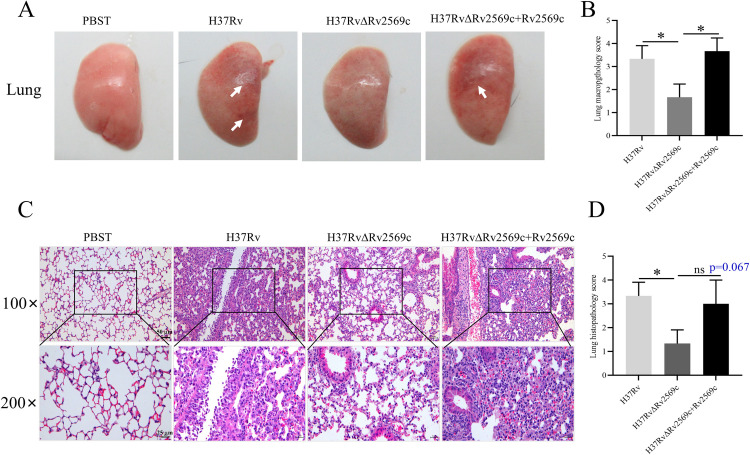
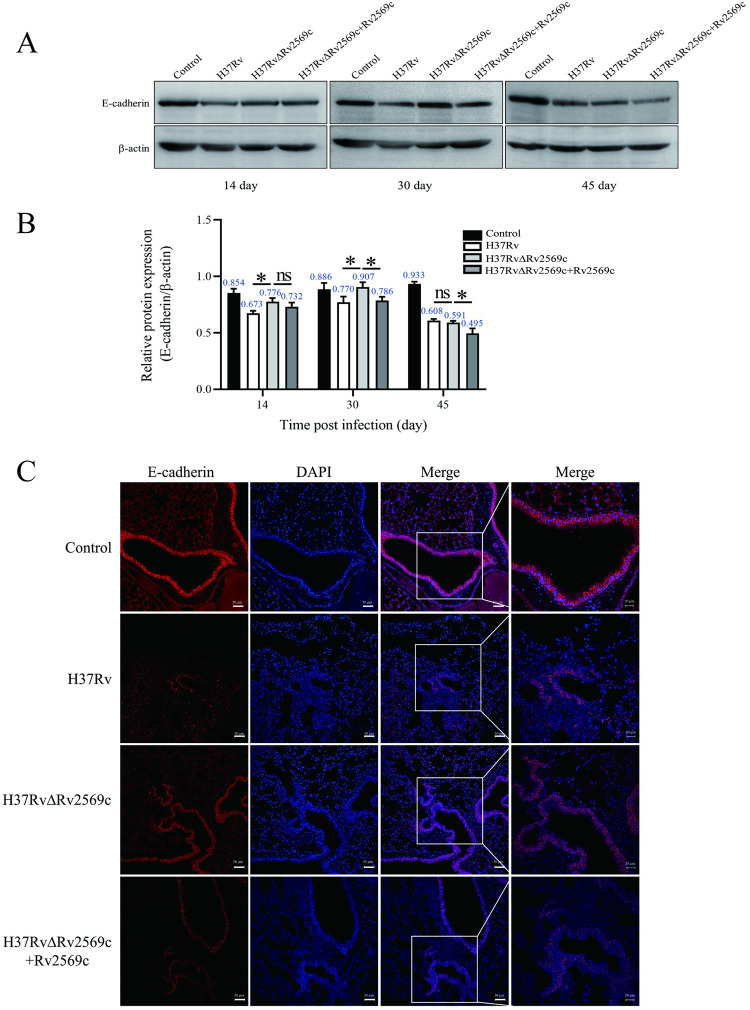
Epithelial cells function as the primary line of defense against invading pathogens. However, bacterial pathogens possess the ability to compromise this barrier and facilitate the transmigration of bacteria. Nonetheless, the specific molecular mechanism employed by Mycobacterium tuberculosis (M.tb) in this process is not fully understood. Here, we investigated the role of Rv2569c in M.tb translocation by assessing its ability to cleave E-cadherin, a crucial component of cell-cell adhesion junctions that are disrupted during bacterial invasion. By utilizing recombinant Rv2569c expressed in Escherichia coli and subsequently purified through affinity chromatography, we demonstrated that Rv2569c exhibited cell wall-associated serine protease activity. Furthermore, Rv2569c was capable of degrading a range of protein substrates, including casein, fibrinogen, fibronectin, and E-cadherin. We also determined that the optimal conditions for the protease activity of Rv2569c occurred at a temperature of 37°C and a pH of 9.0, in the presence of MgCl2. To investigate the function of Rv2569c in M.tb, a deletion mutant of Rv2569c and its complemented strains were generated and used to infect A549 cells and mice. The results of the A549-cell infection experiments revealed that Rv2569c had the ability to cleave E-cadherin and facilitate the transmigration of M.tb through polarized A549 epithelial cell layers. Furthermore, in vivo infection assays demonstrated that Rv2569c could disrupt E-cadherin, enhance the colonization of M.tb, and induce pathological damage in the lungs of C57BL/6 mice. Collectively, these results strongly suggest that M.tb employs the serine protease Rv2569c to disrupt epithelial defenses and facilitate its systemic dissemination by crossing the epithelial barrier.


Conflict of interest statement

The authors have declared that no competing interests exist.

Figures

Fig 1
Fig 1. Purification, identification, and subcellular localization of the Rv2569c protein.
(A) Phylogenetic tree analysis of the Rv2569c protein using MEGA 7 software. (B) Identification of the Rv2569c protein by western blot. Lane M: protein marker; Lane 1: induced empty vector pET-28a; Lane 2: induced pET28a-Rv2569c. (C) Ni-column affinity chromatography purification of the Rv2569c protein by SDS-PAGE. Lane M: protein marker; Lanes 1 and 2: purified Rv2569c protein. (D) Subcellular localization of the Rv2569c protein in H37Rv. CL: whole bacterial component; CW: cell wall; CM: cell membrane; CP: cytoplasm; CF: culture supernatant. (E) Immunoelectron microscopy analysis of Rv2569c of H37Rv cells on ultrathin sections. Pre-immune serum served as negative control for the anti-Rv2569c antibody. Asterisks represent the H37Rv cells. Arrows represent the Rv2569c protein. Scale bars, 200 nm.
Fig 2
Fig 2. Characterization of the Rv2569c protease activity.
(A) The protease activity of Rv2569c was evaluated by digesting casein as the substrate. (B) Various protein substrates (E-cadherin, fibrinogen, and fibronectin) were degraded by purified Rv2569c protein. (C) Quantitative analysis of FITC-labeled casein digestion by Rv2569c protein. Trypsin was considered as a positive control. (D) and (E) The category of Rv2569c protease was determined by incubating casein or E-cadherin with different chemical inhibitors. (F) The effect of temperature on the activity of Rv2569c protease was analyzed quantitatively by spectrophotometry. (G) The effect of pH on the activity of Rv2569c protease was analyzed quantitatively by spectrophotometry. The error bars represent the SEM of three independent experiments. One-way ANOVA, followed by Bonferronis multiple-comparison post-hoc test (***P < 0.001). All assays were repeated three times.
Fig 3
Fig 3. Rv2569c serine protease cleaves E-cadherin of A549 cells in vitro.
(A) Schematic representation of Rv2569c treatment of A549 cells. After 8 h, concentrated supernatant and cell lysates were analyzed by western blot using an anti–E-cadherin antibody. E-cadherinFL: the full-length E-cadherin in the cell lysates; E-cadherinNTF: the soluble extracellular E-cadherin fragment. (B) The cleavage of E-cadherin of A549 cells was detected by western blot after treatment with 1 μM Rv2569c protein for 8 h. (C) The cleavage of E-cadherin of A549 cells was detected by western blot after infection with wild-type strain (H37Rv), Rv2569c-deletion mutant (H37RvΔRv2569c), and complementation of H37RvΔRv2569c (H37RvΔRv2569c + Rv2569c) strains (MOI = 10) for 8 h. (D) The cleavage of E-cadherin of A549 cells was detected by western blot after infection with H37Ra, H37RaΔRv2569c, and H37RaΔRv2569c + Rv2569c (MOI = 10) for 8 h. (E) The cleavage of E-cadherin of A549 cells was detected by western blot after infection with pAIN_Ms and Rv2569c_Ms strains (MOI = 10) for 8 h. All assays were repeated three times.
Fig 4
Fig 4. Visualization of E-cadherin degradation by immunofluorescence micrographs in vitro.
(A) Schematic representation of immunofluorescence observation on A549 cells infected with H37Rv strains. (B) The destruction of E-cadherin was visualized by confocal micrographs with anti–E-cadherin (green) and nuclear staining with DAPI (blue). A549 cells were infected with H37Rv, H37RvΔRv2569c, or H37RvΔRv2569c + Rv2569c for 8 h to observe the destruction of E-cadherin in A549 cells by fluorescence micrographs. Untreated A549 cells were used as the negative control. Scale bars, 10 μm. (C) Total fluorescence intensity of E-cadherin in A549 cells was quantified by Image J (n = 100 in triplicate). (D) Relative E-cadherin mRNA levels were measured by qRT-PCR after infection with H37Rv, H37RvΔRv2569c, or H37RvΔRv2569c + Rv2569c strains for 8 h. The error bars represent the SEM of three independent experiments. One-way ANOVA, followed by Bonferronis multiple-comparison post-hoc test (*P < 0.05, ns: nonsignificant).
Fig 5
Fig 5. Rv2569c contributes to the translocation of M.tb from cell to cell.
(A) Schematic representation of bacterial translocation is shown. A549 cells were grown to form confluent monolayers and then incubated for another 5 days to allow for cell polarization. Subsequently, they were infected with H37Rv strains (MOI = 10), H37Ra strains (MOI = 10), or recombinant Ms strains (MOI = 10) for 6 and 12 h. Transmigrated bacteria were measured in the lower chamber by counting colony-forming units (CFUs) on 7H10 agar plates. (B) Transmigrated bacteria were evaluated in the lower chamber after infection with H37Rv, H37RvΔRv2569c, and H37RvΔRv2569c + Rv2569c. (C) Transmigrated bacteria were counted in the lower chamber after infection with H37Ra, H37RaΔRv2569c, and H37RaΔRv2569c + Rv2569c. (D) Transmigrated bacteria were counted in the lower chamber after infection with pAIN_Ms and Rv2569c_Ms. (E) Cell viability of A549 cells was evaluated by the CCK-8 assay after infection with H37Rv, H37RvΔRv2569c, and H37RvΔRv2569c + Rv2569c for 6, 12, and 24 h. The error bars represent the SEM of three independent experiments. Two-way ANOVA, followed by Bonferronis multiple-comparison post-hoc test (*P < 0.05, **P < 0.01, ns: nonsignificant). All assays were repeated three times.
Fig 6
Fig 6. Rv2569c promotes bacterial dissemination in vivo.
(A) Schematic diagram of H37Rv strains challenge timeline. C57BL/6 mice (n = 4) were aerosol-infected with roughly 200 CFUs of H37Rv, H37RvΔRv2569c, and H37RvΔRv2569c + Rv2569c per mouse for 1 day, 14 days, 30 days, and 45 days. Bacterial load, pathology, and cleavage of E-cadherin were evaluated. (B) Bacterial loads of the lung were evaluated by colony-counting at 1 day, 14 days, 30 days, and 45 days after infection. (C) and (D) Bacterial loads of the liver and spleen in the mice were quantified by colony-counting at 30 days and 45 days after infection. (E) Analysis of acid-fast staining of the lung in the mice at 30 days after infection. The error bars represent the SEM of four independent experiments. Two-way ANOVA, followed by Bonferronis multiple-comparison post-hoc test (*P < 0.05, **P < 0.01).
Fig 7
Fig 7. Gross pathology and histopathology of the lungs in mice after challenge with H37Rv, H37RvΔRv2569c, and H37RvΔRv2569c + Rv2569c strains at 30 days after infection.
(A) Gross appearance of the lung was examined to observe the severity of lung damage. The lung exhibited more severe bleeding after challenge with H37Rv and H37RvΔRv2569c + Rv2569c strains compared with H37RvΔRv2569c. (B) Gross pathology score of the lung. (C) Histopathology of the lung was conducted to evaluate the pathological damage. There was a greater inflammatory cell infiltration and macrophage aggregation in the lung challenged with H37Rv and H37RvΔRv2569c + Rv2569c strains compared with the lung challenged with H37RvΔRv2569c strains. Data indicate one experiment with 4 independent replicates. (D) Lung histopathology score. The error bars represent the SEM of four independent experiments. One-way ANOVA, followed by Bonferronis multiple-comparison post-hoc test (ns, nonsignificant; *P < 0.05).
Fig 8
Fig 8. Levels of E-cadherin protein were detected by western blot analysis in the lungs of mice after challenge with the H37Rv strains in vivo.
(A) Western blot analysis of the expression of E-cadherin in the lung after challenge with H37Rv, H37RvΔRv2569c, and H37RvΔRv2569c + Rv2569c at 14 days, 30 days, and 45 days after infection. (B) Relative protein expression of E-cadherin in the lung based on β-actin measured by Image J. (C) The level of E-cadherin in the lungs was observed by confocal microscopy with anti–E-cadherin (red) and nuclear staining with DAPI (blue) at 30 days after infection. Scale bars, 50 μm. The error bars represent the SEM of three independent experiments. Two-way ANOVA, followed by Bonferronis multiple-comparison post-hoc test (*P < 0.05).

Similar articles

Cited by

References

    1. Arnold C. Molecular evolution of Mycobacterium tuberculosis. Clin Microbiol Infect. 2007; 13: 120–128. doi: 10.1111/j.1469-0691.2006.01637.x - DOI - PubMed
    1. Bagcchi S. WHO’s Global Tuberculosis Report 2022. Lancet Microbe. 2023; 4: e20. doi: 10.1016/S2666-5247(22)00359-7 - DOI - PubMed
    1. Furin J, Cox H, Pai M. Tuberculosis. Lancet. 2019; 393: 1642–1656. doi: 10.1016/S0140-6736(19)30308-3 - DOI - PubMed
    1. Zuniga ES, Early J, Parish T. The future for early-stage tuberculosis drug discovery. Future Microbiol. 2015; 10: 217–229. doi: 10.2217/fmb.14.125 - DOI - PMC - PubMed
    1. Houben RM, Dodd PJ. The Global Burden of Latent Tuberculosis Infection: A Re-estimation Using Mathematical Modelling. PLoS Med. 2016; 13: e1002152. doi: 10.1371/journal.pmed.1002152 - DOI - PMC - PubMed

Publication types

LinkOut - more resources