. 2024 May 10;384(6696):eadk4858.
doi: 10.1126/science.adk4858. Epub 2024 May 10.

A petavoxel fragment of human cerebral cortex reconstructed at nanoscale resolution

Affiliations

A petavoxel fragment of human cerebral cortex reconstructed at nanoscale resolution

Alexander Shapson-Coe et al. Science. .

Abstract

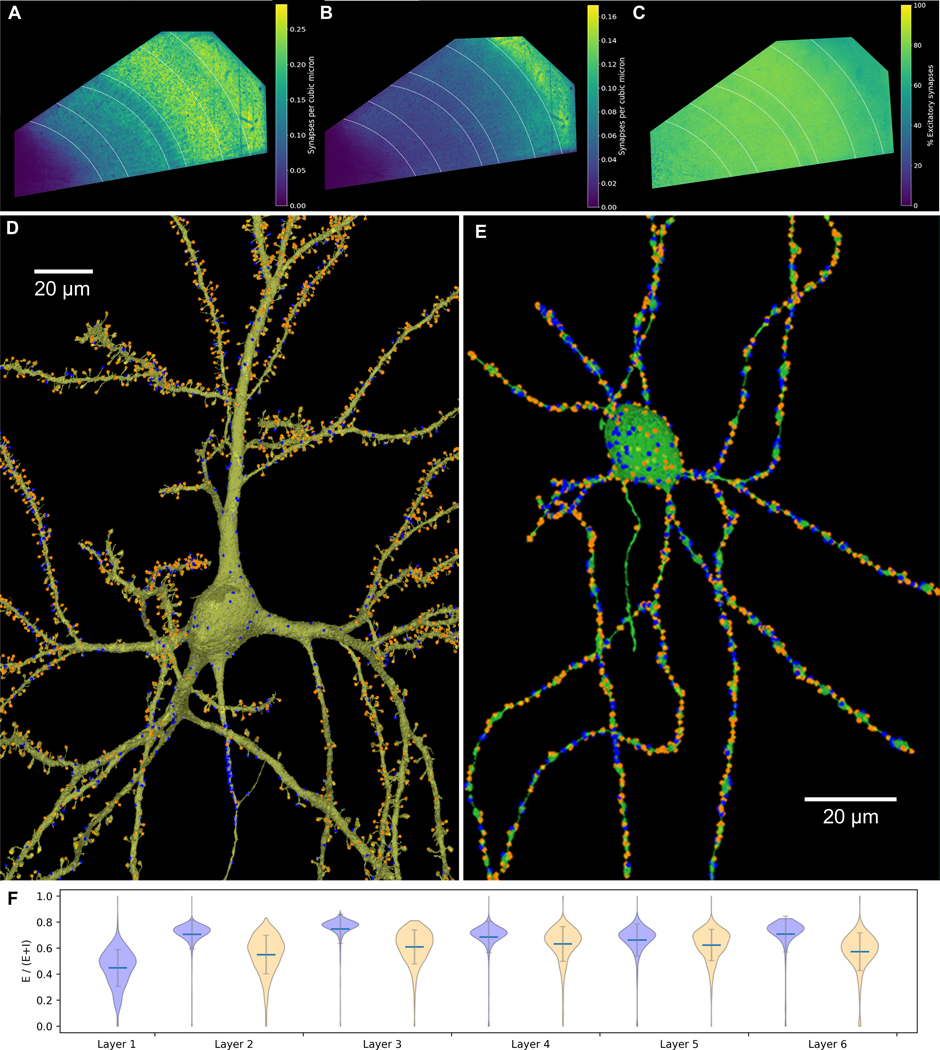
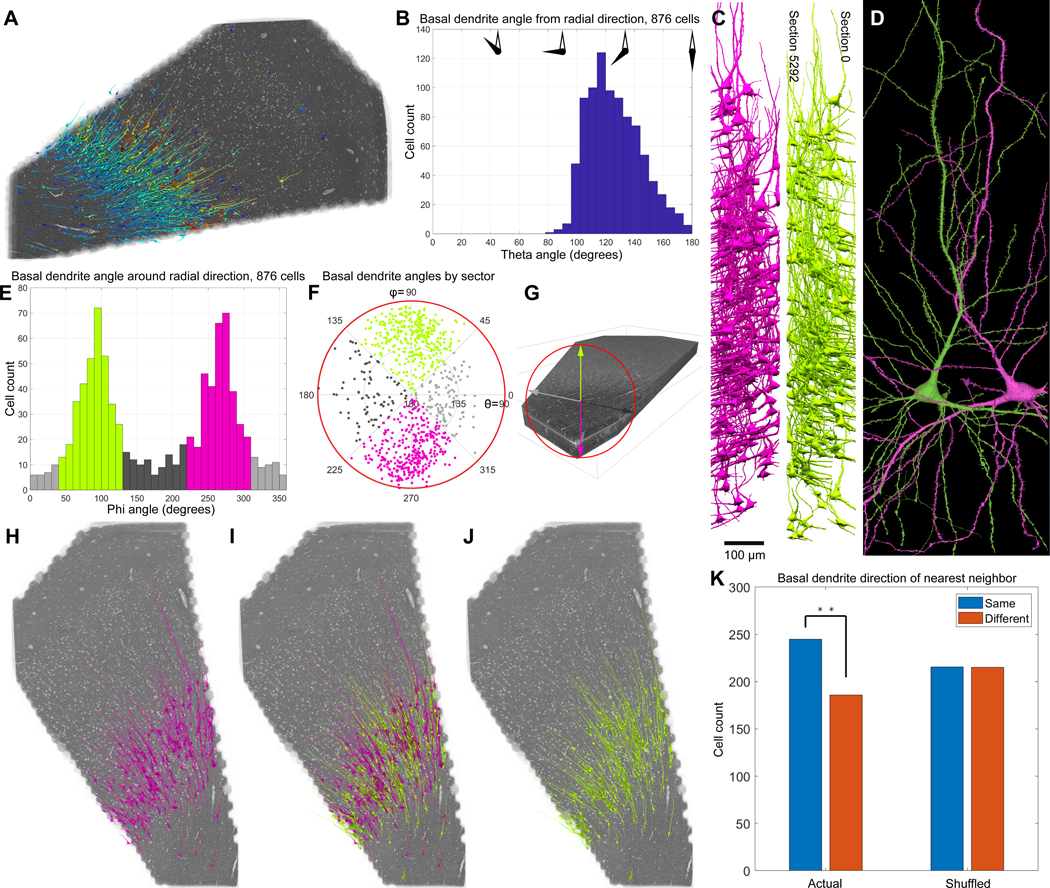
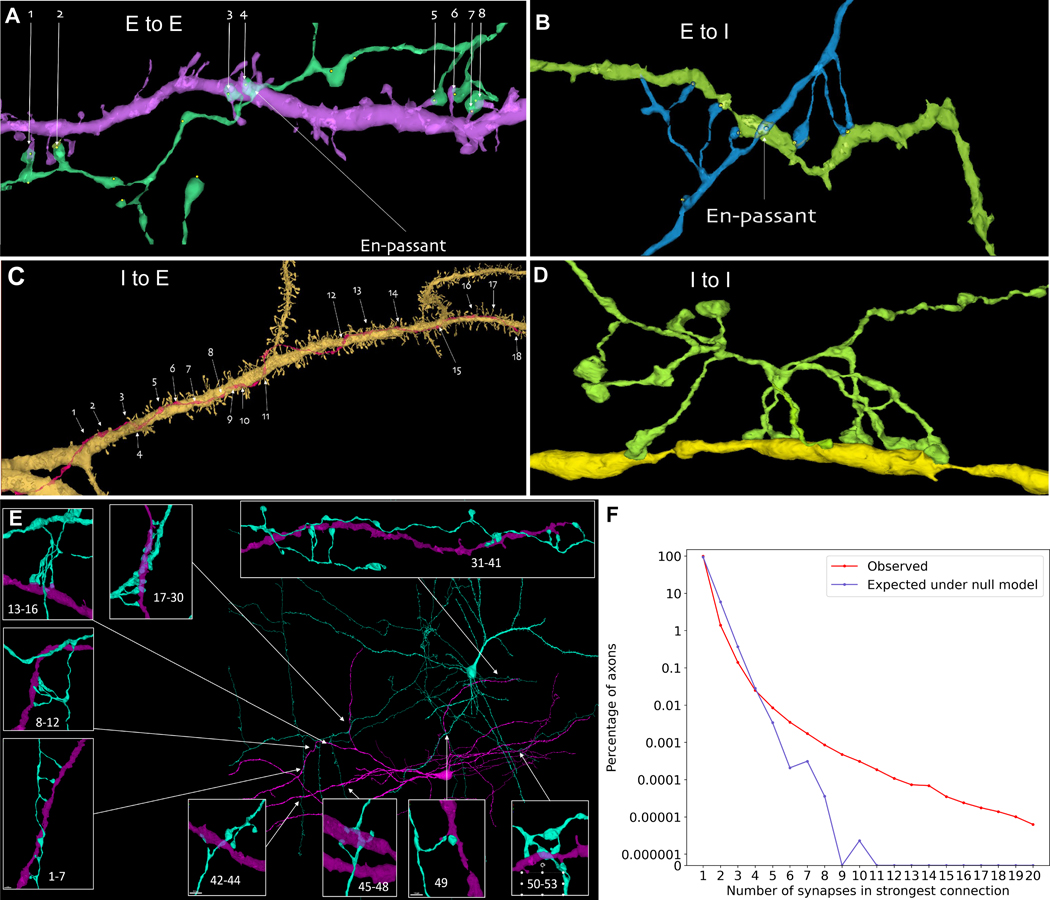
To fully understand how the human brain works, knowledge of its structure at high resolution is needed. Presented here is a computationally intensive reconstruction of the ultrastructure of a cubic millimeter of human temporal cortex that was surgically removed to gain access to an underlying epileptic focus. It contains about 57,000 cells, about 230 millimeters of blood vessels, and about 150 million synapses and comprises 1.4 petabytes. Our analysis showed that glia outnumber neurons 2:1, oligodendrocytes were the most common cell, deep layer excitatory neurons could be classified on the basis of dendritic orientation, and among thousands of weak connections to each neuron, there exist rare powerful axonal inputs of up to 50 synapses. Further studies using this resource may bring valuable insights into the mysteries of the human brain.


Conflict of interest statement

Competing interests: Authors declare that they have no competing interests.

Figures

Figure 1:
Figure 1:. The H01 dataset, image acquisition and alignment.
(A) A fresh human surgical cerebral cortex sample was rapidly preserved, stained, embedded in resin, sectioned at ~33 nm, collected on tape and imaged using the ATUM-mSEM method. The Zeiss mSEM electron microscope uses 61 beams that image a hexagonal area of about ~10,000 μm2 simultaneously, which allows for large areas to be imaged rapidly. For each section, all the resulting tiles are then stitched together (left; this section is about 4 mm2 in area and was imaged with 4 × 4 nm2 pixels - see image of synapse at right). Given the necessity of some overlap between the stitched tiles, this single section required the collection of more than 300 GB of data. (B) Fine-scale alignment with optical flow. Left: An XZ cross-section of the initial coarsely aligned subvolume exhibits drift and jitter. Center: Two adjacent XY sections z (green) and z-1 are overlaid to illustrate their misalignment. Image patch-based cross-correlation computes an XY flow field between them. Red and blue intensities, which indicate the respective horizontal and vertical flow components are used to warp one of the sections, improving their alignment (relax and warp overlay). Right: XZ view of the same subvolume with flow realignment applied.
Figure 2:
Figure 2:. Segmentation, split correction, merge error correction via neuronal sub-compartment classification and synapse prediction.
(A) Example of sequential segmentation with a Flood Filling Network (FFN). Objects are filled sequentially from seed locations until the 3D volume is segmented completely. (B) FFN agglomeration. Left: Site between two adjacent base segments (white box in 2D, black box in 3D below) is a candidate agglomeration location. Center: FFN segmentation is seeded from points A and B independently. Right: If the resulting A and B segmentations are mutually consistent, the object pair is merged (below). (C) Subcompartment prediction and merge error correction (link). Left: a single reconstructed object with a merge error where axon and dendrite cross near each other. The object is converted to a reduced skeleton representation (blue). Middle: fields of view around a subset of skeleton nodes are input to a subcompartment classification model. Red nodes: predicted dendrite; blue nodes: predicted axon. The inconsistency in subcompartment predictions is detected, and the agglomeration graph is cut at the location that maximally improves subcompartment consistency. Right: the separated axon and dendrite after applying the suggested cut. (D) Synapse detection and classification. Top: XY cross-section of EM image input to synapse detection model (left), and the resulting presynaptic (magenta) and postsynaptic (green) prediction masks (right). Bottom: cross-section of EM image and presynaptic (left red, right blue) and postsynaptic (green) object segmentation inputs to excitatory versus inhibitory classification model. Right: 3D render of a dendrite with predicted incoming excitatory (yellow) and inhibitory (blue) synaptic sites.
Figure 3.
Figure 3.. The segmented H01 volume.
Left: Oblique view of the H01 dataset following all automatic segmentation steps, trimmed to the fully imaged volume, and stretched to compensate for section compression from ultrathin sectioning. The C3 auto-segmentation is overlaid in random color. Right: Cut-out of the dataset at the location of the red rectangle in G, showing a cross-section of the aligned image stack. The pink lines show where the two sectioning series join (‘Phase 1’ and ‘Phase 2’).
Figure 4:
Figure 4:. Distribution of cells, blood vessels and myelin in the sample.
White lines indicate layer boundaries based on cell clustering. (A) All 49,080 cell bodies of neurons and glia in the sample, colored by soma volume. (B) Blood vessels and the nuclei of the 8,136 associated cells (link). Inset shows a magnified view of the location of the individual cell types. (C) Spiny neurons (n=10531; putatively excitatory), colored by soma volume. (D) Interneurons (n=4688; few spines, putatively inhibitory), colored by soma volume. (E) Astrocytes (n=5474) mostly tile but in some cases, arbors of nearby astrocytes interdigitate. (F) Most of the oligodendrocytes (n=20139) in the volume. Note clustering along large blood vessels, especially in white matter. (G) Cell bodies (n=6702) of microglia and oligodendrocyte precursor cells (OPCs). (H) Myelinated axons in the volume, color-coded by topological orientation. Most axons in white matter run in the perpendicular direction. Thick axon bundles run between white matter and cortex in the radial direction. In layer 1, a set of large-caliber myelinated axons runs tangentially through our slice, parallel to the pia. In layers 3–6 many myelinated axons also run in diagonal (tangential/perpendicular) directions. Images and scale bar as in sections (with ultrathin sectioning compression).
Figure 5:
Figure 5:. Synapse distributions.
(A) Volumetric density of excitatory (E) synapses. (B) Volumetric density of inhibitory (I) synapses. (C) Percentage of E synapses in different layers (E/E+I * 100%). Lowest values are purple, highest values are yellow. (D) Representative pyramidal neuron; note that synapses on the AIS, cell body and proximal dendrites were largely I (blue), whereas in the spiny dendritic regions there were more E synapses (orange) than I. Of the three compartments, the density of synapses is highest along the AIS and strikingly sparse on the soma. (E) Representative interneuron, with E (orange) and I (blue) synapses distributed more uniformly along dendrites and the cell soma and few if any synapses on the AIS. (F) Violin plot showing balance of E and I synapses (E/E+I) established onto interneurons (blue) and pyramidal neurons (orange), analyzed separately by the cortical layer location of neurons’ cell bodies. Gray bars indicate 1 SD from the mean (blue line).
Figure 6:
Figure 6:. Two mirror symmetrical subgroups of deep layer triangular neurons.
(A) Location of neurons with both one large apical and one large basal dendrite; most are found in layers 5 and 6. Color represents cell soma size, as in fig. 4A. (B) Distribution of directions of the basal dendrites of triangular neurons, where the direction is the angle between the radial direction and the basal dendrite direction. (C) Side view of the neurons with apical dendrites pointing either forward in the z-stack (magenta) or in the reverse direction (light green). Notice, as shown in panel B, that many of the magenta or light green neurons project their large basal dendrite at very similar angles. (D) Example of two triangular neurons with basal dendrites pointing in opposite directions showing the mirror symmetry of these two subgroups. (E) The histogram of basal dendrite angles around the radial direction shows a clear bimodal distribution with peaks at 90 and 270 degrees representing the light green and magenta groups respectively. (F) Polar plot of the data in B and E. Light green: 339 triangular cells with basal dendrite pointing towards section 0; magenta: 347 triangular cells with basal dendrite pointing towards section 5292; light and dark gray: 106 and 80 triangular cells with basal dendrite pointing sideways in the cutting plane. 4 triangular cells were excluded because their basal dendrite pointed away from the white matter. (G) Explanation of the directional color coding in this figure. (H, I, J) Anatomical clustering among members of the two subgroups, to exclude edge bias we limited analysis to cells with cell bodies centered in the middle half of the image stack (sections 1323 – 3970; n=431, 218 forward, 213 reverse). (K) The neurons shown in I are significantly more likely adjacent to a neuron whose large basal dendrite points in the same direction as they do (Fisher’s exact test, p=0.005).
Figure 7:
Figure 7:. Unusually powerful synaptic connections.
Despite their rarity, in such big data there are many strong connections between excitatory and inhibitory neurons. (A) An excitatory axon (green) forms 8 synapses onto a spiny dendrite of an excitatory neuron (purple). One synapse is en passant and the rest appear to require directed growth of the axon to contact the same dendrite. (B) An excitatory axon (blue) forms 8 synapses onto a smooth dendrite of an inhibitory neuron (green) again with one en passant connection and the rest apparently requiring directed growth. (C) An inhibitory axon (red) forming 18 synapses on the apical dendrite of a spiny pyramidal excitatory neuron (yellow). (D) An inhibitory axon (green) forming 9 synapses onto the smooth dendrite (yellow) of another inhibitory neuron. (E) 53 synaptic connections from a proofread layer 3 pyramidal neuron onto a nearby inhibitory interneuron. (F) A plot showing incidence of axons establishing between 1 and 20 synapses to individual postsynaptic target cells (red line), with the incidence expressed as the percentage (plotted on a log scale) of axons making a strongest partner connection of N synapses (N ranges from 1 to 20). The observed incidence of strong connections far exceeds that expected under a null model where these same axons randomly establish the same number of synapses but are slightly displaced in space (blue line). For all connection strengths greater than 3 synapses, axons show more multiple synapses than expected by chance.

References

    1. Tuch DS, Reese TG, Wiegell MR, Makris N, Belliveau JW, Wedeen VJ, High angular resolution diffusion imaging reveals intravoxel white matter fiber heterogeneity. Magn. Reson. Med 48, 577–582 (2002). - PubMed
    1. Edlow BL, Mareyam A, Horn A, Polimeni JR, Witzel T, Tisdall MD, Augustinack JC, Stockmann JP, Diamond BR, Stevens A, Tirrell LS, Folkerth RD, Wald LL, Fischl B, van der Kouwe A, 7 Tesla MRI of the ex vivo human brain at 100 micron resolution. Sci Data. 6, 244 (2019). - PMC - PubMed
    1. Bijsterbosch J, Harrison SJ, Jbabdi S, Woolrich M, Beckmann C, Smith S, Duff EP, Challenges and future directions for representations of functional brain organization. Nat. Neurosci 23, 1484–1495 (2020). - PubMed
    1. Yendiki A, Aggarwal M, Axer M, Howard AFD, van C A-M. van Walsum, Haber SN, Post mortem mapping of connectional anatomy for the validation of diffusion MRI. Neuroimage. 256, 119146 (2022). - PMC - PubMed
    1. Axer M, Amunts K, Scale matters: The nested human connectome. Science. 378, 500–504 (2022). - PubMed

Publication types

LinkOut - more resources