Observational Study
. 2024 Jun:104:105136.
doi: 10.1016/j.ebiom.2024.105136. Epub 2024 May 8.

MDA5-autoimmunity and interstitial pneumonitis contemporaneous with the COVID-19 pandemic (MIP-C)

Affiliations
Observational Study

MDA5-autoimmunity and interstitial pneumonitis contemporaneous with the COVID-19 pandemic (MIP-C)

Paula David et al. EBioMedicine. 2024 Jun.

Abstract

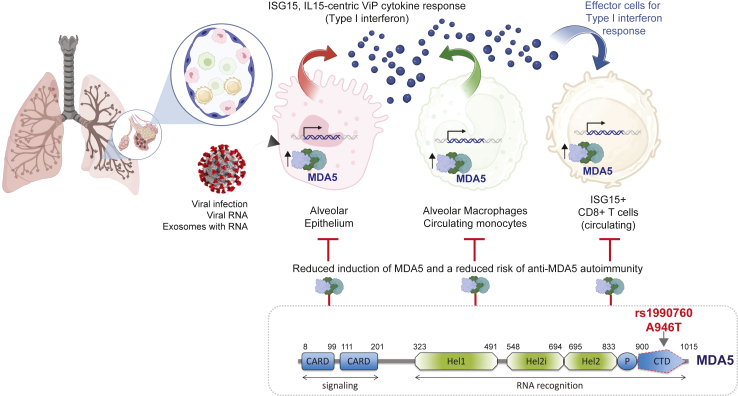
Background: Anti-MDA5 (Melanoma differentiation-associated protein-5) positive dermatomyositis (MDA5+-DM) is characterised by rapidly progressive interstitial lung disease (ILD) and high mortality. MDA5 is an RNA sensor and a key pattern recognition receptor for the SARS-CoV-2 virus.

Methods: This is a retrospective observational study of a surge in MDA5 autoimmunity, as determined using a 15 muscle-specific autoantibodies (MSAs) panel, between Janurary 2018 and December 2022 in Yorkshire, UK. MDA5-positivity was correlated with clinical features and outcome, and regional SARS-CoV-2 positivity and vaccination rates. Gene expression patterns in COVID-19 were compared with autoimmune lung disease and idiopathic pulmonary fibrosis (IPF) to gain clues into the genesis of the observed MDA5+-DM outbreak.

Findings: Sixty new anti-MDA5+, but not other MSAs surged between 2020 and 2022, increasing from 0.4% in 2019 to 2.1% (2020), 4.8% (2021) and 1.7% (2022). Few (8/60) had a prior history of confirmed COVID-19, peak rates overlapped with regional SARS-COV-2 community positivity rates in 2021, and 58% (35/60) had received anti-SARS-CoV-2 vaccines. 25/60 cases developed ILD which rapidly progression with death in 8 cases. Among the 35/60 non-ILD cases, 14 had myositis, 17 Raynaud phenomena and 10 had dermatomyositis spectrum rashes. Transcriptomic studies showed strong IFIH1 (gene encoding for MDA5) induction in COVID-19 and autoimmune-ILD, but not IPF, and IFIH1 strongly correlated with an IL-15-centric type-1 interferon response and an activated CD8+ T cell signature that is an immunologic hallmark of progressive ILD in the setting of systemic autoimmune rheumatic diseases. The IFIH1 rs1990760TT variant blunted such response.

Interpretation: A distinct pattern of MDA5-autoimmunity cases surged contemporaneously with circulation of the SARS-COV-2 virus during COVID-19. Bioinformatic insights suggest a shared immunopathology with known autoimmune lung disease mechanisms.

Funding: This work was supported in part by the National Institute for Health Research (NIHR) Leeds Biomedical Research Centre (BRC), and in part by the National Institutes of Health (NIH) grant R01-AI155696 and pilot awards from the UC Office of the President (UCOP)-RGPO (R00RG2628, R00RG2642 and R01RG3780) to P.G. S.S was supported in part by R01-AI141630 (to P.G) and in part through funds from the American Association of Immunologists (AAI) Intersect Fellowship Program for Computational Scientists and Immunologists.

Keywords: Autoimmune Raynauds; Autoimmune rashes; Coronavirus-19 (Covid-19); Interstitial lung disease (ILD); MDA5-autoimmunity and interstitial pneumonitis contemporaneous with the COVID-19 (MIP-C); Melanoma differentiation-associated protein-5 (MDA5).


Conflict of interest statement

Declaration of interests The authors declare that they have no financial conflict of interests for this study.

Figures

Fig. 1
Fig. 1
Study Motivation, Design and Major Findings: Schematic summarizes the retrospective study design and motivation (Step 1), and the phenotypical and epidemiological features observed in our cohort (Step 2). It also highlights the analyses of diverse transcriptomics datasets (Step 3) which were carried out to interrogate how COVID-19 infection interacts with IFIH1 gene (encodes MDA5) and disease risk signatures for the development of interstitial pneumonitis of various types. Finally, we summarize findings and propose a working model linking epidemiologic findings to the insights drawn from transcriptomic analyses.
Fig. 2
Fig. 2
Rate of MDA5+ testing 2018 to 2022. A. Heatmap (top) shows the fold change in MDA5+ for each of the tested muscle-specific autoantibodies (MSAs), including anti-MDA5 (using Euroimmun immunoblot©). Table (bottom) provides the actual patient numbers. B and C. Graphs display the overlay of newly detected anti-MDA5 positivity (blue; A-B) with either total COVID-19 cases (red; A) or the rate of new vaccination (yellow; B) that were reported in the Yorkshire and Humber regions since Jan 2021 to Dec 2022. The COVID-19 case rates and vaccination rates were obtained from the UK.gov database (https://coronavirus.data.gov.uk/). Red arrowheads denote the four waves of COVID-19 cases.
Fig. 3
Fig. 3
IFIH1 and autoimmune ILD gene signatures are induced in diverse cell types in CoV lung, including the alveolar epithelium. A. Schematic showing the study design for panels A–B. B. Bubble plot of ROC-AUC values (radii of circles are based on the ROC-AUC) demonstrating the direction of gene regulation (Up, red; Down, blue) for the classification of various cell types between healthy and CoV lung based on various gene signatures in Fig. 3A, which includes several signatures of AT2 cytopathies that are encountered and implicated in ILD. Numbers indicate PMIDs. Welch's two sample (H vs CoV) unpaired t-test is performed on the composite gene signature score (z-score of normalized tpm count) to compute the p values [∗. p ≤ 0.05; ∗∗. p ≤ 0.01; ∗∗∗. p ≤ 0.001]. C and D. Schematic summarizes the study design for GSE174668. Panel C shows the natural course of COVID-19 which includes pre-symptomatic (S1), hyperinflammatory (S2), resolution (S3) and convalescent (S4) phases. Typically, S1-2 is SARS-CoV-2 RNA positive and has mixed inflammation and immunosuppression as host immune response to the virus. The second half (S3-4) is characterized by host immune response that is geared towards resolution of inflammation and restoration of homeostasis. Exosome-enriched EVs were isolated from fasting plasma from healthy controls and COVID-19 patients from and then applied on two cell types (Panel D) for 12 h at 37 °C prior to RNA Seq analysis. E and F: Bubble plot of ROC-AUC values (radii of circles are based on the ROC-AUC) demonstrating the direction of gene regulation (Up, red; Down, blue) for the classification of cells treated with EVs from healthy controls vs those isolated from the indicated phase of CoV infection (S1-4) based on various gene signatures in Fig. 3A, which includes several signatures of AT2 cytopathies that are encountered and implicated in ILD. Numbers indicate PMIDs. Welch's two sample (H vs CoV) unpaired t-test is performed on the composite gene signature score (z-score of normalized tpm count) to compute the p values [∗. p ≤ 0.05; ∗∗. p ≤ 0.01]. BALF, bronchoalveolar lavage fluid; H, healthy; CoV, COVID-19; AT2, alveolar type 2 pneumocytes; DATP, damage-associated transient progenitors; SSc, Systemic scleroderma; Sen, senescence.
Fig. 4
Fig. 4
Induction of IFIH1 in COVID-19 correlates with a Type 1-IFN storm and anti-MDA5-ILD risk signatures in PBMCs. A. Schematic of the workflow in this figure, indicating the types of samples analysed and the gene expression signatures tested. B and C. Scatter plots show the relationships between IFIH1 expression (Y axis) and the compositive scores of four different gene expression signatures (X axis) in PBMCs from patients with COVID-19. Top panels in B show all three rs1990760 variant types. Bottom panels in C show just the TT variant. Interrupted lines are drawn arbitrarily to divide the graph into quadrants with low–low and high–high distributions to separate the patients who suppressed IFIH1 in the TT genotype from those who did not. D. Graphical representation of a correlation matrix representing the correlation between the variables in B–C and additional variables, i.e., composite scores of different gene signatures elaborated in panel A. The colour key spans from −1 (magenta) to 1 (green), indicating both strength and direction of correlation. Numbers within the heatmap indicate statistical significance (only significant p values are displayed). E and F. Correlation matrix showing the correlation between multiple gene signatures (as in D), on two other independent COVID-19 (CoV) patient-derived PBMC datasets. See Supplementary Figure S2 for similar analyses on three independent PBMC and whole blood datasets representing other respiratory viral pandemics. G. Violin plots show the degree of induction of IFIH1 (transcripts per million; tpm) and various gene expression signature (composite scores) in male or female patients presenting with moderate (non-ICU) or severe (ICU) COVID-19. Welch's two sample (ICU vs non-ICU) unpaired t-test is performed on the tpm (for IFIH1) or the composite gene signature score (z-score of normalized tpm count) to compute the p values (only significant p values are displayed). The shaded region indicates the 95% confidence interval around the regression line.
Fig. 5
Fig. 5
The rs1990760 TT variant of IFIH1 offers an age-dependent protection against MDA5 surge. A and B. Multivariate analysis of IFIH1 expression as a linear combination of all variables in the COVID-19 PBMC datasets GSE233626 (n = 42) (A) and GSE233627 (n = 21) (B). Coefficient of each variable (at the center) with 95% confidence intervals (as error bars) and the p values were illustrated in the bar plot. The p-value for each term tests the null hypothesis that the coefficient is equal to zero (no effect). Red = significant co-variates. C–E. Two distinct subgroups of COVID-19 patients with the rs1990760 TT genotype (groups 1 and 2 in the scatter plot in A) were assessed for differentially expressed genes (DEGs; B). Lollipop graph (C) displays the findings of a gene ontology (GO) analysis on the list of 26 genes upregulated in group 2. F. Heatmap displays DEGs (26 up- and 3 down-regulated; LogFC >2, pAdj 0.05) in group 2 PBMCs compared to group 1. G. Violin plots display the composite score of the DEGs (used as a gene signature) in two independent transcriptomic datasets of lung tissues from subjects with undefined (UIP) or non-specific (NSIP) interstitial pneumonitis and non-diseased controls.
Fig. 6
Fig. 6
Summary and working model. Schematic summarizes major conclusions and a proposed working model. A type 1-centric interferon response to the same could serve as pathophysiologic driver of autoimmune ILD involving more than one cell type. From left to right (Top): (i) In the alveolar pneumocytes of COVID-19 lungs, MDA5 is induced and is associated with type 1 interferon response, AT2 senescence and stem cell dysfunction. MDA5 is induced also in lung epithelial cells upon exposure to exosome vesicles from patients with acute infection. (ii) In the PBMCs of COVID-19 patients MDA5 is induced in infected samples, and its degree of induction positively and tightly correlates with an IL-15 centric type 1 interferon response. (iii) In the PBMCs of COVID-19 patients, there is a concomitant induction of a signature for anti-MDA5 autoimmune ILD expressed in ISG15+ CD8+ T cells. Bottom panel shows the impact of a protective genotype of the IFIH1 gene which inhibits a subset of patients from inducing MDA5 and thereby protects them from a surge of type 1 interferon storm.

Update of

References

    1. Reichlin M., Mattioli M. Description of a serological reaction characteristic of polymyositis. Clin Immunol Immunopathol. 1976;5:12–20. doi: 10.1016/0090-1229(76)90145-8. - DOI - PubMed
    1. Astorri D., Nalotto L., Vaccaro E., et al. AB0715 anti-MDA5 dermatomyositis after BNT162b2 vaccination. Ann Rheum Dis. 2022;81:1484. doi: 10.1136/annrheumdis-2022-eular.3988. - DOI
    1. Gonzalez D., Gupta L., Murthy V., et al. Anti-MDA5 dermatomyositis after COVID-19 vaccination: a case-based review. Rheumatol Int. 2022;42:1629–1641. doi: 10.1007/s00296-022-05149-6. - DOI - PMC - PubMed
    1. Kitajima T., Funauchi A., Nakajima T., Marumo S., Imura Y., Fukui M. Antimelanoma differentiation-associated gene 5 antibody-positive interstitial lung disease after vaccination with COVID-19 mRNA vaccines. J Rheumatol. 2022;49:1158–1162. doi: 10.3899/jrheum.220259. - DOI - PubMed
    1. Sugimoto T., Yorishima A., Oka N., et al. Appearance of anti-MDA5 antibody-positive dermatomyositis after COVID-19 vaccination. Mod Rheumatol Case Rep. 2023;7:108–112. doi: 10.1093/mrcr/rxac064. - DOI - PubMed

Publication types

Substances